
QUANTIFICATION OF MUSCLE FATIGUE WITH WAVELET
ANALYSIS BASED ON EMG DURING MYOELECTRICAL
STIMULATION
M. Yochum
1
, T. Bakir
1
, R. Lepers
2
and S. Binczak
1
1
LE2I CNRS UMR 5158, Universit
´
e de Bourgogne, 9 avenue Alain Savary, BP47870 21078 Dijon cedex, France
2
INSERM U887, Universit
´
e de Bourgogne, BP 27877 21078 Dijon cedex, France
Keywords:
Fatigue, Electromyogram, Wavelet, Electrical stimulation.
Abstract:
We propose a device dedicated to real time analysis of electromyograms (EMG) under myoelectrical stimu-
lation (ES). The muscular fatigue analysis, which is obtained by the use of a dedicated analog circuit and a
processing part, is the main purpose of this study. The description of a hardware device which incorporates
an electro-stimulator and an electromyogram amplifier combined to a computer is detailed. Then, we present
a muscular fatigue analysis part based on wavelet decomposition in order to extract a fatigue index, which is
confronted with synthetic and experimental data. We conclude that the CWT index applies well to M waves.
The noise sensitivity is investigated.
1 INTRODUCTION
Devices using the myoelectrical stimulation (ES)
and the analysis of electromyograms (EMG) become
more sophisticated and their applications continue to
grow. It is the case especially for muscular reha-
bilitation systems (Chilibeck et al., 1999) for peo-
ple who have had nerves trauma like paraplegics or
hemiplegics and for people who have had a tempo-
rary immobilization of one or more limbs leading up
to muscle atrophies. Other applications allow FES as-
sisted gait (Matjai et al., 2003; Iwami et al., 2009;
Hunt and Stone, 2004), equally in medicine with the
intention of search myasthenia or muscular degener-
ations (Stein and Mushahwar, 2005). The ES retards
and even inverses the muscular atrophy. The first goal
is to increase the muscle mass by artificial contrac-
tions of muscles. In this way, muscles react as dur-
ing a real exercise and create more muscular tissues
(Erika Scremin et al., 1999).
Electrical stimulators have considerably changed
since their discovery (Dolhem, 2008) and some fol-
low a predefined program with current controlled in-
jection (Velloso and Souza, 2007). EMGs allow ob-
taining some informations about the muscle contrac-
tions. These informations can give the state of a mus-
cle or its changes over time. Recent works show the
use of those indexes in order to manage a dedicated
electrical stimulation (Yeom and Chang, 2010; Sink-
jaer et al., 2003). The fatigue analysis during a mus-
cular effort can be essential. When a patient does
not feel the fatigue, it can be transcribed by an in-
dex resulting from the evaluation of EMG (Mizrahi
et al., 2002). During ES, a typical electrical response
appears on EMGs: the M Waves (Chesler and Dur-
fee, 1997). This is usually a biphasic wave. It is
proved that those wave shapes are changing during
an electrical stimulation (Thomas, 1997). It is these
changes which are used to determine the muscular fa-
tigue (Knaflitz and Deluca, 1990).
Various indices of muscle fatigue are available
with different types of signals. The most common
are performed on EMGs which are acquired dur-
ing voluntary or electrically stimulated contractions
(Mizmhi, 1997). Others indexes use the muscle
strength developed (Tepavac and Schwirtlich, 1997).
In our case, for EMGs, one can cite the Peak to Peak
(PTP), Root Mean Square (RMS), Mean Frequency
(F
mean
) and Median Frequency (F
med
) or also the
power spectral density and the zero crossing (Mizmhi,
1997; Tepavac and Schwirtlich, 1997; Chesler and
Durfee, 1997).
Some recent articles apply wavelet treatments for
fatigue analysis. It is, mostly, obtained by discrete
wavelet transform (DWT) where common wavelets
are used (Kumar et al., 2004; Vukova et al., 2008).
53
Yochum M., Bakir T., Lepers R. and Binczak S..
QUANTIFICATION OF MUSCLE FATIGUE WITH WAVELET ANALYSIS BASED ON EMG DURING MYOELECTRICAL STIMULATION.
DOI: 10.5220/0003778600530058
In Proceedings of the International Conference on Biomedical Electronics and Devices (BIODEVICES-2012), pages 53-58
ISBN: 978-989-8425-91-1
Copyright
c
2012 SCITEPRESS (Science and Technology Publications, Lda.)

In this context, we introduce in section 2 a new
electro stimulator with EMG feedback and a software
which work in real time. Many fatigue treatments
were implemented, some from literature and a new
one, based on continuous wavelet transform (CWT),
which is detailed in section 3. Tests have been made
on synthetic and experimental EMG, which are pre-
sented in section 4 while in section 5, the influence of
noise is also investigated because EMGs are very little
signals easily corrupted by the noise. Finally section
6 discusses the presented results on real experimental
data and section 7 concludes this article.
2 MATERIAL
We introduce a new electro stimulator allowing the
electrical stimulation of a muscle and the fatigue anal-
ysis applied to the EMGs feedback in real-time. The
device is composed of a hardware part dedicated to
deliver stimulations and EMGs amplifications. A
software part allows the control of the stimulation and
computes the fatigue index. A NIDaq module con-
nects these two parts making the system processing
in real-time. Hardware is composed of two parts.
The first one is a stimulation board whose circuit is
represented on Figure 1. In order to have the same
stimulation for all muscles, we decided to use con-
troled injection currents. The circuit is inspired by the
work of Han-Chang Wu & al (Wu et al., 2002). The
board works symmetrically, the top part is for positive
phases and the bottom part for negative phases. The
software generates stimulation pulses from −10 V to
10 V . The OPAs copy the voltage V
in
onto V
opa
with a
null input current. Then, pulse voltages are converted
in pulse currents thanks to R1 and Q1 in order to ob-
tain Ic such as Ic =
V
opa
R
1
=
V
in
R
1
. This current can be
maintained thanks to the high tension on V DD and
−V DD. Ic is then copied into the stimulation elec-
trodes by the Wilson current mirror (Q
2
, Q
3
, Q
4
, R
2
and R
3
).
Figure 2 shows the EMG board circuit which is
the second hardware part. We use surface electrodes
because it is a non invasive and painless equipment,
although the electrodes positions are crucial (Rutkove
et al., 2005). Indeed, EMG signals vary according to
their positions on the skin (Rutkove et al., 2005). Two
electrodes are on the muscle (E
1
and E
2
) and another
laid on a bony point (E
re f
) acting as a reference volt-
age. This board makes the difference between two
voltages of the muscle with a large amplification and
reference removal. The two instrumentation ampli-
fiers (INA) U
1
and U
2
are used to erase the reference
voltage of the body for E
1
and E
2
.
Figure 1: Stimulation diagram.
V
Ei
= G
i
·(E
i
−E
re f
), with G
i
=
50
RP
i
, (1)
where i = {1,2} indicates which electrode is con-
cerned and RP
i
is in KΩ. In many EMG amplifiers,
just one INA is used to obtain the difference between
the two muscular electrodes (Mesin et al., 2009). In
our case, we have access to the muscular activity of
each electrode. Then, the difference between them is
obtained by the same method (eq. 1), consequently
V
EMG
= G
3
·(V
E1
−V
E2
). Note that V
EMG
can be fil-
tered with a pass band filter.
The software is developed with Labview. It al-
lows to choose many stimulation parameters in or-
der to have different stimulation pulse shapes and se-
quences. The current amplitude can vary from 0 mA
to 100 mA, the duration of pulses can be set from
500 µs to 2000 µs, the frequency of pulse train from
10 Hz to 100 Hz. The shape of pulses have been
chosen among the most common ones in the litera-
ture (Watanabe et al., 2000; Karu et al., 2002) such as
Monophasic ones, Biphasic ones, Dual Biphasic ones,
Asymetric Biphasic ones and Doublet Nlet ones. The
stimulation and rest duration and the kind of fatigue
treatment are also adjustable. Many graphics have
been added in order to visualize the electrical activity
such as the representation of one period of stimula-
tion pulses, the ongoing EMG signal in real time, the
reference M wave and fatigue analysis results.
BIODEVICES 2012 - International Conference on Biomedical Electronics and Devices
54

Figure 2: EMG diagram.
3 FATIGUE DETERMINATION
The EMG board leads to obtain the muscular electri-
cal activity but also the stimulation artifacts (Fig 3.a).
The elimination of these artifacts are delicate because
M waves are in the same ranges of frequency. The
method of artifacts removal which has been chosen is
a two-stage peak detection algorithm (O’Keeffe et al.,
2001). A signal with this artifact removal is given as
example in Fig 3.b. The first M wave is used to con-
struct a wavelet pattern from which the dilation of the
folowing M waves is deduced by using the continuous
wavelet transform (CWT), that is:
C
a,b
=
Z
R
s(t)
1
√
a
ψ
t −b
a
dt, (2)
8.3 8.35 8.4 8.45 8.5
−10
0
10
a.
Original EMG Signal
8.3 8.35 8.4 8.45 8.5
−1
0
1
b.
EMG Signal without Artifacts
8.3 8.35 8.4 8.45 8.5
0
100
200
Time (s)
c.
Scale a
Local Maxima
Figure 3: Example of artifact removal. a. EMG signal from
EMG board b. EMG without artifacts c. Local maxima cir-
cles represent the values of CWT coefficients in top vision
like topographical view. Big circles are small values and
small circles are high values.
with s(t) the signal, (i.e. the EMG signals), ψ the used
wavelet (in our case, it is the first M wave) and a
the applied scale factor. For each received M wave
during the stimulation, a local maxima algorithm is
used on the results of CWT, leading to find the best
match between the scale factor and the temporal ex-
pansion of M waves. Figure 3.c shows some levels
of CWT coefficients, the smallest circles correspond-
ing to the highest values. Those indexes represent the
expansion undergone by the M wave reference dur-
ing the stimulation. The scales from local maxima
are used as fatigue indexes. The indexes of fatigue
from literature move downward zero over time, con-
trary to CWT indexes which go up from 1. In order
to keep this tendency, the inverse of scale parameters
have been taken as I
CWT
= 1/a. Resulting curves are
displayed in Figure 7. In addition to our fatigue index
based on the CWT, other indexes were implemented
in the software. Those treatments are directly in-
spired from literature (Thomas, 1997; Mizmhi, 1997;
Chesler and Durfee, 1997; Mizrahi et al., 1997). Two
indexes are based on magnitude, Peak To Peak (PTP)
and Root Mean Square (RMS) and two others are fre-
quency based, Mean Frequency (F
mean
) and Median
Frequency (F
med
).
4 TEST WITH SYNTHETIC
SIGNALS
Synthetic EMG signals have been realized to check
the CWT fatigue algorithm by using a M wave refer-
ence recorded experimentally. Then, thanks to those
reference M waves, synthetic EMGs are created. Fig-
ure 4 illustrates the method for the experimental M
wave (Fig 4.a). The M wave reference is temporally
increasingly dilated by a factor from 1 to 3 (Fig 4.b).
Then, each resulting M wave is juxtaposed (Fig 4.c)
and weighted by a decreasing exponential envelope to
give a synthetic realistic EMG (Fig 4.d).
The CWT algorithm is applied on the synthetic
EMGs. Figure 5 shows the results for experimental
based EMG signal. To check the efficiency of this al-
gorithm, a mean-square error measure is performed.
This error is computed as:
ER
mean
=
1
n
n
∑
i=1
|
FR
i
−IR
i
|
IR
i
×100, (3)
where ER is means of error ratio, FR are found results
and IR are ideal results. n represents the number of
analysed M wave. Table 1 at the line ”without noise”
displays this error ratio, which is equal to 1.04% for
the synthetic EMG based on an experimental M wave.
QUANTIFICATION OF MUSCLE FATIGUE WITH WAVELET ANALYSIS BASED ON EMG DURING
MYOELECTRICAL STIMULATION
55
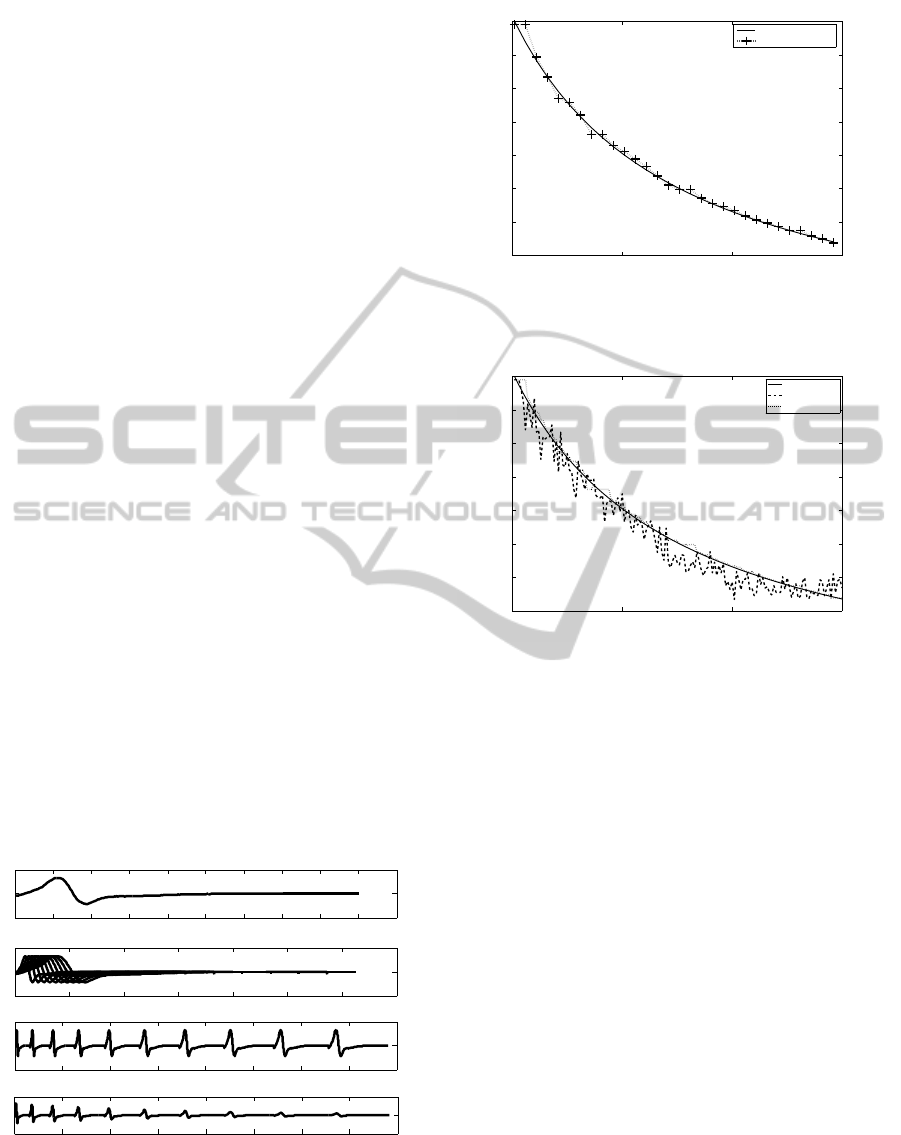
The error rate indicates that the CWT based index ap-
plies quite well to experimental M waves.
5 NOISE SENSITIVITY
EMGs are very little signals that can engender a sig-
nificant noise to signal ratio (NSR). Therefore, it may
be useful to study the influence of noise on the pro-
cess. A standard uniform noise distribution on the
open interval (-1,1) is used. Then it is multiplied by
a factor defined on a certain percentage of maximum
voltage of EMG and the EMG signal and noise are
added. Figure 6 shows the CWT fatigue indexes on
a experimental based EMG signal under noise (the
magnitude of noise was 10 % of the V
EMG
maxima).
The dot line corresponds to the ideal case, the dashed
line to a noisy EMG signal and the continuous line to
a pure EMG one. Obviously, the results with noisy
EMG are worse than pure EMG.
With the intention of reducing the noise impact
on the CWT based index, five filters have been im-
plemented. Those filters can be separated into two
groups; the filters of the first group are applied to
EMG signals. In this case, the filtering which is ap-
plied before the fatigue extraction can be a simple low
pass 1D Butterworth one or a 1D wavelet one which
uses the discrete stationary wavelet transform (SWT).
The second group corresponds to some filtering ap-
plied to the CWT coefficients. Then, filtering is made
during the fatigue algorithm computing. Three cases
have been investigated; the first one is an imagery fil-
tering issue, the second one is a 1D Butterworth filter
applied to each line of the 2D matrix C
a,b
and the last
one is a 2D wavelet filtering based on SWT. Filters are
0 50 100 150 200 250 300 350 400 450 500
−1
0
1
a.
Experimental M−wave
0 200 400 600 800 1000 1200 1400
−1
0
1
b.
Experimental M−wave extended
0 1000 2000 3000 4000 5000 6000 7000 8000
−1
0
1
c.
Experimental Artificial EMG
0 1000 2000 3000 4000 5000 6000 7000 8000
−1
0
1
d.
Experimental Artificial EMG with exponential decreasing
Figure 4: a. M wave from experiment b. M wave extended
in time with a factor from 1 to 3 c. artificial EMG signal
created with experimental extended M waves by juxtaposi-
tion d. loss in amplitude by an decreasing exponential to
give final artificial EMG signal.
0 50 100 150
0.4
0.5
0.6
0.7
0.8
0.9
1
N° M−wave
Scale Parameter (1/a)
Ideal results
found results
Figure 5: Results of fatigue detection by CWT with syn-
thetic EMG (gray + line) and ideal result (black line).
0 50 100 150
0.4
0.5
0.6
0.7
0.8
0.9
1
N° M−wave
Scale Parameter (1/a)
Ideal Results
Noisy Result
Pure Result
Figure 6: Application of the CWT fatigue index on an ex-
perimental based EMG signal. Dot line are the ideal results,
dash line are the results for the noisy EMG (the magnitude
of noise was 10 % of the V
EMG
maxima) and continuous
line for the EMG signal.
applied to the synthetic EMG signals. In order to have
a clear representation of filters efficiency, averages of
errors have been made by using eq. 3. Those errors
are listed in Table 1. For both Butterworth filters, the
errors are identical all the time, but the execution du-
ration is really longer for the 2D filtering because it is
applied to the CWT coefficients. Therefore, the num-
ber of point that need to be treated is much more im-
portant. The best filter for the synthetic EMG signals
is the imagery inspired one (a circular averaging fil-
ter) with a decrease from 6.69% of error for the noisy
signal to 2.48%.
The same test on the influence of noise has also
been performed for the others fatigue indexes from
the literature. As 2D filtering cannot be applied to
those signals because no CWT has been made, only
two filters have been performed; the 1D Butterworth
and the 1D SWT filter. The errors between the ideal
results and three signals (noisy synthetic EMG, fil-
tered with Butterworth and SWT) have been made
and those errors are shown in Table 2. The differ-
BIODEVICES 2012 - International Conference on Biomedical Electronics and Devices
56
ence of error between the results of a unfiltered signal
and a filtered signal is very significative. The error is
more significative for the SWT filtering. It is there-
fore necessary to choose a SWT filter rather than a
classic one because wavelet filter are more efficient
on a noisy EMG.
Tables 1 and 2 show that CWT fatigue indexes are
less noise dependant than the literature indexes with
or without denoising.
Table 1: Square-Mean Error for the CWT fatigue index (%).
Kind Experimental
Filtre Based Error
Without Noise 1.0395
With Noise 6.6945
Filter 1D Butterworth 2.6042
Filter 1D SWT 2.8618
Filter 2D Image 2.4826
Filter 2D Butterworth 2.6042
Filter 2D SWT 7.8229
Table 2: Square-Mean Error for Indices in Litera-
ture(%),PTP: peak to peak, RMS: root mean square, Fmean:
mean frequency and Fmed: median frequency.
Experimental Based EMG Signal
Fatigue Noisy Butterworth SWT
index Signal Filtered Filtered
PTP 34.29 5.36 3.37
RMS 68.61 12.67 3.62
Fmean 204.48 38.60 11.61
Fmed 173.18 23.90 3.82
6 VALIDATION
The CWT fatigue processing has been applied to
EMG signals obtained under experimental exercice
which has been made on the right biceps. The stim-
ulation pulses were biphasic and symetric and the
pulses duration was 1000 µs. The pulse train was
50 Hz and the injected current was 60 mA. The ar-
tifacts have been removed and the first M wave found
has been used as a reference M wave. The results of
CWT treatment are shown in Figure 7 for two dis-
tinct subjects. The indexes go toward more and more
weak values. The dilation of M waves becomes in-
creasingly important over the stimulation. As the ex-
pansion of the M waves is an indicator of fatigue, this
curve shows that the muscular fatigue increases dur-
ing ES. The fatigue indexes based on CWT are in-
deed an indicator of fatigue usable on EMG signals
during ES. On the bottom result (Fig 7), the fatigue
0 1 2 3 4 5 6 7 8 9
0.7
0.8
0.9
1
Scale Parameter (1/a)
0 1 2 3 4 5 6 7 8 9 10
0.7
0.8
0.9
1
Time (s)
Scale Parameter (1/a)
Figure 7: Results of the fatigue detection thanks to our
CWT treatment for two distinct subject. On the bottom plot,
we can see a plateau time at the beginning of the stimula-
tion.
indexes rest to its maximum level during beginning of
the stimulation, corresponding to a plateau state.
7 CONCLUSIONS
A presentation of a ES device with the analyze of fa-
tigue thanks to an EMG feedback and a CWT treat-
ment has been given. It has been shown that wavelets
can provide a reliable fatigue index by using the drift
of M wave elongation during a ES. A study of noise
sensitivity was made and showed that imaging filters
(a circular averaging filter) apply rather well to CWT
fatigue indexes. It would be interesting to confirmed
these primilary results on an increased number of sub-
jects and muscles. Subjects may be healthy or with a
disease in order to compare the variation of indexes
between them.
REFERENCES
Chesler, N. and Durfee, W. (1997). Surface EMG as a fa-
tigue indicator during FES-induced isometric muscle
contractions. Journal of Electromyography and Kine-
siology, 7(1):27–37.
Chilibeck, P., Bell, G., Jeon, J., Weiss, C., Murdoch, G.,
MacLean, I., Ryan, E., and Burnham, R. (1999).
Functional electrical stimulation exercise increases
GLUT-1 and GLUT-4 in paralyzed skeletal muscle 1.
Metabolism, 48(11):1409–1413.
Dolhem, R. (2008). Histoire de l’
´
electrostimulation en
m
´
edecine et en r
´
e
´
education. Annales de R
´
eadaptation
et de M
´
edecine Physique, 51(6):427–431.
Erika Scremin, A., Kurta, L., Gentili, A., Wiseman, B.,
Perell, K., Kunkel, C., and Scremin, O. (1999). In-
creasing muscle mass in spinal cord injured persons
with a functional electrical stimulation exercise pro-
gram 1. Archives of physical medicine and rehabilita-
tion, 80(12):1531–1536.
QUANTIFICATION OF MUSCLE FATIGUE WITH WAVELET ANALYSIS BASED ON EMG DURING
MYOELECTRICAL STIMULATION
57

Hunt, K. and Stone, A. (2004). Control strategies for inte-
gration of electric motor assist and functional electri-
cal stimulation in paraplegic cycling: utility for exer-
cise testing and mobile cycling. IEEE Transactions
on Neural Systems and Rehabilitation Engineering,
12(1):89–101.
Iwami, T., Sasaki, M., Miyawaki, K., Matsunaga, T., Shi-
mada, Y., and Obinata, G. (2009). Biomechani-
cal analysis for FES assisted swing-through gait. In
Micro-NanoMechatronics and Human Science, 2008.
MHS 2008. International Symposium on, pages 430–
434. IEEE.
Karu, Z., Durfee, W., and Barzilai, A. (2002). Reduc-
ing muscle fatigue in FES applications by stimulat-
ing with N-let pulse trains. IEEE Transactions on
Biomedical Engineering, 42(8):809–817.
Knaflitz, R. M. M. and Deluca, C. J. (1990). Myoelectric
manifestations of fatigue in voluntary and electrically
elicited contractions. the American Physiological So-
ciety 0161-7567/90.
Kumar, D., Pah, N., and Bradley, A. (2004). Wavelet analy-
sis of surface electromyography. IEEE Transactions
on Neural Systems and Rehabilitation Engineering,
11(4):400–406.
Matjai, Z., Hunt, K., Gollee, H., and Sinkjaer, T. (2003).
Control of posture with FES systems. Medical engi-
neering & physics, 25:51–62.
Mesin, L., Merletti, R., and Rainoldi, A. (2009). Surface
EMG: The issue of electrode location. Journal of
Electromyography and Kinesiology, 19(5):719–726.
Mizmhi, J. (1997). Fatigue in muscles activated by func-
tional electrical stimulation. Crit. Rev. Phys. Rehabil.
Med, 9(2):93–129.
Mizrahi, J., Levin, O., Aviram, A., Isakov, E., and Susak,
Z. (1997). Muscle fatigue in interrupted stimulation:
effect of partial recovery on force and EMG dynam-
ics. Journal of Electromyography and Kinesiology,
7(1):51–65.
Mizrahi, J., Levy, M., Ring, H., Isakov, E., and Liberson,
A. (2002). EMG as an indicator of fatigue in isomet-
rically FES-activated paralyzed muscles. IEEE Trans-
actions on Rehabilitation Engineering, 2:57–65.
O’Keeffe, D., Lyons, G., Donnelly, A., and Byrne, C.
(2001). Stimulus artifact removal using a software-
based two-stage peak detection algorithm. Journal of
neuroscience methods, 109(2):137–145.
Rutkove, S., Partida, R., Esper, G., Aaron, R., and Shiffman,
C. (2005). Electrode position and size in electrical
impedance myography. journal of the International
Federation of Clinical Neurophysiology, 116(2):290.
Sinkjaer, T., Haugland, M., Inmann, A., Hansen, M., and
Nielsen, K. (2003). Biopotentials as command and
feedback signals in functional electrical stimulation
systems. Medical engineering & physics, 25(1):29–
40.
Stein, R. and Mushahwar, V. (2005). Reanimating limbs
after injury or disease. Trends in neurosciences,
28(10):518–524.
Tepavac, D. and Schwirtlich, L. (1997). Detection and
prediction of FES-induced fatigue. Journal of Elec-
tromyography and Kinesiology, 7(1):39–50.
Thomas, C. (1997). Fatigue in human thenar muscles paral-
ysed by spinal cord injury. Journal of Electromyogra-
phy and Kinesiology, 7(1):15–26.
Velloso, J. and Souza, M. (2007). A Programmable System
of Functional Electrical Stimulation (FES). In Engi-
neering in Medicine and Biology Society, EMBS 2007,
pages 2234–2237. IEEE.
Vukova, T., Vydevska-Chichova, M., and Radicheva, N.
(2008). Fatigue-induced changes in muscle fiber ac-
tion potentials estimated by wavelet analysis. Journal
of electromyography and kinesiology, 18:397.
Watanabe, T., Miura, N., Hoshimiya, N., and Handa, Y.
(2000). The possibility of using m-waves related to
double pulses for evaluating muscle fatigue in fes con-
trol. Japanese Journal of Medical Electronics and Bi-
ological Engineering, 38(1):42–48.
Wu, H., Young, S., and Kuo, T. (2002). A versatile mul-
tichannel direct-synthesized electrical stimulator for
FES applications. IEEE Transactions on Instrumen-
tation and Measurement, 51(1):2–9.
Yeom, H. and Chang, Y. (2010). Autogenic EMG-
Controlled Functional Electrical Stimulation, for An-
kle Dorsiflexion Control. Journal of Neuroscience
Methods.
BIODEVICES 2012 - International Conference on Biomedical Electronics and Devices
58
