
BIOSIGNALS EVENTS DETECTION
A Morphological Signal-independent Approach
Rui Santos
1
, Joana Sousa
2
, Borja Sa
˜
nudo
3
, Carlos J. Marques
4,5
and Hugo Gamboa
1,2
1
Physics Department, FCT-UNL, Lisbon, Portugal
2
PLUX- Wireless Biosignals, S.A., Lisbon, Portugal
3
Department of Physical Education and Sport, University of Seville, Seville, Spain
4
Faculty of Human Kinetics at the Technical University of Lisbon, Lisbon, Portugal
5
Physical Therapy and Rehabilitation Department at the Sch ¨on Klinik Hamburg Eilbek, Hamburg, Germany
Keywords:
Biosignals, Signal-processing, Events, Detection and Identification, Signal-independent.
Abstract:
This study presents a signal-independent algorithm, which detects significant events in a biosignal, without
previous knowledge or specific pre-processing steps. From a morphological analysis, the algorithm computes
the instants when the most significant standard deviation discontinuities occur. An iterative optimization step
is then applied. This assures that a minimal error is achieved when modeling the signal segments (between
the detected instants) with a polynomial regression. The detection scale can be modified by an optional input
scale factor. An objective algorithm performance evaluation procedure was designed, and applied on two
types of synthetic signals, for which the events instants were previously known. An overall mean error of
20.32 (±16.01) samples between the detected and the real events show the high accuracy of the proposed
algorithm. The algorithm was also applied on accelerometry and electromyography raw signals collected in
different experimental scenarios. The fact that this approach does not require any previous knowledge and the
good level of accuracy represents a relevant contribution in events detection and biosignal analysis.
1 INTRODUCTION
Automated techniques for generating, acquiring and
storing data from scientific measurements have be-
come increasingly precise and powerful. However,
there is still a practical need to improve tools for sig-
nal pattern recognition and interpretation systems, in
which the detection of specific events and the auto-
matic signal segmentation must be one of the first pro-
cessing procedures (Ciaccio et al., 1993). An event
is broadly defined as the change in state of the sys-
tem under study (Ciaccio et al., 1993). Biosignals
are often characterized by oscillations at specific fre-
quencies and contaminated by in-band noise, which
is both periodic and random (Clifford, 2006). Identi-
fying the underlying biosignal and its specific events
among trivial changes can become extremely difficult.
The accurate onset determination of electromyo-
graphic (EMG) activity is an application of events
detection algorithms. A comparative study regarding
several methods for EMG signals onset detection, in-
cluding those proposed by Hodges (Hodges and Bui,
1996) and Bonato (Bonato et al., 1998), is reported by
Staude (Staude et al., 2001). Another possible appli-
cation is related to the detection of general transient
events. Abrupt changes or discontinuities encoun-
tered in biosignals may be symptomatic of functional
disorders (Sankur et al., 1996). The ability to detect
them has great importance to the medical prediction
process, as well as in sport and rehabilitation research
fields.
In the present work we’ve developed an algorithm
for biosignals events detection. Based on a morpho-
logical analysis, it is able to identify time domain
specific shape parameters that can clearly distinguish
those events from the complete observed signals. The
algorithm’s design follows a signal-independent ap-
proach, requiring also no prior information or pre-
processing steps, but allowing the user to control the
detail on the event detection by optionally changing a
specific scale factor.
The algorithm was applied on acceleration and
EMG digital raw signals. An objective performance
evaluation procedure was designed and applied on
synthetic signals, for which the events were known.
385
Santos R., Sousa J., Sañudo B., J. Marques C. and Gamboa H..
BIOSIGNALS EVENTS DETECTION - A Morphological Signal-independent Approach.
DOI: 10.5220/0003772403850388
In Proceedings of the International Conference on Bio-inspired Systems and Signal Processing (BIOSIGNALS-2012), pages 385-388
ISBN: 978-989-8425-89-8
Copyright
c
2012 SCITEPRESS (Science and Technology Publications, Lda.)

2 MATERIALS AND
ACQUISITION METHODS
2.1 Synthetic Signals
Synthetic signals were constructed by concatenating
sections with predefined mean and standard deviation
(STD) values (referenced as zones). The mean values
where given by float numbers randomly sampled from
a standard normal distribution and then multiplied by
a factor m. The STD values were obtained by multi-
plying a random number sampled from a uniform dis-
tribution, within the interval [0, 1] by a factor s. Be-
tween those zones transition events with known ran-
domly selected starting and ending points were also
considered. Minimal values for mean and STD dif-
ferences between successive zones were imposed and
assigned to the m d and sd d variables, respectively.
Two different types of synthetic signals were defined
according to the parameters in Table 1.
Table 1: Synthetic signals parameters.
Synthetic signal Type I Type II
m 8 0.05
s 0.1 1
m d 5 0.1
sd d 0.05 0.5
Number of events 10 5
2.2 Data Acquisition
The EMG and acceleration signals were acquired, re-
spectively, using surface bipolar EMG sensors (emg-
PLUX) and triaxial accelerometers (xyzPLUX), con-
nected to a bioPLUX research unit (PLUX, 2007).
Signals were sampled at frequency of 1000 Hz.
For acquiring acceleration signals drop jumps
from a 40 cm elevated platform to the ground level
were executed. The accelerometer was placed next
to the knee (at the tibial condyle level) and orien-
tated so its x axis was pointing upward. Only the
signal acquired from the z axis (the acceleration in the
Medial-Lateral axis) was considered. The testing pro-
tocol that was followed to obtain EMG signals aimed
at accessing the performance of an emergency brake
in a car simulator (Marques et al., 2011). From the
set of signals acquired in the context of that study we
consider the EMG records from the Tibialis anterior
muscle during the foot transition from the accelerator
to the brake pedal.
3 EVENTS DETECTION
ALGORITHM
3.1 Mathematical Formalism
For a given signal defined as a time series, x(t), with
t = 1, 2, ..., L, a set of regions is created by slicing the
signal. Considering E as the total number of events,
a general event slicing signal regions is denoted by
e
i
, i = 1, 2, ..., E. The complete modeled signal is ex-
pressed as defined in equation 1, for which further no-
tation is described below:
ˆx(t) =
E−1
∑
i=0
Q
t
e
i+1
− e
i
− e
i
M(t − e
i
, A
i
, ε) (1)
Q(t) is an unit pulse function expressed by:
Q(t) =
1 i f 0 ≤ t ≤ 1
0 otherwise
(2)
M(t, A, ε) is a polynomial regression model de-
fined by:
M(t, A, ε) = A(t) + ε (3)
where A is the matrix with n polynomial parameters
for a given signal region
A(t) = a
0
+a
1
t +.... +a
n
t
n
and ε is an error term that is assumed to follow a nor-
mal distribution
ε = N(µ, σ
2
)
with µ = 0. Increasing
the order of M makes the polynomial regression to
better model the signal, decreasing the Mean Squared
Error (MSE), but also renders this algorithm less sen-
sitive to abrupt changes within that signal.
After modeling the signal as described above,
each one of the E − 1 signal segments can be des-
cribed as:
ˆx
i
(t) = ˆx(t)|
t∈[e
i
,e
i+1
]
(4)
3.2 Implementation
3.2.1 Events Detection
The get_events algorithm is the base function to
identify the signal events (Figure 1). Beyond the sig-
nal, it can receive other parameters, by input, in order
to run auxiliary functions responsible for each of the
processing steps described below.
From a raw signal, the get_slices_std function
divides the signal into slices with a defined length
(slices length). This function returns an array con-
taining the sequence of the successive slice’s STD.
The STD sequence first derivative is then calculated
and low-pass filtered by applying a smoothing fil-
ter, in which the number of points considered into
the moving average window depends on the length
of the sequence multiplied by the smooth f actor
BIOSIGNALS 2012 - International Conference on Bio-inspired Systems and Signal Processing
386
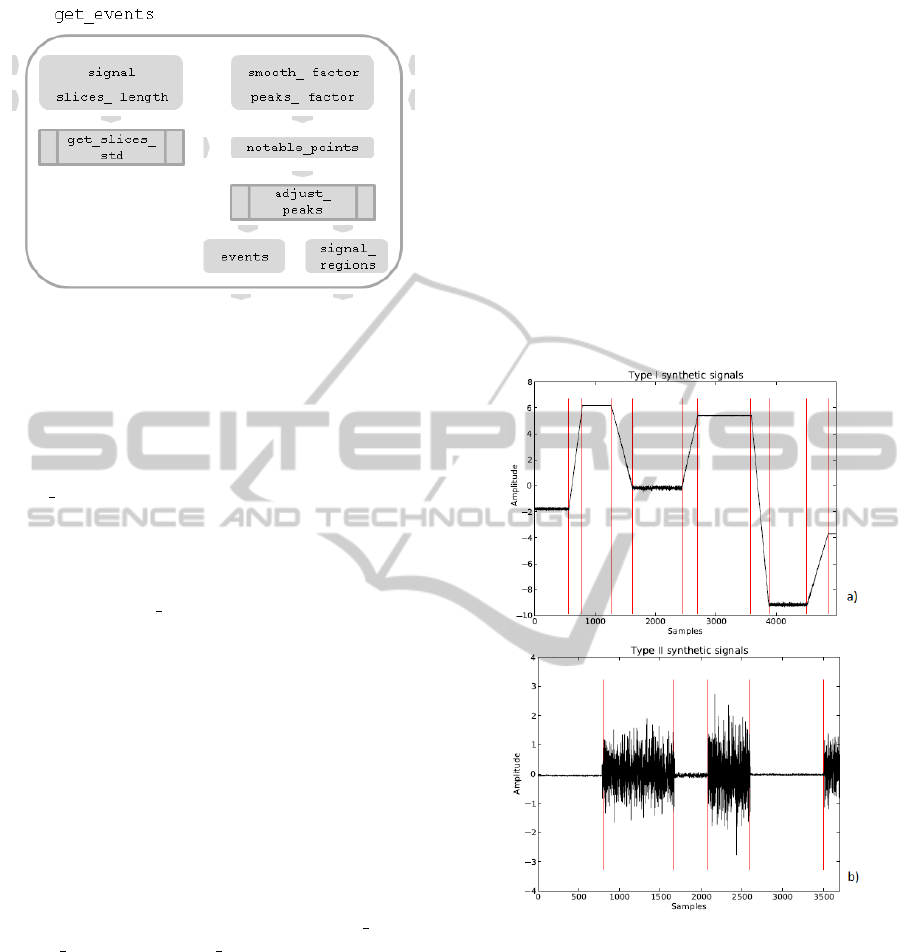
Figure 1: get_events algorithm flowchart diagram.
value (Figure 1). From the filtered sequence, the
signal notable points are computed from the lo-
cal maximums/minimums found above/below a spe-
cific threshold. The former is defined multiplying
the absolute sequence maximum/minimum by the
peaks f actor input parameter (Figure 1).
The adjust_peaks function is then applied. For
each peak this function considers the signal slice be-
ginning in each notable point and then applies the
get_slices_std function on that signal segment
(with a fixed slices length of 5 samples). If a maxi-
mum peak is considered, it is then replaced by the
point that maximizes the difference on the computed
STD sequence. For minimums the procedure is analo-
gous. This processing step ensures a more accurate
events detection, with a minimum error of 5 samples.
At the end, the get_events algorithm returns the de-
tected events and an array with the successive signal
regions between those events.
3.2.2 Optimization
The optimization processing step is based on
an iterative change into the input parameters
of the get_events algorithm (slices
length,
smooth f actor and peaks f actor). The respective
ranges depend on a scale factor, defined with base on
the signal’s length. It can alternatively be an input of
the optimization algorithm, allowing to increase or
decrease the level of detail (the number of detected
events). For each set of parameters the get_events
algorithm is applied. Either the solutions that have
the minimum total MSE, considering all the signal
segments ( ˆx
i
(t) in equation 4) modeled as 1st order
polynomials, or the maximum total standard devia-
tion differences between those segments are selected
in the same step. From those, the one for which
the number of events is maximal is selected as the
optimal solution.
4 RESULTS AND DISCUSSION
4.1 Algorithm Performance Evaluation
The developed algorithm was applied on a total of 25
Type I and 25 Type II synthetic signals, for which
examples of graphic representations, including marks
on the detected events, are given in Figure 2. The de-
fault scale factor was used. For each synthetic signal
the detection mean error was computed by evaluat-
ing the mean of the differences between the detected
events and the closer real event. An overall mean er-
ror of 20.32 (±16.01) samples show the high accuracy
of the proposed algorithm.
Figure 2: Synthetic signals results: a) Type I and b) Type II.
The detected events are represented as vertical red marks.
4.2 Application to Biosignals
The default mode algorithm application to knee ac-
celeration signals (Figure 3a) ) marks the drop jump
event by selecting mostly the landing phase record,
which is characterized for the greater instability and
amplitude within the signal. A more accurate de-
scription of the acceleration pattern is achieved with
a proper scale factor. The results presented in Figure
3b), with a scale factor of 0.02, allow to distinguish
the knee acceleration while preparing the jump from
the platform, the flying phase (with a slight and longer
BIOSIGNALS EVENTS DETECTION - A Morphological Signal-independent Approach
387
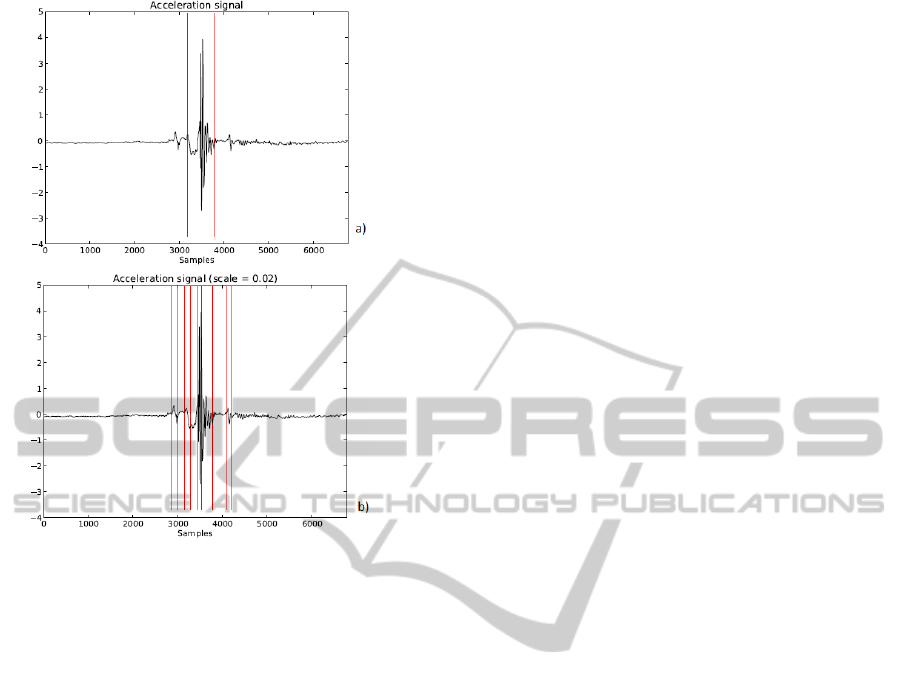
Figure 3: Acceleration signal results considering: a) default
scale factor and b) a scale factor of 0.02.
acceleration instability) and the landing phase, where
the instability increases significantly for a short time
period. The time spent recovering the knee stability
can also be estimated by accessing the posterior sig-
nal segments. When applied to EMG signals, the de-
fault mode events detection allowed a clear distinction
between activation and rest phases with an acute on-
set and offset detection. Being able to detect multiple
events and requiring no EMG specific pre-processing
steps, this algorithm presents advantages when com-
pared with the standard onset detection techniques
(Staude et al., 2001).
5 CONCLUSIONS AND FUTURE
WORK
The proposed algorithm performs an efficient events
detection within a signal. Its versatile design allows
the application in different signals, without previous
knowledge on their statistical characteristics and the
adjustment of a scale factor to achieve different detail
levels in specific applications. The added accuracy
and objectivity of this algorithm when compared with
the standard visual inspection also represents an ad-
vance in events detection from biosignals analysis.
In future work there is the intention of apply-
ing the algorithm to a wider range of biosignals and
evaluate its performance when compared with signal
specific processing techniques. Its integration into a
real-time processing tool is already under develop-
ment. Preliminary results point out the application’s
ability to detect the events in real-time, without a sig-
nificant loss of accuracy.
ACKNOWLEDGEMENTS
This work was partially supported by National
Strategic Reference Framework (NSRF-QREN) un-
der projects ”LUL” and ”Affective Mouse”, and Se-
venth Framework Programme (FP7) program under
project ICT4Depression, whose support the authors
gratefully acknowledge.
REFERENCES
Bonato, P., D’Alessio, T., and Knaflitz, M. (1998). A sta-
tistical method for the measurement of muscle activa-
tion intervals from surface myoelectric signal during
gait. Biomedical Engineering, IEEE Transactions on,
45(3):287–299.
Ciaccio, E., Dunn, S., and Akay, M. (1993). Biosignal
pattern recognition and interpretation systems. En-
gineering in Medicine and Biology Magazine, IEEE,
12(3):89–95.
Clifford, G. (2006). A novel framework for signal represen-
tation and source separation: Applications to filtering
and segmentation of biosignals. Journal of Biological
Systems, 14(2):169–184.
Hodges, P. and Bui, B. (1996). A comparison of
computer-based methods for the determination of
onset of muscle contraction using electromyogra-
phy. Electroencephalography and Clinical Neu-
rophysiology/Electromyography and Motor Control,
101(6):511–519.
Marques, C. J., Gamboa, H., Lampe, F., Barreiros, J., and
Cabri, J. (2011). Muscle activation thresholds before
and after total knee arthoplasty - protocol of a ran-
domized comparison of minimally invasive vs. stan-
dard approach. In Proceedings of the International
Conference on Bio-inspired Systems and Signal Pro-
cessing.
PLUX (2007). PLUX - Wireless Biosignals, S.A. [online]
Available at: http://plux.info/ [Accessed 5 September
2011].
Sankur, B., G
¨
uler, E. C., and Kahya, Y. (1996). Multireso-
lution biological transient extraction applied to respi-
ratory crackles. Computers in biology and medicine,
26(1):25–39.
Staude, G., Flachenecker, C., Daumer, M., and Wolf,
W. (2001). Onset detection in surface electromyo-
graphic signals: a systematic comparison of meth-
ods. EURASIP Journal on Applied Signal Processing,
2001(1):67–81.
BIOSIGNALS 2012 - International Conference on Bio-inspired Systems and Signal Processing
388
