
A NEW LASER DOPPLER FLOWMETER PROTOTYPE
FOR MICROCIRCULATION SKIN DEPTH MONITORING
In Vitro Validation and In Vivo Preliminar Results
Edite Figueiras
1
, Rita Campos
1
, Ricardo Oliveira
1
, Luís F. Requicha Ferreira
1
and Anne Humeau-Heurtier
2
1
Instrumentation Center (GEI-CI), Physics Department, Faculty of Sciences and Technology of Coimbra University,
Rua Larga, 3004-516, Coimbra, Portugal
2
Laboratoire d'Ingénierie des Systèmes Automatisés (LISA), Université d'Angers,
62 Avenue Notre Dame du Lac, 49000, Angers, France
Keywords: Laser Doppler flowmetry, Measurement depth, Skin microcirculation.
Abstract: A new laser Doppler flowmeter with depth discrimination capabilities is being developed to monitor skin
microvascular perfusion. This new laser Doppler flowmeter is a multi-wavelength device with different
spaced detection optical fibres. In order to obtain an in vitro validation of this prototype, measurements in
two phantoms, one consisting of Teflon
®
microtubes and the other consisting of acrylic plates, are
performed. The prototype validatation in vivo is also presented. Results obtained for both validations are
compared with the ones obtained with a commercial laser Doppler flowmeter. The measurements show
quite good agreements between both flowmeters.
1 INTRODUCTION
Laser Doppler flowmetry (LDF) is a technique for
real-time and non-invasive monitoring of the
microcirculation blood flow based on the Doppler
Effect. In this technique, a monochromatic light
beam is carried from the laser by an emitting optical
fiber to the tissues under study. In the tissues, the
light can be reflected, scattered, absorbed or
transmitted. When photons hit moving red blood
cells (RBCs) a change in wavelength occurs
(Doppler shift), while photons that hit static objects
have an unchanged wavelength. The magnitude and
frequency distribution of these changes in
wavelength are directly related to the number and
velocity of the RBCs in the sampled volume. The
backscattered Doppler shifted and non-Doppler
shifted photons are detected and they will produce a
stochastic photocurrent in the photodetector. This
photocurrent contains information on velocity and
concentration of RBCs (Bonner and Nossal, 1981).
LDF can be used for skin microcirculation
monitoring. Skin microcirculation is present in the
dermis, and it is organized into two horizontal
plexuses: the most superficial is situated in the
papillary dermis at 0.4 - 0.5 mm below the skin
surface; the second plexus is located at the dermal
subcutaneous interface at 1.9 mm from the skin
surface where arteriovenous anastomoses can be
found (Brevarman, 2000).
Currently, LDF human skin measurements lack
in estimating the sampling depth. These difficulties
lead to ambiguities in the discrimination of the
fraction of light scattered from superficial and
deeper blood microcirculation skin layers (Oliveira
et al., 2011). Besides this, commercial available
flowmeters use different signal processing
algorithms and calibration procedures making
impossible the comparison of their results.
The most commonly used laser wavelength in
LDF monitors is 780 nm and the most used fibre
separation is 0.25 mm. Some studies proposed the
use of other wavelengths and fibre separations in
order to modify the sampling depth of the LDF
technique (see for example Larsson et al., 2002;
Murray et al., 2004). However, further work is
required to have better knowledge and control over
the mean sampling depth (and hence volume) in skin
tissue.
154
Figueiras E., Campos R., Oliveira R., F. Requicha Ferreira L. and Humeau-Heurtier A..
A NEW LASER DOPPLER FLOWMETER PROTOTYPE FOR MICROCIRCULATION SKIN DEPTH MONITORING - In Vitro Validation and In Vivo
Preliminar Results.
DOI: 10.5220/0003765401540159
In Proceedings of the International Conference on Biomedical Electronics and Devices (BIODEVICES-2012), pages 154-159
ISBN: 978-989-8425-91-1
Copyright
c
2012 SCITEPRESS (Science and Technology Publications, Lda.)
Besides that, only few papers reported the
influence of the fibre distance and wavelength in
vivo, and simultaneously (Gush et al., 1984;
Freccero et al., 2006). Gush et al. (1984) used
wavelengths in the visible spectrum where the light
penetration is very influenced by the tissue optical
properties. Very large fibre distances were used, and
were recorded separately as the probe used has only
one collecting fibre, that was placed at a certain
distance from the emitting fibre before each
acquisition. In Freccero et al. (2006) different
flowmeter apparatus are compared. When different
devices are compared, there are instrumental factors
whose effects cannot be precisely judged (Freccero
et al., 2006).
We present herein a new Doppler flowmeter
prototype that can bring depth discrimination
information to the skin blood perfusion
measurements. Validation tests are performed in
vitro and in vivo and the preliminary results are
compared with the ones obtained with a commercial
laser Doppler flowmeter (Periflux 5000, Perimed,
Sweden).
2 MATERIALS AND METHODS
2.1 Prototype
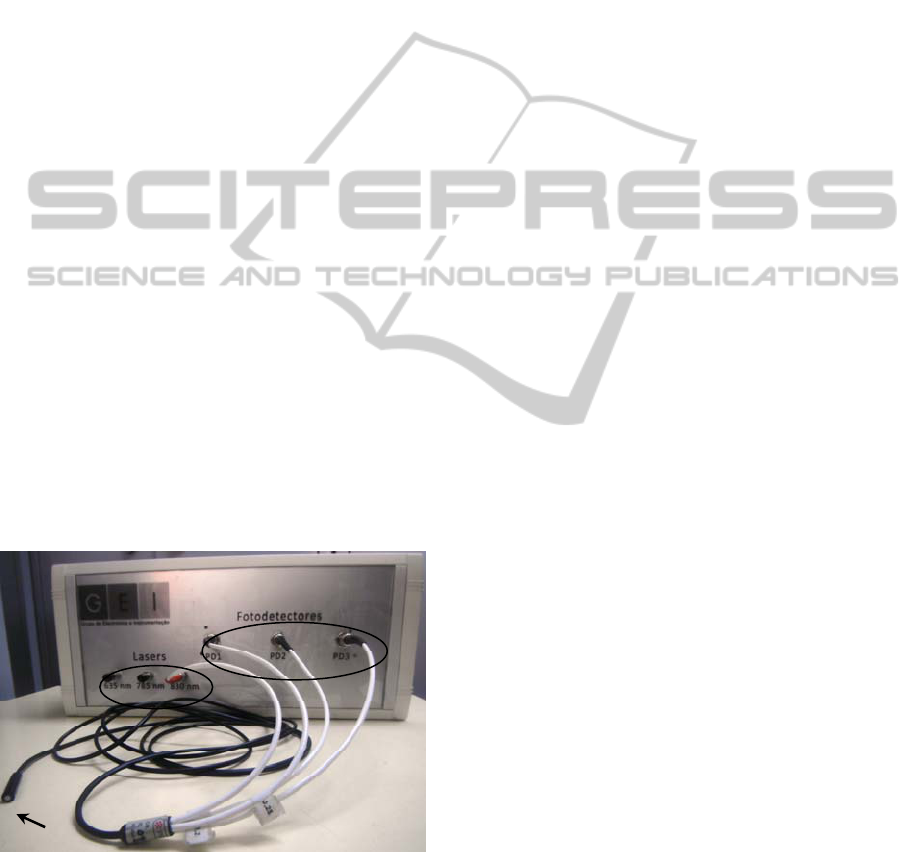
A new prototype with depth discrimination
capabilities is being built in order to discriminate
between different microcirculation skin layers (see
figure 1).
Figure 1: Laser Doppler flowmeter prototype.
The system has three constant power laser diodes
drivers to supply three laser diodes of 635, 785 and
830 nm wavelength. The probe used [from Perimed
(Sweden)] has a central emitting fibre and several
collecting fibres located at 0.14, 0.25 and 1.2 mm
from the emitting fibre. Three bi-cell photodetectors
(PD 1, PD 2 and PD 3) are used for backscattered
light detection (Oliveira et al., 2011). The prototype
has also a calibration system which provides the
light intensity for the photodetectors calibration.
This calibration system consists of three light
emitting diodes (LEDs), with the three wavelengths
used, with variable current sources (Oliveira et al.,
2011).
2.2 Measured Variables
The conventional parameters obtained from laser
Doppler technique are blood perfusion (Perf) and
concentration of moving red blood cells (CMBC).
Perf and CMBC can be estimated from the
Doppler power spectrum (Bonner and Nossal, 1981).
The CMBC is proportional to the zero order moment
of the power spectrum P(ω) of the AC component of
the light:
∫
∝ dwwPCMBC )( (1)
and Perf is calculated as the first order moment of
the power spectrum of the AC component of the
light:
∫
∝ )(wwPPerf d(ω) (2)
In our work, the voltage signal is sampled at
50 kHz and the digitalised signal is then processed to
give as an output a parameter proportional to the
average Perf.
2.3 Calibration and Normalization
The calibration is performed through two steps.
First, a LED illuminates the photodetector surface
with a number of selected DC intensity levels. The
intensity is regulated by software, where the DC
level of the photodetectors is used as feedback in
order to produce a stepwise, linearly increasing
intensity function (Oliveira et al., 2011). A block of
2048 points is acquired in each DC step and the Perf
is computed for each step. The blood perfusion
obtained during the DC steps is fitted to a first order
polynomial, called the detector noise curve:
bDCmPerf
noise
+×= (3)
where m is the slope of the curve, b is the y-axis
value and DC is the DC voltage value. This curve is
subtracted to the blood perfusion measurements.
For the second step, the perfusion in a motility
standard solution (Perimed, Sweden) is scaled with a
constant, M, in order to obtain 250 PU.
In order to make the perfusion independent of the
total light intensity at the detector surface, it is
Photodetectors
Laser Diodes
Probe tip
A NEW LASER DOPPLER FLOWMETER PROTOTYPE FOR MICROCIRCULATION SKIN DEPTH MONITORING
- In Vitro Validation and In Vivo Preliminar Results
155
normalized with the factor 1/DC
2
. The normalized
perfusion formula can then be expressed as:
()
noise
PerfPerf
DC
M
Perfusion −=
2
(4)
2.4 In vitro Validation
In vitro validation was performed in order to
evaluate the performance of the prototype to
different scatterer concentrations and velocities.
For in vitro validation two phantoms have been
used. One possesses six layers of Teflon
®
microtubes with internal diameter of 0.30 mm and
an external diameter of 0.76 mm. The other phantom
consists of two glued acrylic plates with a 4×5 mm
2
excavated depression in one of them, used to study
the linearity of the prototype related to different
scatterer velocities and concentrations. Milk was
pumped through the microtube, in the Teflon
®
phantom, or through the depression in the acrylic
phantom. Commercial skimmed milk has been
chosen as a moving fluid, because it has various
components that act as scatterers (Waterworth et al.,
1995).
The milk was pumped with a motorized syringe
at 1.56, 3.12, 4.68, 6.25, 7.78 and 9.35 mm/s in the
Teflon® phantom and at 0, 0.5, 1.0, 1.5, 2.0, 2.5,
3.0, 3.5, 4.0, 4.5, 5.0, 5.5 and 6.0 mm/s in the acrylic
phantom. Measurements were taken with milk, and
with two different aqueous milk solutions (50% and
25%) during ten minutes with Perimed probe
positioned perpendicular to the surface of the
phantom. The mean signal for each velocity and
concentration was computed for three minutes of
blood perfusion signal and a linear regression study
was performed.
The same protocol was executed with the
commercial Periflux 5000 flowmeter, from Perimed,
and with the prototype in order to compare the two
flowmeters.
2.5 In vivo Validation
The prototype was also tested in vivo in healthy non-
smoking subjects. The subjects were asked to refrain
from drinking coffee during the measurements day.
Perfusion has been recorded during thirty three
minutes in the forearm with the subjects in the
supine position: baseline blood flux was recorded for
20 min. Then, an arterial occlusion test was
performed with a pressure cuff placed around the
upper limb, inflated for 3 min at 200 mmHg. The
cuff was then released to obtain a post-occlusive
hyperemia and the signal was recorded during
10 min after the release of the occlusion.
For each subject, the protocol was repeated using
the three laser diodes existing in the prototype: 635,
785 and 830 nm, and also for the commercial
flowmeter, Periflux 5000 from Perimed, with the
probe positioned in the same position during the four
measurements.
The Ethics Committees of the Centro Cirúrgico
de Coimbra (CCC) in Portugal, approved this study.
Informed consent was obtained from the subjects
before the recordings were made. The measurements
were made in 20 subjects and the preliminary results
are presented.
3 RESULTS AND DISCUSSION
3.1 Calibration
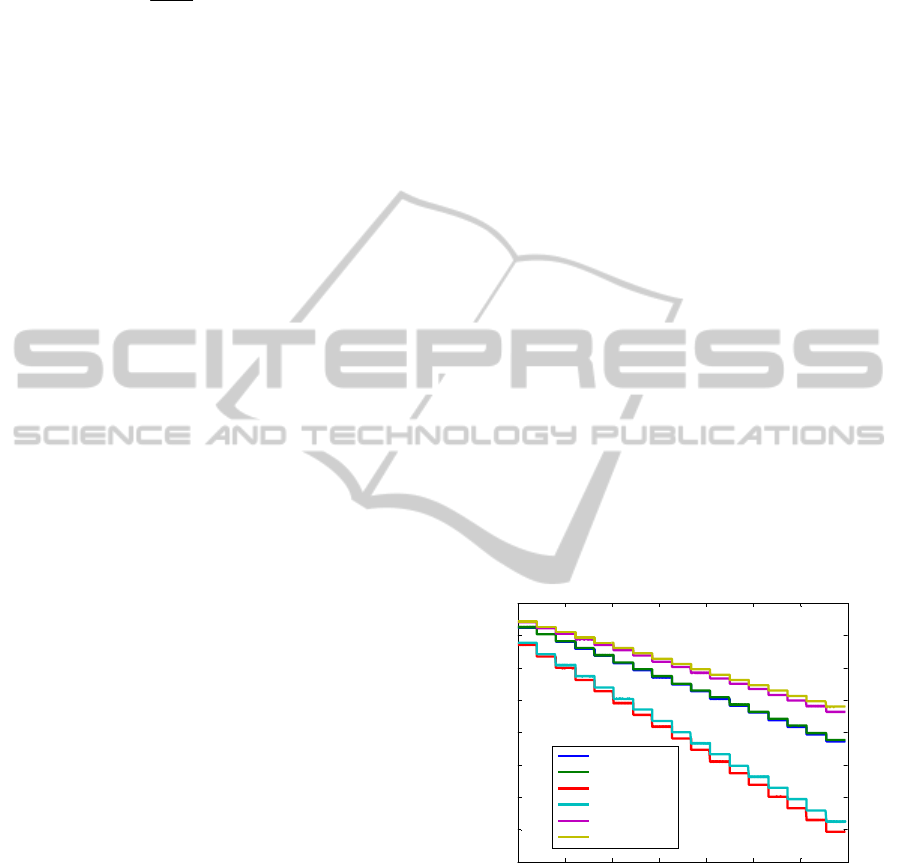
The steps obtained with our prototype during the
calibration with the 830 nm LED are shown in figure
2 where a pair of signals was obtained for each
photodetector (as the detection system is made by
bi-cell photodetetors). It can be seen that the
intensity level pairs diverge when the voltage
increases. This is due to the lack of alignment
between the photodetectors and the LEDs.
0 0.5 1 1.5 2 2.5 3 3.5
x 10
5
-8
-7
-6
-5
-4
-3
-2
-1
0
number of points
Voltage steps (V)
bi-cell PD 1 A1
bi-cell PD 1 A2
bi-cell PD 2 A1
bi-cell PD 2 A2
bi-cell PD 3 A1
bi-cell PD 3 A2
Figure 2: Photocurrent generated by the three bi-cell
photodetectors during calibration: PD 1 A1 and A2 are the
PD 1 signals, PD 2 A1 and A2 are the PD 2 signals, PD 3
A1 and A2 are the PD 3 signals.
The detector noise perfusion curve is presented
in figure 3. The slope of the curves are (-6.86, -6.67
and -6.73)x10
-5
for PD 1, PD 2 and PD 3,
respectively and the y-axes value are (0.157, 0.165
and 0.162)x10
-3
with a coefficent of determination,
R
2
, close to one.
BIODEVICES 2012 - International Conference on Biomedical Electronics and Devices
156
-7 -6 -5 -4 -3 -2 -1 0
2
3
4
5
6
7
8
x 10
-4
DC Voltage (V)
Perfusion (PU)
PD 1
PD 2
PD 3
Figure 3: Detector noise perfusion curves obtained for
each photodetector: PD 1, PD 2 and PD 3.
0 50 100 150 200 250 300 350
230
235
240
245
250
255
260
265
270
number of points
Perfusion (UP)
0.14 mm
0.25 mm
1.2 mm
Figure 4: Perfusion obtained in the motility standard with
the prototype for a 785 nm laser light for the three fibre
distances.
The perfusion obtained in the motility standard
solution after the calibration for the 785 nm laser
light is presented in figure 4 with a mean value of
250.6± 6.8, 250.5± 6.1 and 250.4± 6.0 for 0.14, 0.25
and 1.2 mm fibre distances, respectively. These
values are in the range of the ones obtained with the
Perimed flowmeter which can be 250±15.
3.2 In vitro Validation
3.2.1 Periflux 5000 - Teflon
®
Phantom
In the Teflon
®
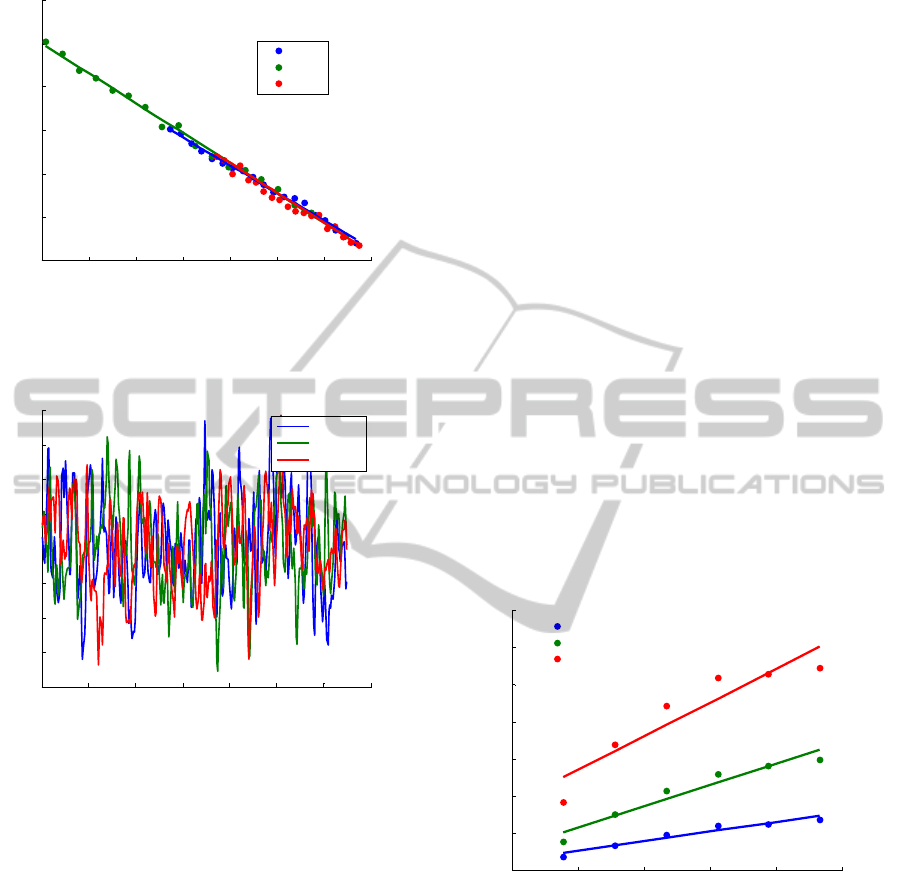
phantom, results obtained with
Periflux 5000 show that the perfusion increases with
the velocity and concentration of milk and with the
emitting-receiving fibre distance. Non-linearities
were found for 0.14 and 0.25 mm fibre separations.
The results obtained for all velocities and the three
emitting-receiving fibre distances at 25% milk
concentration are presented in figure 5. Perfusion
saturates for 6.25 mm/s in milk using the 1.2 mm
fibre separation. A good fitness between the linear
model and the obtained results was obtained in the
linear regression analysis: R
2
was always close to
one and the p-values were always smaller than 0.01,
except for results collected with 1.2 mm fibre
distance in milk. In this case it was only considered
three samples for the regression analysis (due to the
saturation mentioned above).
The saturation of the perfusion can be explained
by the fact that the Periflux 5000 flowmeter is for
perfusion measurements in living tissues and the
phantom does not perfectly mimic them.
Positioning the probe in the top of the microtube
Teflon
®
-based phantom was difficult due to the
microtube curvature. This, together with the small
milk volume in the microtube, when compared with
the tube volume, lead to the sub-estimation and
uncertainties of the perfusion measurements. These
factors could be the reason for the non-linearity
obtained. That is why an acrylic phantom was
developed 1) with a plain surface easing the contact
probe/phantom and 2) with a higher volume of milk.
0 2 4 6 8 10
0
100
200
300
400
500
600
700
Velocity (mm/s)
Perfusion
0.14 mm
0.25 mm
1.2 mm
Figure 5: Perfusion obtained in the Teflon
®
phantom with
the Periflux 5000 flowmeter (Perimed, Sweden) for all
velocities at 25% aqueous milk solution.
3.2.2 Prototype - Teflon
®
Phantom
Some drawbacks in the prototype results obtained in
the Teflon phantom were found, resulting from the
positioning difficulties of the probe in the top of the
microtube. These drawbacks are difficult to
overcome as real time signal processing is not yet
implemented in the prototype.
A NEW LASER DOPPLER FLOWMETER PROTOTYPE FOR MICROCIRCULATION SKIN DEPTH MONITORING
- In Vitro Validation and In Vivo Preliminar Results
157
3.2.3 Periflux 5000 - Acrylic Phantom
For the acrylic phantom, perfusion increases with
the velocity and with the concentration of the
moving fluid for each emitting-receiving fibre
distance. Moreover, we also noted that increasing
the emitting-receiving fibre distance leads to a larger
perfusion value. This is due to the larger volume
measured with larger emitting-receiving fibre
separations. For the 1.2 mm emitting-collecting fibre
distance, perfusion saturates for the higher
velocities. The statistical analysis showed good
correlation between the fitted model and the results
since R
2
was close to one and the p-value was lower
than 0.01. Therefore, we can conclude that the
relation between perfusion and velocity is linear, as
expected.
The perfusions obtained with the Periflux 5000
flowmeter in the acrylic phantom with 1.2 mm
emitting-fibre distance are shown in figure 6. It can
be seen that the perfusion saturates at 3.5, 4 and
4.5 mm/s for milk, 50 and 25% aqueous milk
solution, respectively.
0 1 2 3 4 5 6 7
100
200
300
400
500
600
700
800
900
1000
Velocity ( mm/s)
Perfusion
Milk
50% aqueous milk solution
25% aqueous milk solution
Figure 6: Perfusion obtained in the acrylic phantom with
the Periflux 5000 flowmeter (Perimed, Sweden) for all
velocities with the 1.2 mm emitting-receiving fibre
distance.
3.2.4 Prototype - Acrylic Phantom
In the acrylic phantom, results obtained with the
prototype show an increase of the perfusion with
milk velocity for all wavelengths of incoming light,
as it was expected. Moreover, perfusion also
increases with the emitting-receiving fibre distance.
Concerning the milk concentration, for the three
laser light wavelengths, the perfusion increases with
milk concentrations for each fibre distance and
velocity. To investigate if the relationship between
perfusion and milk velocity was linear, a linear
fitting was performed. R
2
values obtained were
higher than 0.94 and the p-values were always lower
than 0.01. Therefore, we can conclude that our
perfusion measurements are linearly proportional to
the velocity of the moving fluid.
Perfusion obtained in the acrylic phantom with
785 nm laser light for all velocities with the 1.2 mm
emitting-receiving fibre distance are shown in
figure 7.
0 0.5 1 1.5 2 2.5 3 3.5 4 4.5 5 5.5 6 6.5 7
0
200
400
600
800
1000
1200
Velocity (mm/s)
Perfusion
Milk
50% aqueous milk solution
25% aqueous milk solution
Figure 7: Perfusion obtained in the acrylic phantom with
the prototype for a 785 nm laser light for all velocities and
with the 1.2 mm emitting-receiving fibre distance.
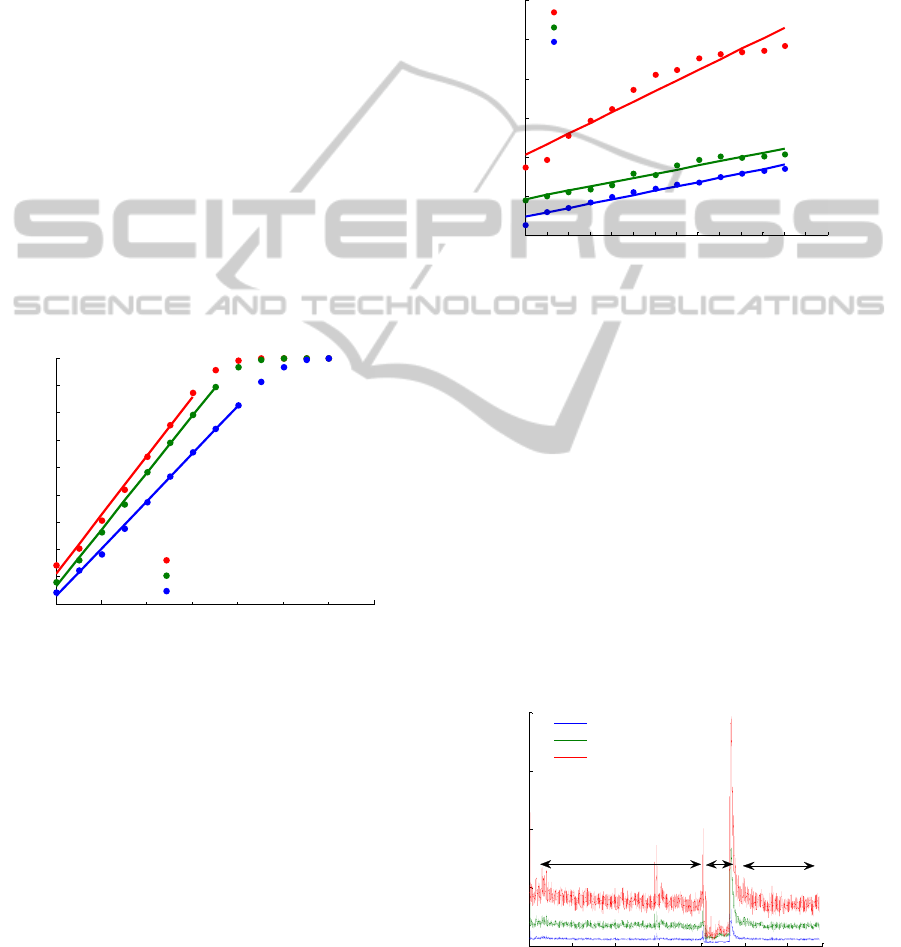
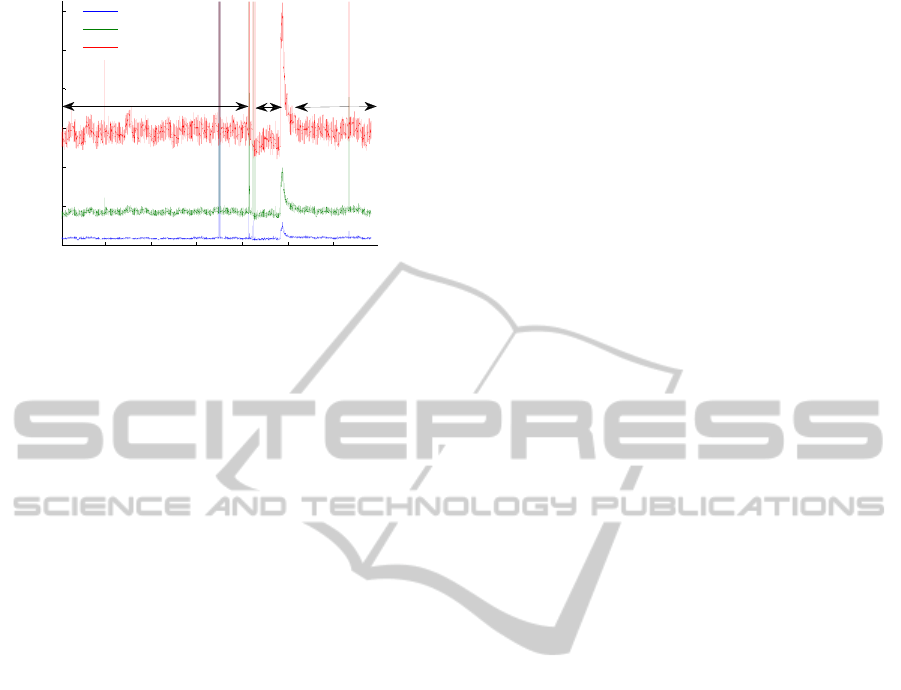
3.3 In vivo Validation – Preliminary
Results
The preliminary in vivo results are in accordance
with the literature and with the commercial
prototype results. The results obtained for one
subject using the 635 nm laser light of the prototype
and the commercial flowmeter are shown in figures
8 and 9. The baseline blood flux was recorded for 20
min (T1). During the occlusion, perfusion decreases
for any fibre distance (T2). After the occlusion
release the reactive hyperaemia peak, P, occurs and
then the signal returns to the baseline value (T3).
0 5 10 15 20 25 30 3434
0
50
100
150
200
Time (mi n)
Perfusion
0.14 mm
0.25 mm
1.2 mm
T2 T3
T1
p
Figure 8: Signal collected in the human forearm with the
non-invasive prototype with a 635 nm laser diode. The
results for the three fiber distances are shown.
BIODEVICES 2012 - International Conference on Biomedical Electronics and Devices
158
5 10 15 20 25 30
0
20
40
60
80
100
120
Time (mi n)
Perfusion
0.14 mm
0.25 mm
1.2 mm
T1
p
T3
T2
Figure 9: Signal collected in the human forearm with the
Periflux 5000 flowmeter (Perimed, Sweden). The results
for the three fiber distances are shown.
4 CONCLUSIONS
Calibration was performed with success despite the
lack of alignment between the LEDs and the PDs. In
general, there are good agreement between the in
vitro results of the Periflux 5000 flowmeter and our
prototype taken on the acrylic phantom. In both
systems Perf increases with the increasing of the
parameters under evaluation, i.e, velocity, milk
concentration and emitting-receiving fibre distance.
There is only a mismatch with the theoretical
expectations for the 635 nm laser diode when blood
perfusion of different milk solutions are compared
for the signals collected in the Teflon
®
phantom.
Furthermore, it was statistically proved that Perf is
linearly proportional to the velocity of the moving
fluid, as theoretical principles indicate. Moreover, in
vivo preliminary results obtained with the non-
invasive prototype are in accordance with the
literature and with the commercial flowmeter used.
ACKNOWLEDGEMENTS
The authors thank the “Instituto de Investigação
Interdisciplinar (III)” of the University of Coimbra,
“Acções Universitárias Integradas Luso–Francesas”
(PAUILF) programme and “Fundação para a
Ciência e a Tecnologia (FCT), Lisbon”, for
supporting this work.
REFERENCES
Bonner, R. F., Nossal, R. (1981). Model for laser Doppler
measurements of blood flow in tissue. Appl Opt; 20,
2097–2107.
Braverman, I. M.(2000). The Cutaneous Microcirculation.
J Invest Dermatol Symp Proc; 5, 3-9.
Freccero C., Wollmer P., Sundkvist G. and Svensson H.
(2006). The influence of wavelength and probe
configuration on findings of a skin vasoconstriction
test when using laser Doppler perfusion devices.
Microvascular Research; 71,64-67.
Fredriksson I., Larsson M. and Stromberg T. (2009).
Measurement depth and volume in laser Doppler
flowmetry. Microvascular Research; 78, 4-13.
Gush, R. J., King, T. A. and M. I. V. Jayson. (1984)
Aspects of laser light scattering from skin tissue with
application to laser Doppler blood flow measurement.
Phys.Med. Biol. 29;1463-1476.
Larsson M., Steenbergen W. and Strömberg T. (2002).
Influence of optical properties and fiber separations on
laser doppler flowmetry. J. Biomed.Opt; 7,236-243.
Murray A. K., Gorodkin R. E., Moore T. L., Gush R. J.,
Herrick A. L. and King T. A. (2004). Comparison of
red and green laser Doppler imaging of bloof flow.
Lasers in surgery and medicine; 35,191-200.
Oliveira, R., Semedo, S., Figueiras, E., Requicha Ferreira,
L. F., Humeau, A. (2011). Laser Doppler Flowmeters
for microcirculation measurements, 1st Portuguese
Meeting in Bioengineering - Bioengineering and
Medical Sciences - The Challenge of the XXI century,
Portuguese chapter of IEEE EMBS; Technical
University of (Portugal).
Waterworth, M. D., Tarte, B. J., Joblin, A. J., van Doorn,
T. and Niesler, H. E. (1995). Optical transmission
properties of homogenized milk used as a phantom
material in visible wavelength imaging. Australasian
Physical and Engineering Sciences in Medicine;18,
39-44.
A NEW LASER DOPPLER FLOWMETER PROTOTYPE FOR MICROCIRCULATION SKIN DEPTH MONITORING
- In Vitro Validation and In Vivo Preliminar Results
159
