DETECTING ‘YELLOW STAIN’ IN WOOD USING SPECTRAL
METHODS
Gerald McGunnigle
CTR AG, Villach, Austria
Keywords: Wood inspection.
Abstract: This paper deals with the detection of ‘yellow stain’ in wood samples using colour. We describe an
investigation into the spectral properties of the stain and use the findings to design a detection system. We
found that infected regions invariably differed from healthy regions in the 400nm to 450nm region of the
spectrum. We developed a system based on an economical RGB camera and an optimised light source. The
source consists of two narrow bands: one in the blue channel of the camera where the discriminative
information is held, and one in the red channel that acts as a normalisation factor to remove the effect of the
natural patterning of the wood. A simple classifier was used with the red and blue channels of the camera
and produced results that agreed with our client’s subjective judgement.
1 INTRODUCTION
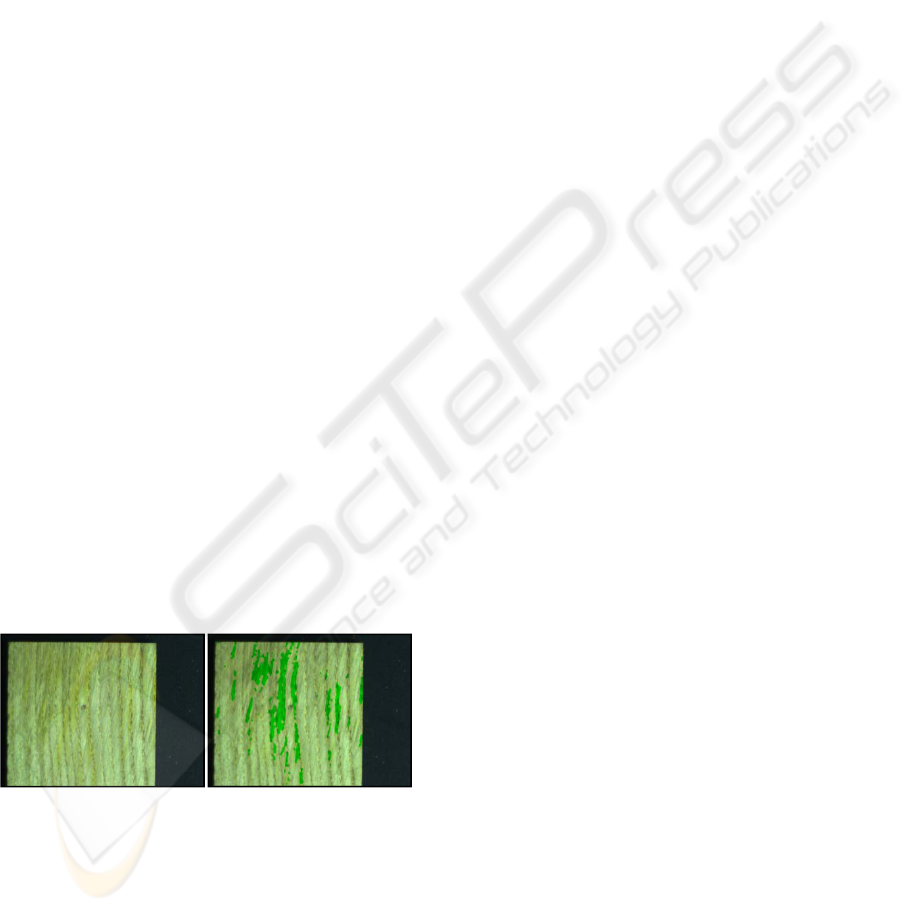
This paper deals with the detection of ‘yellow stain’
in wood samples using colour, Figure 1. Yellow
stain is a discolouration of the wood surface caused
by a fungal infection. Although it does not affect the
structural integrity of the timber, it does affect
consumer perceptions of the material and its
economic value. An inspection system must match
the human visual system’s colour sensitivity to the
stain, yet be robust to the natural variation of healthy
wood.
Figure 1: Example of yellow stained wood (left) the
results of our classifier (right). For display we have lit the
sample with fluorescent light which makes the yellow
stain more apparent than under tungsten halogen light.
Timber is an important sector of the machine
vision sector. Commercial systems are available and
the topic is also the subject of academic research.
Colour is an important aesthetic characteristic of
timber but also a useful cue for identifying
abnormalities and much of the research has
concentrated on using colour, (Lampinen,
Smolander and Korhonen, 1995) (Kauppinen and
Silven, 1996) (Lebow, Brunner, Maristany and
Butler, 1996). Spectroscopy has been applied, (Jones
et al., 2005) and several authors have used
multispectral and hyperspectral techniques,
(Maristany et al., 1992) (Hagman, 1997) (Marszalec
and Pietikaeninen, 1993) (Butler, Brunner and
Funck, 2001). In this paper we will use
hyperspectral imaging to identify the features that
disclose yellow stain and use this information to
optimise the spectrum of the illumination so that
yellow stain can be detected using a conventional
RGB camera.
In this paper we identify spectral features for
detecting yellow stain and resolving it from the
background wood texture. We use hyperspectral
(HS) measurements, that is measurements that are
both spatially and spectrally resolved, to identify
spectral features that distinguish infected from
clearwood. We then ‘tune’ the light source so that
these features can be resolved by a conventional
RGB Camera.
This paper describes 2 tasks: first we use the HS
measurement system to measure spectra from both
infected and clear regions of the samples. The
spectra are analysed to identify wavelengths at
which the two region types differ. These
wavelengths are then used to design features that can
551
McGunnigle G. (2012).
DETECTING ’YELLOW STAIN’ IN WOOD USING SPECTRAL METHODS.
In Proceedings of the 1st International Conference on Pattern Recognition Applications and Methods, pages 551-554
DOI: 10.5220/0003756205510554
Copyright
c
SciTePress

be extracted from the measured data and used for
classification. Second, we use a conventional RGB
camera with spectrally optimised lighting to classify
a series of samples.
We applied this approach to a number of samples
supplied by our client. Afterwards the client was
asked to examine the samples by hand and compare
his judgement with our classification. In all cases the
client agreed with the classification and was satisfied
with the approach. This evaluation is, like that of the
consumer, subjective. However, the fact that this
approach gave satisfactory results suggests that the
optimised lighting approach is superior to an earlier
approach based on a high end colour linescan
camera.
2 BACKGROUND
Yellow stain is a discolouration of cut hardwood
affecting European oaks, chestnut and walnut
species. The discolouration is the result of tannic
acids being metabolised by the fungus Paecilomyces
variotii. The initial infection and its progression are
closely associated with the vascular structure of the
wood. Fungal spores enter the structure of the wood
in regions where the vascular structure has been
breached, e.g. the wood has been cut across the
grain. The infection then spreads most rapidly along
the tracheids, especially through the less dense
earlywood. Because the spread of the infection is
largely determined by the microstructure of the
wood, the visible results are correlated with the grain
of the wood. Therefore although the stained regions
may extend over long distances in the grain
direction, they are often spatially localised in the
perpendicular direction. Colour measurements must
therefore be both spectrally accurate and spatially
localised.
Hyperspectral imaging allows measurement of
the colour spectrum at each pixel in an image. The
result of a hyperspectral measurement is a three
dimensional data set (or spectral cube) with two
spatial dimensions (as with a normal image) and a
third dimension corresponding to the colour
spectrum. In fact the particular camera, sensor and
lighting combination used in this report extends the
colour spectrum into the NIR and has a working
range from 380nm to 950nm. Our system is based
on an imaging spectrograph which diffracts light
along one of the axes of the sensor plane. Each
frame from the camera has one spatial and one
spectral axis. The spectrograph performs push-
broom scanning, i.e. it is used as a line scan camera,
with the spectral cube being built up slice by slice as
each frame is captured. Hyperspectral imaging has
been used for online inspection, however in this
paper we will use it as an analytical tool to optimise
a conventional inspection system.
3 HYPERSPECTRAL
MEASUREMENT SETUP
3.1 Lighting
The spectral range of the imaging system is defined
by the design of the imaging spectrograph, the
response of the camera, and the spectrum of the
incident illumination. In general we use tungsten
halogen lamps because they are broadband,
economical and are capable of supplying the large
amount of light required by a hyperspectral system.
They approximate a black body radiator and
therefore suffer from a significant disadvantage for
colour measurement: they are relatively weak at the
blue end of the spectrum.
It is critical that our hyperspectral measurement
system has sufficient signal in the blue. The X-Cite
source (Lumen Dynamics, Canada.) is largely
composed of a number of narrowband spectral peaks
and would normally not be considered for spectral
measurements Figure 2. However, by combining it
with the tungsten halogen source and reducing it to
12% of its maximum value, we can extend the
spectral range of the system further into the short
wavelengths without reducing the system’s dynamic
range.
3.2 HS Measurement Setup
The measurement uses a Jai CV M4 CL
monochrome camera, 10 bits, 1380 x 1030 pixels,
with a V10 (150µm slit) Imspector (Specim,
Finland) and a 25mm lens (Electrophysics, USA).
The sample is lit with two 500W tungsten halogen
lamps run from a dc power supply, and a metal
halide light source (Lumen Dynamics, Canada.). The
samples were scanned using a linear stage (National
Instruments, USA) with a longitudinal resolution of
300µm and a lateral resolution of 75µm. Between
300 and 500 frames were captured for each sample
giving raw data sets of between 1 and 2Gb. To
validate the system we imaged a series of colour
standards (Labsphere, USA). Our measurements
conform closely with the published reflectance
curves.
ICPRAM 2012 - International Conference on Pattern Recognition Applications and Methods
552
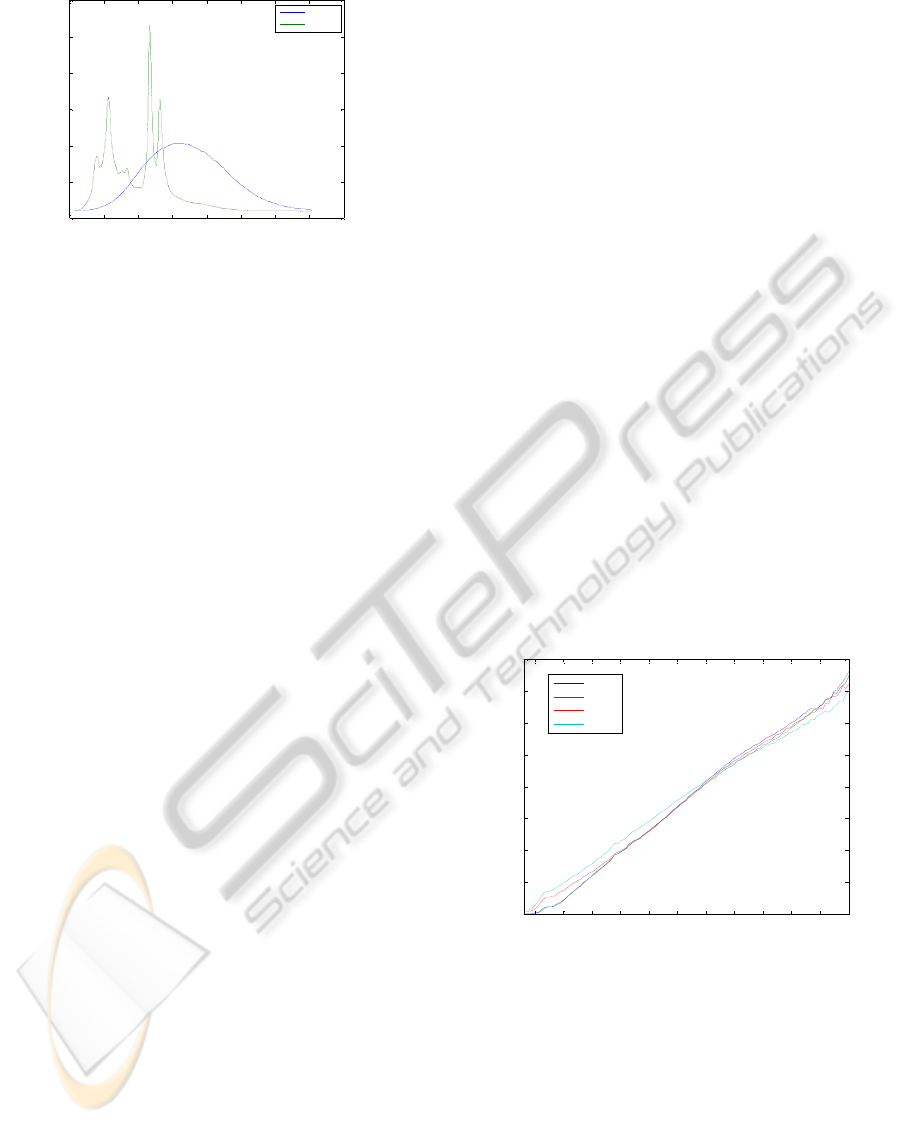
Figure 2: System response to white standard for tungsten
halogen and xCite light sources.
4 SPECTRAL MEASUREMENTS
4.1 Method
We measure the spectra of small regions
corresponding to both stained and clear wood. The
raw data is corrected for dark noise, as well as the
spatial and spectral inhomogenities of the light
source using the white and dark standards. The
spectrum is heavily oversampled (to a nominal
resolution of 1nm), we downsample this to the
resolution of the CIE standards (5nm). This
significantly reduces the memory requirements of
subsequent calculations. Next the RGB image is
calculated from the HS cube and displayed—the
user then crops the ROI from the image. The
corresponding spatial region is then cropped from
the HS cube and the cube is then normalised at each
pixel by the sum of the spectral intensities at that
pixel. An RGB image is then recalculated and
displayed with the blue channel accentuated. The
user then marks 4 small regions (5pix x 5pix) on the
image. The average spectrum of each region is then
plotted.
4.2 Results
Spectra for selected points on the test sample are
shown below. All the spectra have an almost exactly
linear relationship with wavelength, Figure 3. Most
of the yellow stain spectra are distinguished by
having lower energy in the 400-450nm range than
the clearwood spectra.
Aside from this feature, the spectra are devoid of
distinctive characteristics. This suggests that
techniques such as differentiating the spectra are not
worthwhile and features based on the intensity of the
spectrum at defined wavelengths may be the most
effective approach. This means that a multispectral
rather than hyperspectral system is appropriate for
this data set.
5 SHARPENED RGB
In the previous section it was shown that the 400nm-
450nm region of the spectrum is critical for
detecting yellow stain. We based our first feature on
light reflected from the wood surface after it has
been lit with a metal halide lamp filtered with a blue
glass filter. This feature is measured by the blue
channel of the RGB camera.
Wood is an inhomogeneous material and its
reflectivity varies from latewood to earlywood. An
inspection system must be able to detect yellow
stain, but ignore the intensity variations caused by
the normal structure of the wood. Our second feature
is used to normalise the response of the first feature.
Since we already use the blue channel of the camera,
we must use either the red or green channels for this
second feature. We opted for red to reduce crosstalk
with the blue channel. To obtain this feature the
sample is lit simultaneously by two sources: a
tungsten halogen source, filtered with a red
interference filter and a metal halide source filtered
by a blue filter.
Figure 3: Sample spectra.
A conventional RGB camera is used to image the
scene at a resolution of 640x480 pixels. The
classification algorithm is remarkably simple: a
feature is calculated from the red and green camera
channels and then thresholded to give a classified
image, Figure 4. The results are shown below in
Figure 5. We believe that these results are promising
— especially considering the simplicity of the
classifier.
300 400 500 600 700 800 900 1000 1100
0
2
4
6
8
10
12
x 10
5
Wavelength (nm)
Intensity
Halogen
xCite
400 450 500 550 600 650 700 750 800 850 900 950
0
0.002
0.004
0.006
0.008
0.01
0.012
0.014
0.016
Wavelength (nm)
Intensity
YS 1
YS 2
Clear 1
Clear 2
DETECTING 'YELLOW STAIN' IN WOOD USING SPECTRAL METHODS
553
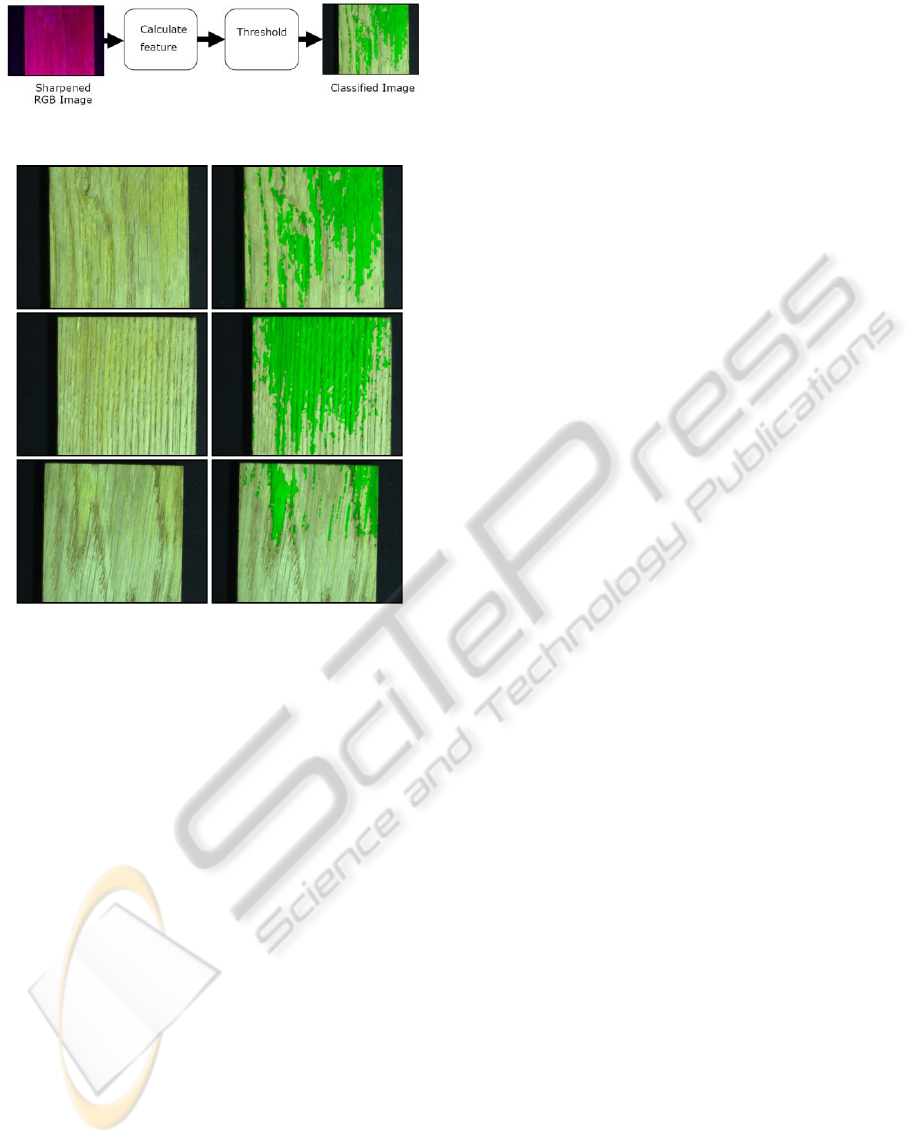
Figure 4: Sharpened RGB classifier.
Figure 5: Test samples (left) and classification results
(right).
6 CONCLUSIONS
This paper has shown that a colour based
classification of yellow-stain must be based on the
spectral band ranging from 400 to 450nm. We have
developed a lighting system that gives intense
illumination at these wavelengths — these
wavelengths corresponds to the blue channel of the
RGB camera. Wood is not a homogenous material,
and the reflectivity varies from early wood to
latewood. By using narrowband illumination
corresponding the camera’s red channel, we can
normalise the blue channel and obtain a stable
feature for detecting yellowstain. Using a simple
threshold classifier this approach was shown the
detect yellowstain effectively.
ACKNOWLEDGEMENTS
This project was supported within the COMET
Programme by BMVIT, BMWFJ and the federal
provinces of Carinthia and Styria.
REFERENCES
Lampinen, J., Smolander, S. and Korhonen, M., (1995),
Wood Surface Inspection System Based on Generic
Visual Features, Industrial Applications of Neural
Networks, pages 3542. World Scientic Pub. Co.
Kauppinen, H., Silven, O. (1996) The effect of
illumination variations on color-based wood defect
classification, Proceedings of the 13th International
Conference on Pattern Recognition, 25-29 Aug.
pp.828 - 832 vol.3. Vienna, Austria
Lebow, P., Brunner, C., Maristany, A., Butler, D. (1996),
Classification of Wood Surface Features by Spectral
Reflectance, Journal of Wood and Fiber Science,
Volume 28, Number 1 / January, pp.74-90
Jones, P., Schimleck, L., Peter, G., Daniels R., and Clark,
A. (2005) Non-destructive estimation of Pinus taeda L
tracheid morphological characteristics for samples
from a wide range of sites in Georgia, Wood Science
and Technology, Volume 39, Number 7, 529-545,
Maristany, A., Lebow, P., Brunner, C., Butler, D., and
Funck, J. (1992) Classifying wood-surface features
using dichromatic reflection, Proc. SPIE 1836, 56
(1993); Optics in Agriculture and Forestry, 16
November 1992, Boston, MA, USA
Hagman, O., Multivariate prediction of wood surface
features using an imaging spectrograph, (1997)
European Journal of Wood and Wood Products,
Volume 55, Number 6, 377-382,
Marszalec, E. and Pietikaeinen, M., Color analysis of
defects for automated visual inspection of pine wood,
(1993) Machine Vision Applications in Industrial
Inspection, San Jose, CA, USA
Butler, D., Brunner C. and Funck, J., Wood-Surface
Feature Classification Using Extended-Color
Information, (2001), European Journal of Wood and
Wood Products, Volume 59, Number 6, 475-482,
ICPRAM 2012 - International Conference on Pattern Recognition Applications and Methods
554
