
INVENTORY ALLOCATION FOR ONLINE GRAPHICAL DISPLAY
ADVERTISING USING MULTI-OBJECTIVE OPTIMIZATION
Jian Yang
1
, Erik Vee
1
, Sergei Vassilvitskii
1
, John Tomlin
1,3
Jayavel Shanmugasundaram
1,4
, Tasos Anastasakos
1
and Oliver Kennedy
2,5
1
Yahoo! Labs, 701 First Avenue, Sunnyvale, CA 94089, U.S.A.
2
Computer Science Department, Cornell University, Ithaca, NY 14840, U.S.A.
3
Currently at Marketshare LLC, Redwood Shores, CA, U.S.A.
4
Currently at Google, Mountain View, CA, U.S.A.
5
Currently at EPFL, Lausanne, Switzerland
Keywords:
Advertising, Inventory allocation, Multi-objective optimization.
Abstract:
We discuss a multi-objective/goal programming model for the allocation of inventory of graphical advertise-
ments. The model considers two types of campaigns: guaranteed delivery (GD), which are sold months in
advance, and non-guaranteed delivery (NGD), which are sold using real-time auctions. We investigate various
advertiser and publisher objectives such as (a) revenue from the sale of user visits, clicks and conversions,
(b) future revenue from the sale of NGD inventory, and (c) “fairness” of allocation. While the first two ob-
jectives are monetary, the third is not. This combination of demand types and objectives leads to potentially
many variations of our model, which we delineate and evaluate. Our experimental results, which are based on
optimization runs using real data sets, demonstrate the effectiveness and flexibility of the proposed model.
1 INTRODUCTION
Online graphical display advertising is a form of on-
line advertising where advertisers can explicitly or
implicitly target users visiting Web pages, and show
graphical (e.g., image, video) ads to those users. For
instance, a brokerage firm may wish to target Males
from California who visit a Finance web site in the
month of November 2011, and show an ad promoting
its special offers to those users. Similarly, a differ-
ent advertiser may wish to automatically target users
who visit a Finance web site, specifically those who
are likely to click on their ad highlighting a lower
mortgage rate. Online graphical display advertising
is a multi-billion dollar industry that is related to, but
distinct from, sponsored search advertising (Aggar-
wal et al., 2006), where advertisers bid for keywords
entered by users on a search page, and from content
match advertising (Broder et al., 2007), where adver-
tisers bid for clicks and text-matching techniques (as
opposed to user targeting) are used to show contextu-
ally relevant text advertisements on Web pages.
As with most forms of online advertising (Broder,
2008), one of the central questions that arises in the
context of online graphical display advertising is that
of inventory allocation, i.e., determining how to allo-
cate supply/inventory (user visits) to demand (adver-
tiser campaigns) so as to optimize for various pub-
lisher and advertiser objectives. However, even for-
mulating the inventory allocation problem for online
graphical display advertising is quite challenging, for
two reasons.
First, the same inventory can be sold in two differ-
ent forms: guaranteed delivery and non-guaranteed
delivery. In guaranteed delivery, an advertiser can
purchase a certain number of targeted user visits from
a publisher several months in advance, and the pub-
lisher guarantees these visits and incurs penalties if
the guarantees are not met. For instance, an adver-
tiser may wish to purchase 100 million user visits
by Males in California on a Sports web site during
the 2012 Olympics, and the Sports web site publisher
will guarantee these user visits even though the serv-
ing date is months away from the booking date. On
the other hand, in non-guaranteed delivery, advertis-
ers can bid in real-time in a spot market for user vis-
its, and the highest bidder obtains the right to show
an ad to the user. For instance, if a user visits a Fi-
nance web page, then there may be multiple advertis-
ers bidding for the ad slot on the page, and the highest
293
Yang J., Vee E., Vassilvitskii S., Tomlin J., Shanmugasundaram J., Anastasakos T. and Kennedy O..
INVENTORY ALLOCATION FOR ONLINE GRAPHICAL DISPLAY ADVERTISING USING MULTI-OBJECTIVE OPTIMIZATION.
DOI: 10.5220/0003752802930304
In Proceedings of the 1st International Conference on Operations Research and Enterprise Systems (ICORES-2012), pages 293-304
ISBN: 978-989-8425-97-3
Copyright
c
2012 SCITEPRESS (Science and Technology Publications, Lda.)

bidder can show an ad to the user. An interesting as-
pect is that the same user visits are eligible for both
guaranteed delivery and non-guaranteed delivery. A
typical use case is that some inventory not fully al-
located to guaranteed campaigns can be sold to non-
guaranteed campaigns. However, not all visits from
this inventory will fetch the same price in the spot-
market. This leads to the first question addressed by
this work: How does a publisher allocate inventory
to both guaranteed and non-guaranteed advertising
campaigns, while still ensuring that the guaranteed
advertiser objectives are met, and publisher revenue
is maximized?
Second, unlike sponsored search and content
match advertising, where the goals of advertisers are
to obtain clicks/ conversions on ads, the goals of ad-
vertisers in online graphical display can be quite var-
ied. At one end of the spectrum are brand advertisers
(e.g., major department stores), whose primary goal
is to reach a large and diverse audience and promote
their brand, rather than immediate clicks or purchases.
At the other end of the spectrum are performance ad-
vertisers (e.g., credit card companies), whose primary
goal is to obtain immediate online clicks and con-
versions. In the middle, there are performance-brand
advertisers (e.g., car companies), whose goal is both
to promote the brand, as well as to obtain immedi-
ate leads of users who are in the market to buy a car.
The varied goals of advertisers also lead to multiple
currencies by which graphical display advertisements
are bought: brand advertisers typically buy user visits
(expressed in CPM, or Cost Per Mille (1000 user vis-
its)), while performance advertisers typically pay per
click (CPC or Cost Per Click) or conversion (CPA, or
Cost Per Action), while brand-performance advertis-
ers may use a combination of CPM and CPC/CPA.
Thus, the second question we address is: How does
a publisher allocate inventory across diverse adver-
tisers and payment types so that advertiser and pub-
lisher objectives are met?
1.1 Contributions
Given the aforementioned unique requirements for
online graphical display advertising, one of the main
technical contributions of this paper is an inventory al-
location optimization model that can capture these re-
quirements. At a high-level, the proposed allocation
model represents forecasts of future inventory (user
visits) and guaranteed advertiser campaigns as nodes
in a bipartite graph. Each edge of the bipartite graph
connects a user visit to an eligible guaranteed adver-
tiser campaign. In addition, each user visit is anno-
tated with a forecast of the highest bid fetched on the
non-guaranteed marketplace and a forecast of the ex-
pected pay-out. Similarly, each edge of the graph is
annotated with a forecast of the click or conversion
probability for the advertiser campaign and the spe-
cific user visit.
Given the previous model, the objectives for on-
line graphical display advertising are captured as fol-
lows. There are two parts to the objective function:
one that captures guaranteed campaigns, and the other
that captures non-guaranteed campaigns. The ob-
jective for the latter is simply to maximize the rev-
enue for the publisher, since advertisers only bid for
what the user visit is worth to them. The objec-
tive for the guaranteed campaigns, on the other hand,
is more complex because advertisers could be inter-
ested in brand awareness, or performance, or both.
Furthermore, the publisher faces penalties for under-
delivering – that is displaying an advertisement to
fewer users than agreed on.
In our model, delivery guarantees are treated as
feasibility constraints. (If the instance is infeasible,
we trim the demand to find the feasible solution with
the minimum under-delivery penalties.) The objec-
tive for guaranteed contracts has two parts. The brand
awareness objective is captured in terms of “represen-
tativeness” (Ghosh et al., 2009), which tries to max-
imize the reach of the guaranteed campaign by uni-
formly distributing the contracts among the user visits
to the extent possible. The performance objectives for
guaranteed campaigns are captured as the expected
pay-out, i.e., the probability of clicks and conversions,
times the value of each click and conversion.
Consequently, the final allocation objective has
three parts: non-guaranteed revenue, guaranteed rep-
resentativeness, and guaranteed clicks/conversions.
While multi-objective programming has been a stan-
dard technique for some time, previous optimization
models for online advertising (see e.g. (Langheinrich
et al., 1999) and (Nakamura and Abe, 2005)) have
used a single objective function. One of our major
contributions is to use the multi-objective optimiza-
tion framework (Steuer, 1986) to model the some-
times conflicting objectives in a rigorous way.
While the multi-objective optimization model de-
scribed above captures the various objectives, it also
introduces a new set of challenges both in terms of
operability and in terms of computational feasibility.
Specifically, with regard to operability, the question
that arises is: how do we trade-off between the var-
ious objectives (such as representativeness and non-
guaranteed revenue), which do not even have the same
units? With regard to computational feasibility, the
question that arises is: how do we solve a multi-
objective formulation efficiently over large volumes
ICORES 2012 - 1st International Conference on Operations Research and Enterprise Systems
294

of data (tens of billions of user visits per day and hun-
dreds of thousands of advertiser campaigns per year)?
Another key technical contribution of this paper is a
method that enables operators of the system to trade-
off between multiple objectives based on the mone-
tary unit of a single objective. For instance, an op-
erator can trade-off representativeness in terms of the
impact it has on non-guaranteed revenue, which is ex-
pressed in monetary units. A significant advantage of
this method is that it also allows for an efficient so-
lution, which can be solved on a small sample of the
original bipartite graph, without significantly compro-
mising accuracy.
We have implemented the proposed inventory al-
location model and the solution techniques, motivated
by the context of an operational online graphical dis-
play advertising system. Our results using real user
visits, guaranteed campaigns, non-guaranteed bids,
and click/conversion data, indicate that the proposed
approach is both versatile in capturing and trading off
between various advertiser and publisher objectives,
as well as efficient to solve with high accuracy.
2 LITERATURE REVIEW
Operations Research techniques, and optimization in
particular, have been used for decades in planning ad-
vertising campaigns in other media, such as print, ra-
dio and television (Bollapragada et al., 2002). The
potential of the WWW for more targeted advertis-
ing was realized in the 1990’s and became a sub-
ject of research. A study was reported in (Langhein-
rich et al., 1999) where they attempted to target dis-
play ads to users in order to optimize expected rev-
enue, without using intrusive data gathering tech-
niques. While “unintrusiveness” seems to have be-
come less of a concern to advertisers and publishers,
their optimization approach was influential. Noting
a similarity between this problem and the traffic dis-
tribution model (Wilson, 1970), (Tomlin, 2000) sug-
gests adding an entropy term to the linear cost func-
tion proposed in (Langheinrich et al., 1999) to essen-
tially smooth the allocations and prevent “bang-bang”
solutions; characteristic of LP models. A good survey
of these and later developments is given in (Nakamura
and Abe, 2005).
Since that time, the development of Computa-
tional Advertising as a discipline has led to the con-
sideration of many variants of the graphical advertis-
ing allocation problem. A crucial development in this
process was the promulgation of the concept of “fair-
ness” in allocation (Ghosh et al., 2009) to offset ex-
treme LP solutions. (Yang and Tomlin, 2008) pro-
poses a multi-objective model for advertising inven-
tory allocation to balance the short-term objective of
revenue and long-term objective of “fairness”. This
model is further extended by (Yang, 2009) for unified
marketplace, where user visits can not only be sold
to, but also be purchased from, and by (Yang, 2010)
for malleable supply. (Feldman et al., 2009) consid-
ers the online ad allocation problem in the more gen-
eral setting of the matching problem, while (Roels
and Fridgeirsdottir, 2009) considers a dynamic ver-
sion assuming the inventory follows a Markov pro-
cess. (Easterly, 2009) and (Han, 2009) discuss on-
line advertising from a Revenue Management point
of view.
Two other modules in the online advertising sup-
ply chain make use of the results of an allocation
model such as we have described. These are Ad Serv-
ing and Admission Control. The Ad Server interprets
the output of the allocation model as a set of frequen-
cies with which specific ads should be shown to users
in the supply pools when they visit a web page. Con-
siderable practical advantages ensue when the solu-
tion can be stored in compact form and rapidly re-
constructed on the fly by the ad server when a page
requests ads. This process has been studied by (Deva-
nur and Hayes, 2009) and (Vee et al., 2009), using the
dual values associated with the demand constraints
and, implicitly, the graph structure to determine the
contracts for which a new arriving user visit is eligi-
ble. The optimization models we have studied pro-
vide the necessary dual values, but online ad serving
is not considered in this paper.
Admission Control is the process of determining
whether a proposed new guaranteed campaign should
be accepted, that is whether the existing obligations
can still be satisfied in a modified solution if the
new contract is accepted. Versions of this problem
have been studied by (Feige et al., 2008) and (Aleai
et al., 2009) and considered as an NP-hard combina-
torial optimization problem. (Radovanovic and Zeevi,
2009) have proposed a relaxed, more tractable, vari-
ant of the Admission Control process.
3 MODEL AND OBJECTIVES
We begin by first defining some notation, and then
motivating and formalizing the various objectives in
online graphical display advertising.
3.1 Supply and Demand Model
As mentioned earlier, the main goal of inventory al-
location is to match supply (user visits) and demand
INVENTORY ALLOCATION FOR ONLINE GRAPHICAL DISPLAY ADVERTISING USING MULTI-OBJECTIVE
OPTIMIZATION
295
(advertising campaigns). We thus begin by modeling
user visits, advertising campaigns, and their interac-
tion.
User visits can be represented as attribute-value
pairs, where the attributes represent the properties of
a user, the properties of the page they visit, as well
as the time stamp of the visit. An example user visit
could be represented as: Gender = Male, AgeGroup
= 30-40, Interests = {Sports, Finance}, Location =
California, ..., PageCategory = {Sports}, ..., Day = 27
Jul 2012, Time = 12:35pm GMT.
A display advertising campaign targets a subset of
user visits by specifying a targeting predicate. For
instance, an advertising campaign that targets Males
in California visiting Sports pages during the 2012
Olympics can be represented as: Gender ∈ {Male} ∧
Location ∈ {California} ∧ PageCategory ∈ {Sports}
∧ Duration ∈ [27 Jul 2012 - 12 Aug 2012]. A user
visit is said to be eligible for an advertising campaign
if the attribute-value pairs of the user visit satisfy the
targeting predicate of the advertising campaign. In the
rest of this paper, we will focus on just the eligibility
relationship between user visits and advertising cam-
paigns, and not on the specific attribute-value pairs or
the targeting predicates.
Advertising campaigns can be of two types: guar-
anteed campaigns, whereby the publisher guarantees
a fixed number of user visits to an advertiser in ad-
vance, and non-guaranteed campaigns, where adver-
tisers bid in real-time for user visits. Both guaranteed
and non-guaranteed campaigns can have one or more
advertiser goals: to obtain user visits (this is the only
goal that is guaranteed in a guaranteed campaign), to
obtain clicks, and/or to obtain conversions. In non-
guaranteed campaigns, however, these objectives are
converted into a bid by a bidding agent and thus, for
the purpose of modeling, they can be represented as
a bid for each user visit. Guaranteed campaigns, on
the other hand, need to be modeled in more detail.
Specifically, a guaranteed campaign has a user visit
goal (the guarantee), a penalty function that specifies
the penalty to be paid by the publisher if the guarantee
is not met, and a value for each click and/or conver-
sion. A key aspect that enables yield optimization for
clicks and/or conversions is the probability of a click
and/or conversion given a user visit.
Finally, for reasons of scale, it is usually not prac-
tical to work with all future user visits for a duration
of many months (many large publishers have billions
of user visits per day). Consequently, the inventory
allocation problem often has to be solved on a sam-
ple of user visits, and thus each sampled user visit is
annotated with a sample weight.
The following notation summarizes the above dis-
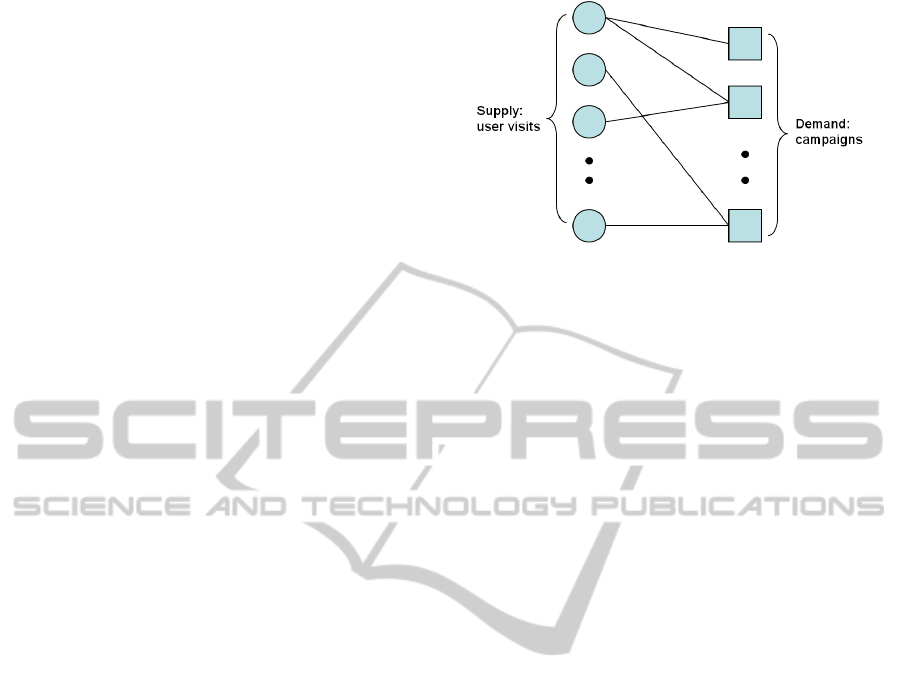
Figure 1: Example of allocation graph.
cussion:
• I : Set of user visits.
• s
i
: Sample weight of user visit i ∈ I .
• r
i
: The payout for user visit i ∈ I by non-
guaranteed campaigns.
• J : Set of guaranteed campaigns.
• d
j
: User visit goal for guaranteed campaign j ∈
J .
• P
j
: N → R: Penalty function for guaranteed
campaign j ∈ J , which maps under-delivery
(how much a guarantee is missed) to a penalty.
• W
c
j
: The value of a click for a guaranteed cam-
paign j ∈ J .
• W
a
j
: The value of a conversion (action) for a
guaranteed campaign j ∈ J .
• p
c
i j
: The probability that a user corresponding to
user visit i ∈ I clicks on an ad corresponding to
guaranteed campaign j ∈ J .
• p
a
i j
: The probability that a user corresponding to
user visit i ∈ I converts on an ad corresponding
to guaranteed campaign j ∈ J .
• B
j
: Subset of user visits I that are eligible for
guaranteed campaign j ∈ J .
It is often convenient to view the user visits and
guaranteed campaigns in a bipartite graph, with user
visits I on one side, guaranteed campaigns J on the
other. An edge (i, j) connects a user visit i and a guar-
anteed campaign j if i ∈ B
j
, that is if i satisfies the
targeting predicates of j. An example of such a graph
is shown in Figure 1.
It should be noted that the construction of this
graph, which may involve tens of thousands of nodes
and millions of edges, is in itself a major computa-
tional task.
3.2 Objectives
In this section, we motivate and formalize the various
objectives that are relevant to the inventory allocation
problem. In the next section, we introduce a mathe-
matical model to trade-off and optimize across these
different objectives.
ICORES 2012 - 1st International Conference on Operations Research and Enterprise Systems
296

An overriding objective of publishers is to min-
imize the penalties incurred in case guarantees are
not met. Minimizing penalties is important not only
because the publisher incurs an immediate mone-
tary loss, but also because the publisher could suffer
longer-term losses due to advertiser attrition. Define
y
i j
as the weight of user i ∈ I that is allocated to guar-
anteed campaign j ∈ J . Then the amount of user visits
delivered to a guaranteed campaign j is
∑
i
y
i j
, and the
objective of minimizing penalties can be formalized
as:
min
∑
j
P
j
(d
j
−
∑
i
y
i j
) (1)
In this paper, we always ensure feasibility before tak-
ing care of other objectives (see section 4.1).
At a high-level, there are two parts to the inventory
allocation problem, corresponding to non-guaranteed
and guaranteed campaigns. The objective for non-
guaranteed campaigns is simple: to maximize the rev-
enue for the publisher, since advertisers only bid what
each user visit is worth to them. Modeling the objec-
tives for guaranteed campaigns, on the other hand, is
more complex because advertisers could be interested
in brand awareness/reach or performance (clicks, con-
versions) or both. We thus have three objectives: non-
guaranteed revenue, brand awareness/reach, and per-
formance.
Before formalizing the above objectives, we intro-
duce some notation:
• z
i
= s
i
−
∑
j
y
i j
: The weight of user visit i ∈ I that
is allocated to non-guaranteed campaigns
• S
j
=
∑
i∈B
j
s
i
: The total amount of user visits el-
igible for guaranteed campaign j ∈ J
• θ
i j
= s
i
d
j
S
j
: The ideal fully representative target
allocation fraction of user visit i ∈ I to guaran-
teed campaign j ∈ J (motivated further below)
3.2.1 Non-guaranteed Revenue
The prices paid by non-guaranteed advertisers depend
heavily on the particular user. Therefore, a natural
goal of an allocation is to maximize the publisher’s
revenue by allocating the highest valued user visits
to the non-guaranteed contracts. Since the amount of
revenue that a publisher obtains from a user visit i is
r
i
z
i
, this objective is written as:
max
∑
i
r
i
z
i
(2)
3.2.2 Brand Awareness/Reach
There are two primary reasons why it is important to
have a brand awareness/reach objective. The first rea-
son is that brand advertisers typically want to reach
a large swath of their target audience. For instance,
a brand advertiser who targets user visits from the
US will likely be quite unhappy if all of their deliv-
ered user visits are from fourteen year old males in
Wyoming, and none from the rest of the population
(even though all the delivered user visits technically
satisfy the targeting predicate of the advertiser). In
other words, brand advertisers often want a represen-
tative subset of their target audience.
The second reason for having a brand awareness
and reach objective is more subtle, and it relates to the
interaction with non-guaranteed campaigns. Specifi-
cally, if the primary goal of the publisher was to max-
imize short-term revenue, then he could allocate all of
the high-value user visits to the highest bidding non-
guaranteed campaigns, and allocate only the remain-
ing user visits to the guaranteed campaigns. How-
ever, this is clearly detrimental to the advertiser, and
is also a dangerous road to take for the publisher: by
selectively allocating the most expensive user visits
to the non-guaranteed contracts, the publisher risks
alienating in the long term the guaranteed advertisers,
many of whom pay a large premium for guarantees.
In fact as (Ghosh et al., 2009) argued, in these situ-
ations price serves as a signal of value, thus the user
visits with the highest r
i
may also be the ones most
desired by the guaranteed contracts.
Therefore, it is in the long-term interests of pub-
lishers to allocate each guaranteed campaign a repre-
sentative subset of targeted user visits. Ideally, every
eligible user visit i ∈ B
j
should be equally likely to
see an ad from j. A similar argument holds on a tem-
poral scale. A week long contract should have the
same probability of being displayed on all days of the
week. That is, it should be allocated uniformly dur-
ing the course of the week—after all, if an advertiser
wanted the contract to be shown only on Tuesday, she
would have added that to the targeting constraints.
To model these representativeness constraints, let
θ
i j
be the ideal target allocation. Note that θ
i j
directly
encodes the fact that no user visit i is preferred by j
over others. To maximize long term revenue, the pub-
lisher should strive to find an allocation close to θ
i j
.
In this paper we use the L
2
-norm distance to measure
closeness to the target allocation. We denote V
j
the
importance of a representative allocation to advertiser
j and write the objective as:
min
∑
j
∑
i∈B
j
V
j
2θ
i j
(y
i j
− θ
i j
)
2
(3)
For consistency with other objectives, we will use
the maximization form:
max −
∑
j
∑
i∈B
j
V
j
2θ
i j
(y
i j
− θ
i j
)
2
(4)
INVENTORY ALLOCATION FOR ONLINE GRAPHICAL DISPLAY ADVERTISING USING MULTI-OBJECTIVE
OPTIMIZATION
297

Note that alternative forms such as an entropy
function or K-L divergence can also be used, as they
retain the essential features of separability (by adver-
tiser) and convexity. Similarly, other target alloca-
tions besides the perfectly uniform target allocation
can also be considered but these variants are beyond
the scope of this paper.
3.2.3 Clicks/Conversions
An advertiser in a guaranteed campaign may have
multiple objectives, such as clicks and conversions,
besides obtaining the guaranteed user visits. The pub-
lisher’s objective is to maximize the yield from such
goals, while also directing such clicks and conver-
sions to the advertisers who value them the most. This
can be modeled as trying to maximize the expected
value of clicks and conversions across all user visits:
∑
j
∑
i∈B
j
W
c
j
p
c
i j
y
i j
+W
a
j
p
a
i j
y
i j
For compactness we define:
w
i j
= W
c
j
p
c
i j
+W
a
j
p
a
i j
. (5)
Then we can rewrite the performance objective as:
max
∑
j
∑
i∈B
j
w
i j
y
i j
. (6)
Note that when we refer to “clicks” below, it is to
be understood to include the subsequent conversions.
4 SOLUTION APPROACHES
In the previous section we described the competing
objectives faced by a publisher in allocating user vis-
its to guaranteed contracts. In this section we for-
mally state the mathematical problem that incorpo-
rates these objectives subject to the feasibility con-
straints.
There are three types of constraints that the allo-
cation must satisfy to be feasible. First, the desired
number of user visits must be allocated for each guar-
anteed contract:
∀ j
∑
i∈B
j
y
i j
= d
j
(Demand Constraints)
Next, each user visit can be allocated to exactly one
guaranteed contract or the non-guaranteed market:
∀i
∑
j|i∈B
j
y
i j
+ z
i
= s
i
(Supply Constraints)
Finally, we must ensure that the allocation is always
non-negative:
∀i, j y
i j
≥ 0 (Non-Negativity Constraints)
∀i, z
i
≥ 0
Putting together the objectives from the previous
section with the set of constraints, we may state our
generic multi-objective optimization:
max
−
∑
j
∑
i∈B
j
V
j
2θ
i j
(y
i j
− θ
i j
)
2
∑
j
∑
i∈B
j
w
i j
y
i j
∑
i
r
i
z
i
(7)
subject to
∑
i∈B
j
y
i j
= d
j
∀ j (8)
∑
j|i∈B
j
y
i j
+ z
i
= s
i
∀i (9)
y
i j
≥ 0 ∀i, j (10)
z
i
≥ 0 ∀i (11)
Note that the non-negative variables z
i
transform
what would be inequality supply constraints into
equalities. Since z
i
is actually the leftover supply in-
ventory that will be sold to the non-guaranteed mar-
ket, the term
∑
i
r
i
z
i
can be viewed as the total non-
guaranteed revenue that can be obtained for an alloca-
tion y, with remnant inventory z. The second objective
is the revenue obtained from clicks on the displayed
advertisements.
4.1 Ensuring Feasibility
In this model formulation, guarantees are treated as
constraints (Demand Constraints). Consequently, be-
fore we optimize for the other objectives, we need to
ensure that the model is feasible, i.e., there is suf-
ficient supply for guaranteed campaigns. Note that
even if a publisher is careful to accept only guaran-
teed campaigns that are feasible at the time of book-
ing, the model could become infeasible at a later point
because forecasts of user visits could change due to
unforeseen events.
In order to make the model feasible, we add
dummy user visits that have unlimited supply but a
very high cost of being used, and connect them to all
the guaranteed campaigns. The cost associated with
using each dummy user visit for a guaranteed cam-
paign j corresponds to the penalty P
j
> 0 incurred
by that guaranteed campaign in case of under-delivery
(note that if P
j
has multiple penalty values for under-
delivery, then these can be represented as multiple
dummy user visits, each with a different cost of be-
ing used). The cost associated with using real user
visits is 0.
Given the above set up, the goal is to find the min-
imum cost allocation to guaranteed campaigns. Since
this problem is a pure network with a linear objective
function, it can be solved very efficiently (Bertsekas,
1998). If the cost of the optimal allocation is 0, then it
implies that all the guaranteed campaigns can be sat-
isfied, and hence that the original model is feasible.
ICORES 2012 - 1st International Conference on Operations Research and Enterprise Systems
298

If the cost of the optimal allocation is greater than 0,
then it implies that some guaranteed campaigns will
under-deliver. Furthermore, the optimal allocation to
the dummy user visits will indicate how much each
guaranteed campaign needs to under-deliver so that
overall penalty cost is minimized. In this case, the
user visit goal d
j
for each guaranteed campaign is re-
duced by the amount of allocation to the dummy user
visits in order to make the model feasible. We then
follow one of the procedures described in the remain-
der of this section.
4.2 Multi-objective Programming
We may approach a multi-objective function model
in a number of ways (Steuer, 1986). One general ap-
proach is to obtain an efficient frontier of solutions
where at each point on the curve the value of one ob-
jective can only be improved at the expense of degrad-
ing another. Figure 3 shows an example of efficient
frontier in the space of two objectives. The user may
then choose any point on this curve as the “solution”.
More algebraic approaches include using a
weighted sum of the multiple objectives and/or us-
ing “goal programming”, whereby the objectives are
handled sequentially, with the additional constraint(s)
that previous objectives retain a certain fraction of
their optimal value. Since we have three objectives,
there are clearly several variations, which we explore
below.
In what follows, it will be convenient to define the
three objective components as follows:
F
1
(y) = −
∑
j
∑
i∈B
j
V
j
2θ
i j
(y
i j
− θ
i j
)
2
(12)
F
2
(y) =
∑
j
∑
i∈B
j
w
i j
y
i j
(13)
F
3
(z) =
∑
i
r
i
z
i
(14)
Depending on the data available, we may formu-
late solution strategies which employ: 1) a single-
stage optimization model, 2) a two-stage optimization
model in various flavors and 3) a three-stage optimiza-
tion model, also in several flavors.
4.3 Single-stage Programming
We consider a multi-component objective function:
max
{
γF
1
(y) +ξF
2
(y) +F
3
(z)
}
(15)
subject to (8)-(11). The parameter γ ≥ 0 is the weight
for the “representativeness” component. The param-
eter ξ, in conjunction with the w
i j
, reflects the means
by which we attribute value to clicks. We observe that
a feature of this model is that the shadow value β
i
of
the supply constraint i is always no less than the pay-
out for user visit i by non-guaranteed campaigns, i.e.
β
i
≥ r
i
.
The model involves the addition of a linear term in
y to the strictly convex distance function F
1
(y). The
objective thus remains strictly convex quadratic in y
and linear in z. Optimization of this model is straight-
forward in principle, using a commercial solver such
as XpressMP (FICO, 2010). If a sufficiently power-
ful large-scale nonlinear network code were available,
this could also be used since our constraints are of the
pure network type.
4.4 Two-stage Programming
If all of the above data are not available to us, we must
resort to multi-objective or goal programming. Let us
first assume that γ is not known, but the click-related
data (ξ, w
i j
) are available. In this case, we may ini-
tially solve:
max
{
ξF
2
(y) +F
3
(z)
}
(16)
subject to (8)-(11). Note that this is a linear pure
network minimum cost flow problem which can be
solved very rapidly by special purpose software (e.g.,
see (Bertsekas, 1998)). Let the optimal value of this
linear program (LP) be M
∗
. We may now append a
constraint specifying that at least a certain fraction
ψ(0 < ψ < 1) of this monetary value be preserved
and solve the model:
max F
1
(y) (17)
subject to (8)-(11) and
ξ
∑
j
∑
i∈B
j
w
i j
y
i j
+
∑
i
r
i
z
i
≥ ψM
∗
(18)
It may be shown that the unknown parameter γ is
equal to the inverse of the dual value for the constraint
(18).
Suppose now that a value for γ is available but ξ is
not. We may initially solve
max F
2
(y) (19)
subject to (8)-(11). Let the optimal value of this linear
program (LP) be P
∗
. We may now append a constraint
specifying that at least a certain fraction ω(0 < ω <
1) of this “click value” (however it is quantified) be
preserved, and solve the model:
max
{
γF
1
(y) +F
3
(z)
}
(20)
subject to (8)-(11) and
∑
j
∑
i∈B
j
w
i j
y
i j
≥ ωP
∗
(21)
INVENTORY ALLOCATION FOR ONLINE GRAPHICAL DISPLAY ADVERTISING USING MULTI-OBJECTIVE
OPTIMIZATION
299

The third variant combines the two objectives F
1
and F
2
in the second stage model, after solving a first
stage model:
max F
3
(y) (22)
subject to (8)-(11). Let the optimal value of this linear
program be R
∗
. In this approach, the second model is
of the form:
max
{
γF
1
(y) +ξF
2
(y)
}
subject to (8)-(11) and
∑
i
r
i
z
i
≥ ηR
∗
(23)
where η(0 < η < 1) is the fraction of non-guaranteed
revenue we wish to preserve. This model would re-
quire us to have the relative weights on F
1
and F
2
available. This model is also guaranteed to be feasible
if the original constraints (8)-(11) are feasible.
4.5 Three-stage Optimization
From an operability point of view, it is unlikely that
both the parameters γ and ξ would be known, or
even understood very well. In that case, we cannot
avoid turning to goal programming and more intuitive
“knobs” for the business to use in the decision mak-
ing process. Our goal program reduces to a sequence
of three models. In principle, these models could be
solved in any order, but we take the point of view
that the nonlinear objective F
1
(y) should be optimized
last, in order to avoid imposing a nonlinear constraint.
Such a non-linear constraint would be computation-
ally crippling at the scale we are contemplating. The
last model therefore must optimize representativeness
subject to constraints on non-guaranteed revenue and
click value.
Since non-guaranteed revenue is undeniably mon-
etary, the most intuitive procedure might be to first
solve for F
3
:
max F
3
(y) (24)
subject to (8)-(11). Let the optimum objective func-
tion value be R
∗
. Then solve for maximum click
value:
max F
2
(y) (25)
subject to (8)-(11) and
∑
i
r
i
z
i
≥ ηR
∗
(26)
Let the optimum objective function value be P
∗∗
. We
may now optimize the representativeness function:
max F
1
(y) (27)
subject to (8)-(11) and
∑
i
r
i
z
i
≥ ηR
∗
(28)
∑
j
∑
i∈B
j
w
i j
y
i j
≥ ωP
∗∗
(29)
Clearly we could reverse the first two stages. This
would likely produce different results, but both would
be feasible.
5 EXPERIMENTS
We now present some experimental results using a
snapshot of real online graphical display advertising
data sets. Our specific focus is on quantifying the rel-
ative benefits of the various multi-objective optimiza-
tion approaches for a given data/forecast snapshot
as compared to the more traditional single-objective
optimization approaches, rather than the online ad
serving mechanisms (Devanur and Hayes, 2009; Vee
et al., 2009) that account for forecast errors, and could
use periodic re-optimization.
5.1 Experimental Setup
The data snapshot consists of guaranteed campaigns,
forecasts of user visits, non-guaranteed bids and
clicks, all based on a subset of historical data from
an operational display advertising system. The corre-
sponding bipartite allocation graph has 32,390 supply
nodes, 2,696 demand nodes and 1,407,753 edges. The
supply weight (s
i
) ranges from 10.83 to 1.18 × 10
9
.
The user visit goal (d
j
) ranges from 1 to 6.96 × 10
7
.
The non-guaranteed price (r
i
) ranges from 0.046 to
4.350. The click probability (p
c
i j
) ranges from 1.290×
10
−6
to 0.947 (the experiments only evaluate clicks,
not conversions).
Figure 2 shows the experimental flow. After a
snapshot of guaranteed campaigns are fetched from
the Campaign Database, the User Visit Forecasting is
invoked to generate a forecast of user visits that are
eligible for the guaranteed campaigns, and construct
the allocation graph. Then the Non-Guaranteed Fore-
casting and Click Forecasting are invoked in parallel
to annotate the allocation graph with non-guaranteed
price (r
i
) and click probabilities (p
c
i j
), respectively.
Finally the Optimizer is run to solve the various opti-
mization models proposed in the paper.
The metrics that we measure for the various opti-
mization runs are the non-guaranteed revenue, the to-
tal value of clicks, and the representativeness of guar-
anteed campaigns. The experiments are run for var-
ious values of the model parameter settings. In the
ICORES 2012 - 1st International Conference on Operations Research and Enterprise Systems
300
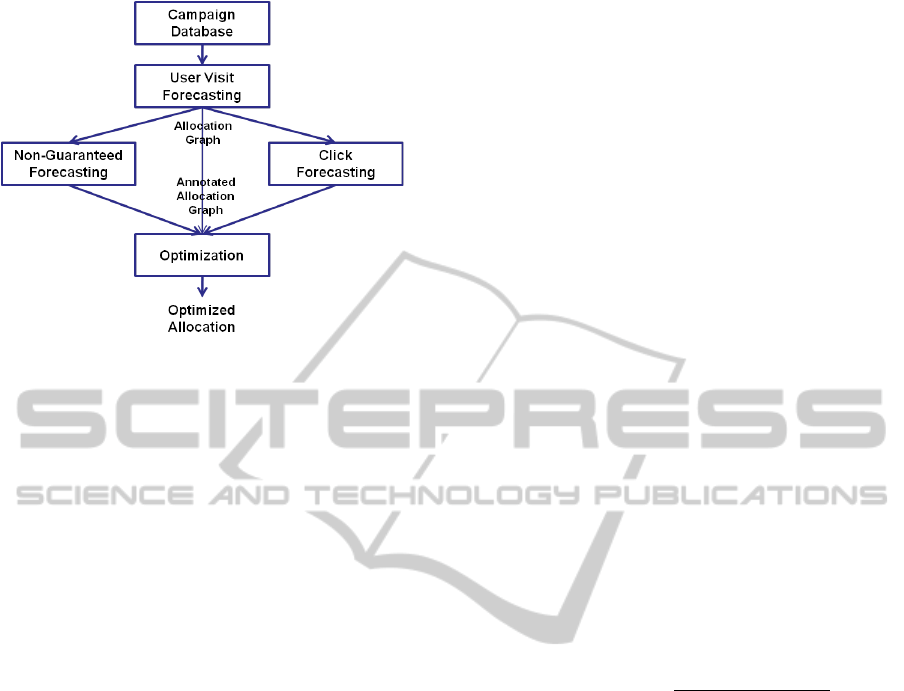
Figure 2: Experiment flowchart.
experiments, all the allocation priorities V
j
are set to
1 and all the click values W
c
j
are set to 10.
The experiments were run on a 64bit/64GB/2GHz
Linux box using the optimization package XpressMP
from Dash Optimization of FICO (FICO, 2010).
5.2 Forecast Models
Although the forecast models used here are not the
focus of this paper, we include a brief description of
each for completeness.
5.2.1 User Visit Forecasting
User visit forecasting uses time-series trend predic-
tions to predict the trend/growth in user visits for var-
ious pockets of supply such as Sports or Finance. Our
specific implementation uses SARIMA (Shumway
and Stoffer, 2007) for time-series predictions.
In addition, to generate the allocation graph, we
need to produce a sample of user visits. For this, we
follow the sampling procedure outlined in (Vee et al.,
2009), which produces a unbiased sample for the class
of optimization models that we consider in this paper.
Specifically, for each guaranteed campaign, the sup-
ply forecast selects k eligible user visits uniformly at
random. Once all of the user visits for all campaigns
are chosen, the weights given to each user visit is nor-
malized so that the total weight of any subset of user
visits is, in expectation, equal to the predicted avail-
able supply. The allocation graph is then created by
adding edges from the campaigns to their eligible user
visits.
5.2.2 Non-guaranteed Forecasting
The goal of the Non-Guaranteed Forecasting module
is to predict the expected revenue obtained by sell-
ing a particular user visit in the non-guaranteed mar-
ketplace. We observed that the prices paid for user
visits by the non-guaranteed contracts followed a log
normal distribution, with prices ranging from under
$0.10 CPM to above $10 CPM. To predict the price
of an individual user visit, we trained a generalized
least squares regression model on the logarithm of
the prices. Each user visit was annotated with a set
of user features, for example, age, gender, etc, and
a set of page features, for example, Sports, Finance,
etc. We used the value predicted by the model as the
non-guaranteed price r
i
.
5.2.3 Click Forecasting
Click forecasting estimates the probability that a dis-
played ad will be clicked in a particular user visit
context. Estimation of click-through rates (CTR) is
extensively applied in pay-for-performance systems
that attempt to maximize expected revenue (Richard-
son et al., 2007; Shaparenko et al., 2009). The esti-
mates can be based on historical click-through perfor-
mance statistics of features that are selected as signifi-
cant predictors of CTR. In this work, we use a logistic
regression model with the following functional form:
p(click|{ f
1
, . . . , f
K
}) =
1
1 + exp(
∑
K
k=1
w
k
f
k
)
(30)
where f
k
are predicates of features of the user visit
and the ad such as user age and gender, page con-
tent category, ad position in page, etc. Using histor-
ical data from web traffic that consist of page visits
with corresponding user visit and click statistics, we
learned the logistic regression parameters.
Finally, each edge in the allocation graph, which
represents a contract and a corresponding eligible user
visit, is annotated with features f
k
. The click model is
used to produce an estimate of the probability of click
p
i j
for each graph edge.
5.3 Experimental Results
We now present our experimental results for various
models and parameter settings. Each optimization for
a particular parameter combination takes about 5 to
10 minutes, which is quite acceptable as an offline
optimization step that can inform online serving algo-
rithms (Devanur and Hayes, 2009; Vee et al., 2009).
INVENTORY ALLOCATION FOR ONLINE GRAPHICAL DISPLAY ADVERTISING USING MULTI-OBJECTIVE
OPTIMIZATION
301
5.3.1 Baseline and Single-objective Solutions
As a baseline, we compute the optimization solution
that only ensures feasibility by minimizing the total
under-delivery penalty, but does not explicitly opti-
mize for the other objectives. The result for this base-
line solution is shown in the first row of Table 1 and is
used as the basis for normalization. We then optimize
for each single objective separately and report the nor-
malized solutions in the same table, were NGD refers
to non-guaranteed revenue, and GD refers to guaran-
teed representativeness. It can be seen that while op-
timizing a single objective may significantly improve
that objective, it has a potentially significant impact
on the other objectives.
Table 1: Baseline and single-objective solutions.
Objective NGD Click NGD+ GD
Click GD
Baseline 1 1 1 -1
NGD 1.0165 1.0905 1.0229 -0.9836
Click 1.0062 2.9136 1.1722 -2.2214
NGD+Click 1.0131 2.9013 1.1774 -1.7440
GD 0.9968 0.9226 0.9903 -0.0027
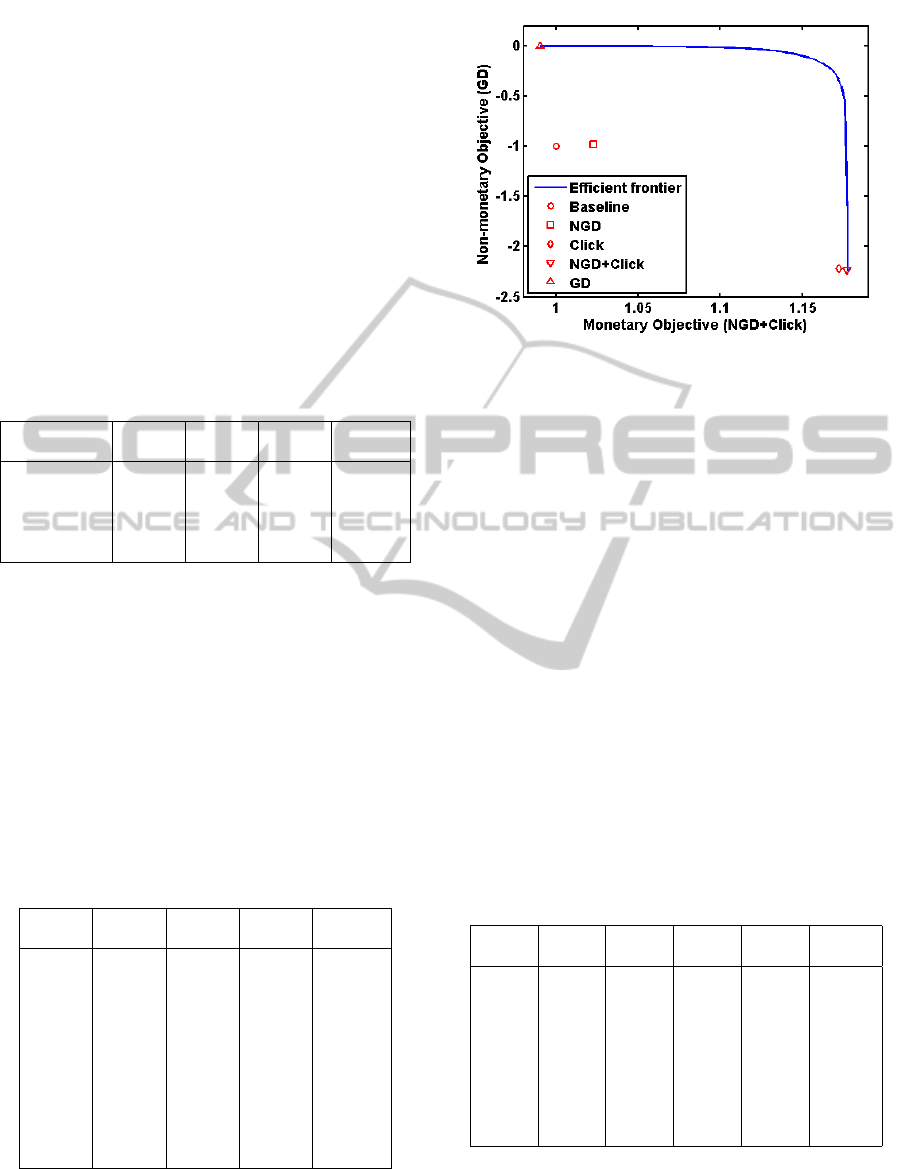
5.3.2 Two-stage Programming
We run the two-stage programming algorithm (Sec-
tion 4.4) with 100 different values of the ψ parameter.
Table 2 shows the objectives in normalized scale for a
subset of the generated efficient solutions. The whole
efficient frontier by using all the 100 points is de-
picted in Figure 3, which shows the trade-off between
the monetary objective (non-guaranteed revenue plus
click value) and the non-monetary objective (repre-
sentativeness).
Table 2: Two-stage programming results.
ψ NGD Click NGD+ GD
Click
0.8411 0.9968 0.9226 0.9903 -0.0027
0.8570 0.9978 1.1269 1.0090 -0.0028
0.8729 0.9993 1.3260 1.0277 -0.0034
0.8888 1.0016 1.5171 1.0464 -0.0046
0.9047 1.0047 1.6990 1.0651 -0.0069
0.9205 1.0079 1.8810 1.0838 -0.0109
0.9364 1.0094 2.0801 1.1026 -0.0181
0.9523 1.0110 2.2782 1.1213 -0.0328
0.9682 1.0127 2.4763 1.1340 -0.0660
0.9841 1.0131 2.6861 1.1587 -0.1474
0.9999 1.0131 2.9013 1.1774 -1.7440
Figure 3 also shows the baseline and single-
objective solutions as different symbols. The baseline
solution and most of the single-objective solutions are
located in the interior of the feasible solution region
Figure 3: Efficient frontier of two-stage programming.
and thus dominated by efficient solutions on the fron-
tier. Further, the efficient frontier shows that a very
small loss in one objective can lead to a significant
gain in the other objective, thereby enabling a better
combined trade-off as compared to single-objective
solutions.
5.3.3 Three-stage Programming
We run the three-stage programming algorithm (Sec-
tion 4.5) with 100 different combinations of the η and
ω parameters. Table 3 shows the objectives in nor-
malized scale for a subset of the generated efficient
solutions. The efficient frontier for the tri-objective
optimization problem is a surface in a 3D space. One
way to visualize the efficient frontier is to project it
to a 2D space by fixing the level in the third dimen-
sion. Figure 4 shows three such contours in the space
of click value and GD representativeness for evenly-
spaced NGD revenues. The trade-off among the three
objectives can be observed by comparing points on
the same contour and between different contours.
Table 3: Three-stage programming results.
η ω NGD Click NGD+ GD
Click
0.9961 0.3812 1.0125 1.1075 1.0208 -0.0084
0.9961 0.6906 1.0125 2.0067 1.0990 -0.0180
0.9961 1.0000 1.0125 2.9058 1.1772 -1.7272
0.9981 0.4073 1.0145 1.1740 1.0284 -0.0129
0.9981 0.7037 1.0145 2.0281 1.1027 -0.0232
0.9981 1.0000 1.0145 2.8823 1.1770 -1.7225
0.9999 0.6967 1.0165 1.1209 1.0255 -0.3264
0.9999 0.8483 1.0165 1.3649 1.0468 -0.3280
0.9999 0.9999 1.0165 1.6090 1.0680 -0.5039
5.4 Discussion
The results above and especially the efficient frontier
give us a global picture of the trade-off among dif-
ICORES 2012 - 1st International Conference on Operations Research and Enterprise Systems
302
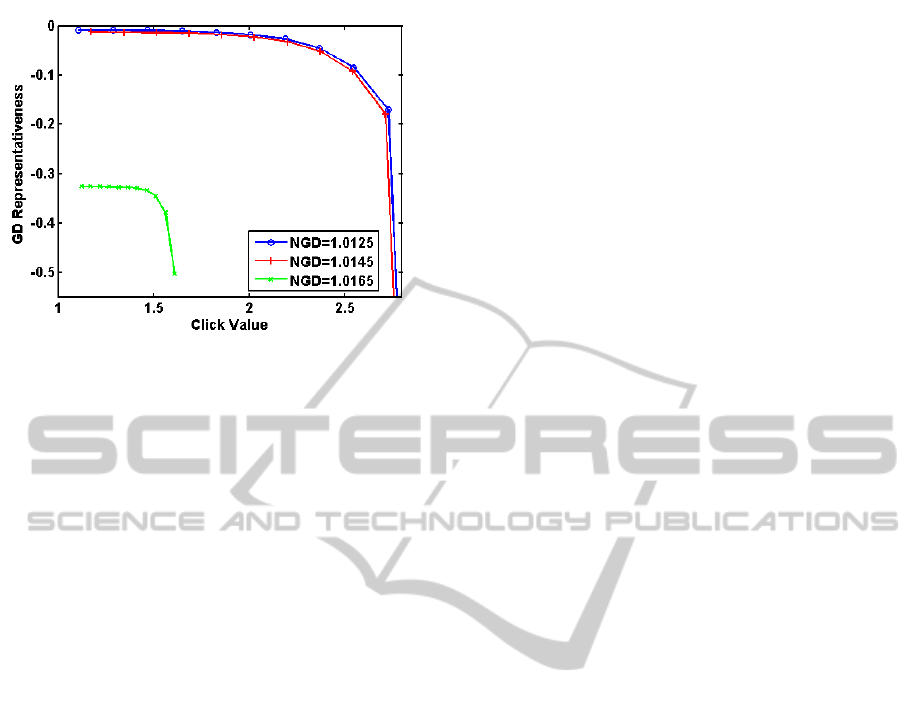
Figure 4: Efficient frontier of three-stage programming.
ferent objectives. It reveals what percentage of one
objective can be gained at the cost of one percent of
another objective and how the trade-off rate changes
with the location of the solution, thereby providing
valuable insight in setting the right parameters in a
real production system to truly reflect the business pri-
ority. Perhaps more importantly, it demonstrates the
significant benefit of a combined optimization model
for multiple objectives, as opposed to optimizing for
just a single objective.
6 CONCLUSIONS
In this paper we have shown that multi-objective opti-
mization provides an efficient and flexible framework
for the allocation of user visits to guaranteed and non-
guaranteed campaigns. The proposed models also in-
corporate a very flexible means of taking into account
revenue derived from clicks, as well as non-monetary
objectives, in particular, “representativeness” or “fair-
ness”, in the allocation of eligible user visits to cam-
paigns. We are able to do this using off-the-shelf soft-
ware, such as a commercial scale optimization system
for large scale quadratic programming, or specialized
network optimization codes for some steps.
We believe that the proposed models can be ex-
tended to other objectives of interest such as ad rele-
vance. As part of future research, we are exploring ex-
tensions to the model to include stochastic elements,
such as uncertainty in supply and demand, and non-
linear pricing.
ACKNOWLEDGEMENTS
We gratefully acknowledge the assistance of Sumanth
Jagannath and Wenjing Ma in preparing the data for
our experiments, and Jianchang Mao for managing
much of the click model development.
REFERENCES
Aggarwal, G., Goel, A., and Motwani, R. (2006). Truthful
auctions for pricing search keywords. In Proc. of the
7th ACM Conf. on Electronic Commerce.
Aleai, S., Arcaute, E., Khuller, S., Ma, W., Malekian, A.,
and Tomlin, J. (2009). Online allocation of display
advertisements subject to advanced sales contracts. In
Proc. of the 3rd Int. Workshop on Data Mining and
Audience Intelligence for Advertising (ADKDD).
Bertsekas, D. (1998). Network Optimization: Continuous
and Discrete Models. Athena Scientific Press.
Bollapragada, S., Chen, H., Phillips, M., Garbiras, M., Sc-
holes, M., Gibbs, T., and Humphreville, M. (2002).
NBC’s optimization systems increase revenues and
productivity. Interfaces, 32(1):47 – 60.
Broder, A. Z. (2008). Computational advertising and rec-
ommender systems. In Proceedings of the 2008 ACM
conference on Recommender systems.
Broder, A. Z., Fontoura, M., Josifovski, V., and Riedel, L.
(2007). A semantic approach to contextual advertis-
ing. In Proc. ACM SIGIR.
Devanur, N. and Hayes, T. (2009). The adwords problem:
Online keyword matching with budgeted bidders un-
der random permutations. Presented at EC.
Easterly, A. (2009). Revenue management in online ad-
vertising: Challenges and opportunities. Presented at
INFORMS.
Feige, U., Immorlica, N., Mirrokni, V., and Nazerzadeh,
H. (2008). A combinatorial allocation mechanism
with penalties for banner advertising. Presented at IN-
FORMS.
Feldman, J., Mehta, A., Mirrokni, V., and Muthukrishnan,
S. (2009). Online stochastic matching: Beating 1-1/e.
Presented at FOCS.
FICO (2010). Xpress—Optimizer Reference Manual.
Ghosh, A., McAfee, R., Papineni, K., and Vassilvitskii,
S. (2009). Bidding for representative allocations for
display advertising. In Proc. of the 4th interna-
tional Workshop on Internet and Network Economics
(WINE).
Han, P. (2009). Yield optimization in display ad networks.
Presented at INFORMS.
Langheinrich, M., Nakamura, A., Abe, N., Kamba, T., and
Koseki, Y. (1999). Unintrusive optimization tech-
niques for web advertising. In Proc. of World Wide
Web Conf. (WWW1999).
Nakamura, A. and Abe, N. (2005). Improvements to the lin-
ear programming based scheduling of web advertise-
ments. J. Electronic Commerce Research, 5:75–98.
Radovanovic, A. and Zeevi, A. (2009). Revenue maximiza-
tion in reservation-based online advertising. Presented
at INFORMS.
Richardson, M., Dominowska, E., and Ragno, R. (2007).
Predicting clicks: Estimating the click-through rate
INVENTORY ALLOCATION FOR ONLINE GRAPHICAL DISPLAY ADVERTISING USING MULTI-OBJECTIVE
OPTIMIZATION
303

for new ads. In Proc. of World Wide Web Conf.
(WWW2007).
Roels, G. and Fridgeirsdottir, K. (2009). Dynamic revenue
management for online display advertising. Journal
of Revenue and Pricing Management, 8(5):452–466.
Shaparenko, B., C¸ etin, O., and Iyer, R. (2009). Data-driven
text features for sponsored search click prediction. In
Proc. of the 3rd Int. Workshop on Data Mining and
Audience Intelligence for Advertising (ADKDD).
Shumway, R. and Stoffer, D. (2007). Time Series Analysis
and Its Applications. Springer.
Steuer, R. (1986). Multiple criteria optimization: theory,
computation, and application. Wiley, New York.
Tomlin, J. (2000). An entropy approach to unintrusive tar-
geted advertising on the web. In Proc. of World Wide
Web Conf. (WWW2000).
Vee, E., Vassilvitskii, S., and Shanmugasundarum, J.
(2009). Optimal online assignment with forecasts. Ya-
hoo! Labs research report YL- 2009-005.
Wilson, A. (1970). Entropy in Urban and Regional Mod-
elling. Pion Press, London.
Yang, J. (2009). Multi-objective optimization for online
advertising inventory allocation - an extension. Pre-
sented at INFORMS.
Yang, J. (2010). Inventory allocation for online advertising
with malleable supply. Presented at INFORMS.
Yang, J. and Tomlin, J. (2008). Advertising inventory al-
location based on multi-objective optimization. Pre-
sented at INFORMS.
ICORES 2012 - 1st International Conference on Operations Research and Enterprise Systems
304
