
HIGH RESOLUTION TIME-OF-ARRIVAL FOR A CM-PRECISE
SUPER 10 METER 802.15.3C-BASED 60GHZ OFDM POSITIONING
APPLICATION
Tom Redant
1
and Wim Dehaene
1,2
1
ESAT-MICAS, K.U. Leuven, Kasteelpark Arenberg 10, B-3001 Leuven, Belgium
2
IMEC, Kapeldreef 75, B-3001 Leuven, Belgium
Keywords:
Time-of-Flight Estimation, 60GHz, 802.15.3c, NLOS-fading, High Resolution.
Abstract:
A 802.15.3c-compatible technique for super 10 meter cm-accurate and precise ranging is introduced, achie-
ving update rates of more than 300kHz. The implementation is realized on top of the 802.15.3c PHY High-
Speed-Interface mode, specifying a multi-carrier orthogonal frequency division multiplexed (OFDM) imple-
mentation. The aimed application conditions foresee strong discrete non-line-of-sight fading conditions. The
system’s performance is evaluated over these strong channel conditions. Due to the high absorption in the
60GHz band and thus the poor signal-to-noise ratio at super 10m distances the algorithm should be noise
tolerant. The algorithm combines a classic auto correlation with the MLS-Prony method, a high resolution
technique for frequency content analysis.
1 INTRODUCTION
Wireless Personal Area Networks (WPANs) are
emerging in today’s electronic devices, achieving su-
per Gbit/s data rates over sub-10m distances. The re-
cent 802.15.3c PHY standard (IEEE, 2009) specifies a
high speed interface mode (HSI), achieving these su-
per Gbit/s data rates, using orthogonal frequencydivi-
sion multiplexing (OFDM) instead of a single carrier
(SC) operation mode. The 802.15.3c HSI standard
specifies a bandwidth B of 2.64GHz for signals u(t)
at a carrier frequency f
c
of 60GHz and is therefore
extremely suited for Time-of-Flight (ToF) and Time-
of-Arrival (ToA) estimation, as Eqn. (1) of (Quazi,
1981) states.
σ
ToA
≤ K
β
(
1
T
)
1/2
1
SNR
β
·
1
p
( f
c
+ B/2)
3
− ( f
c
− B/2)
3
(1)
This equation represents the Cram´er-Rao lower (CR)
bound for the precision of passive ToF based radar
applications in the presence of white Gaussian noise.
β = 1/2 for high SNR values and β = 1 for low SNR
values. It shows the inverse relationship of the rang-
ing precision standard deviation σ
ToA
and the signal’s
bandwidth B, carrier frequency f
c
the signal’s signal-
to-noise ratio (SNR) and its duration T. K
β
is a β
depending proportionality constant. However, this
equation assumes that the complete bandwidth con-
tains a flat power allocation. The 802.15.3c HSI PHY
standard is OFDM-based and the CR bound of this
discrete carrier implementation is expected to enable
ranging applications at a slightly reduced precision
with respect to the flat power allocation. This paper
will analyze the CR bound for OFDM-based ranging
systems in the 60 GHz band based on the 802.15.3c
HSI PHY standard.
Although, maximum propagation distances are
around 10m for the 802.15.3c HSI PHY standard, us-
ing an appropriate ToA estimation algorithm can push
the suitability of the 802.15.3c HSI PHY specification
towards higher distances, as is wanted for the appli-
cation of interest. Moreover, the authors’ application
specifies strong discrete multipath propagation, ask-
ing for a multipath tolerant algorithm. High update
rates are required and thus 1/T will be high. The
effect of the small time window T is compensated by
the broad bandwidth of the 802.15.3c HSI PHY. For
the sake of reducing implementation costs, no multi-
ple antenna techniques are considered for the applica-
tion of interest.
The relation between the baseband received sig-
nal y(t), the ideally transmitted baseband signal u(t),
the channel noise n(t) and the baseband-equivalent
channel impulse response h(t) is as shown in Eqn. (2).
271
Redant T. and Dehaene W..
HIGH RESOLUTION TIME-OF-ARRIVAL FOR A CM-PRECISE SUPER 10 METER 802.15.3C-BASED 60GHZ OFDM POSITIONING APPLICATION.
DOI: 10.5220/0003730302710277
In Proceedings of the 2nd International Conference on Pervasive Embedded Computing and Communication Systems (PECCS-2012), pages 271-277
ISBN: 978-989-8565-00-6
Copyright
c
2012 SCITEPRESS (Science and Technology Publications, Lda.)

y(t) = h(t) ∗ u(t) + n(t) =
Z
∞
0
h(τ) · u(t − τ)dτ+ n(t)
(2)
For typical indoor non-line-of-sight (NLOS) condi-
tions, where the line-of-sight (LOS) component faces
obstacles, the baseband equivalent channel impulse
responses can be identified as:
h(t) =
M− 1
∑
i=0
A
i
· δ(t − t
i
) · e
− j·2πf
c
t
(3)
with ∃A
i
: A
i
≈ A
0
for NLOS conditions. A
i
are the tap
gains, t
i
the tap time instants, M the number of mul-
tipath components j is the imaginary unit. As a good
approximation, and for simulation purposes, this can
be modeled as: h(t) =
∑
M
i=0
A
i
· δ(t − t
i
) · e
j·θ
i
, with θ
i
uniformly distributed in [0, 2π). The baseband equiv-
alent h(t) is a complex function.
High resolution techniques enable higher ranging pre-
cisions than is enabled by the sample rate of the re-
ceiver system. (Neri et al., 2010) introduces a high
resolution technique based on Kalman filters esti-
mating the ToA. However, no NLOS-channel-aware
techniques are implemented to cancel channel ef-
fects. (Xu et al., 2008) introduces a high resolu-
tion least squares based technique providing good re-
sults for frequency hopping OFDM applications. Due
to 802.15.3c HSI PHY standard limitations, no fre-
quency hopping is considered here. This paper will
focus on the high resolution technique listed in (Tufts
and Kumaresan, 1982). This algebraic technique can
be applied to get a high resolution viewon the channel
behavior, the impulse response h(t). This is done by
examining the discretized impulse response estimate
ˆ
h[k] of h[k] = h(k·T
s
) (T
s
the sample rate)(Winter and
Wengerter, 2000).
Section 2 shows insights on OFDM-based rang-
ing, moreover introduces a CR-bound for this multi-
carrier way of ranging. Section 3 describes the
802.15.3c compatible ranging package structure for
the application. Section 4 and 5 respectively intro-
duce the coarse and fine ToA estimation steps in order
to come to a precise and accurate ToA figure. Section
6 evaluates the algorithm’s results for a real channel
and crystal offset values. Conclusions are drawn in
section 7.
2 OFDM-BASED RANGING
Ranging applications clasically use single-carrier
(SC) methods in order to find the ToA. The fact that
OFDM is a good data carrier partially motivates its
choice for a ranging application since hardware for
both data communications and ranging can then be
combined. However, OFDM’s inherent ranging abili-
ties need to be verified first. An evaluation of the CR-
bound for the 802.15.3c HSI PHY spec needs to be
carried out. In order to find this CR-bound, the gen-
eral expression Eqn. (4) of (Knapp and Carter, 1976)
needs to be evaluated:
σ
ToA
≥
2· T ·
Z
∞
0
(2· π· f)
2
|γ( f)|
2
1− |γ( f )|
2
d f
−1
(4)
with:
|γ( f)|
2
=
G
2
uu
( f)
(G
uu
( f) + G
nn
( f))
2
.
G
uu
( f) and G
nn
( f) are respectively the PSD of the
ranging signal and the uncorrelated noise. This ex-
pression will be evaluated for white noise and the dis-
crete OFDM carrier allocation. According to (Liu and
Li, 2004), the PSD of an OFDM package is:
G
uu
( f) = K ·
N/2−1
∑
−N/2
|W( f − f
c
− k· ∆f)|
2
(5)
K is a proportionality constant. W( f) is the Fourier
transform of the window function for the OFDM sym-
bol. In an OFDM receiver, over the period of this win-
dow, a discrete fourier transform (DFT) is carried out.
For a block pulsed window function of duration T
DFT
this results into:
|W( f)|
2
=
sin
2
(π fT
DFT
)
π
2
f
2
T
DFT
2
. (6)
The integral in Eqn. (4) cannot be evaluated analyt-
ically. Instead, a numerical evaluation of this bound
will provide insights for the ranging abilities of the
802.15.3c HSI PHY. The time domain over which the
ranging precision is evaluated is T
DFT
= 202ns, the
duration of one 802.15.3c OFDM package. All 336
available data sub carriers (see Table 1 for details)
are assumed to have equal energy, including the static
modulations on the 16 pilot tones. A time domain
raised cosine windowing with rise time T
r
= 0.01· T
is chosen. The bound is plot in Fig. 1 as a function of
the signal’s SNR. It is compared to the flat frequency
band CR-bound (Quazi, 1981) having equal signal
power. The CR-bound for the 802.15.3c HSI PHY
spec is roughly equal to the flat frequency band case
and doesn’t suffer performance degradationcompared
to the flat spectrum case. Using OFDM for ranging is
thus motivated.
3 PACKAGE STRUCTURE
So far, a theoretical analysis on the ranging abilities
of the 802.15.3cOFDM signals was carried out in this
PECCS 2012 - International Conference on Pervasive and Embedded Computing and Communication Systems
272

Table 1: Frequency domain sub carrier allocation for the 802.15.3c HSI PHY OFDM spec.
Sub carriers Number of Logical
type sub carriers sub carriers indexes
Zero sub carriers 160 [−256 : −178] ∪ [−1,0,1] ∪ [178: 255]
Pilot sub carriers 16 [−166 : 22 : −12] ∪ [12 : 22 : 166]
Data sub carriers 336 All others
−10 −5 0 5 10
10
−5
10
−4
10
−3
signal SNR (dB)
CR−bound on σToA (m)
CR−bound on σ
ToA
as a function of input signal SNR
(f
c
=60 GHz, B=1.7558 GHz, T=201.7336 ns)
512 subcarrier 802.15.3c HSI PHY OFDM
Quazi’s flat spectrum at low SNR
Quazi’s flat spectrum at high SNR
Figure 1: CR-bound for the 802.15.3c HSI PHY specifica-
tion compared to the flat bandwidth allocation approxima-
tion of (Quazi, 1981)
paper. This section introduces the package structure
which will be used in the process of ToA estimation.
Moreover, so far, only white Gaussian noise perturba-
tions were considered as a performancelimiting effect
on the σ
ToA
. Since the ranging method should be tol-
erant to discrete multipath conditions, channel esti-
mation should be carried out and the package should
have dedicated fields for this. The 802.15.3c pream-
ble enables channel estimation techniques based on
Golay sequences. However, due to noise corruption
of the received signals at super-10m distances, this
built-in short sequence does not provide enough aver-
aging to suppress the noise in the aimed application.
This is why the authors introduced N
DFT
= 10 identi-
cal payload OFDM symbols of 512 samples, trailing
the preamble. All N
DFT
OFDM symbols’ sub carriers
are modulated by 1 · e
j·α
i
, with each α
i
an arbitrary
phase, known by the receiver’s back-end. The α
i
val-
ues can be chosen in a way the peak-to-averagepower
ratio (PAPR) is low to tackle non-linearity issues in
both transmit and receive paths. Additionally, the ex-
tra 16 pilot tones are modulated by ones. No guard
interval is applied between consecutive OFDM sym-
bols. Channel estimation and compensation can now
be carried out using these N
DFT
additional OFDM
symbols. The 5
th
order Butterworth filter with cut-
off frequency
178
512
· B/2 is used to satisfy the spectral
mask criterion (Fig. 2). Satisfying the specifications’
−6 −4 −2 0 2 4 6
−80
−60
−40
−20
0
802.15.3c signal spectral mask + actual signal PSD
Signal’s PSD (normalized) (dB)
Frequency offset from 60 GHz carrier (GHz)
PSD of transmitted signal
Spectral mask
Figure 2: Power spectral density of the transmitted signal.
The transmit filter is modeled by the 5
th
order Butterworth
filter having a cutoff frequency of
178
512
· B/2.
PHY PREAMBLE FRAME HEADER
10x OFDM SYMBOL
=802.15.3c PAYLOAD
r
i
arbitrary
phase
332x
r
i
zero
phase
16x
pilot
time axis
802.15.3c802.15.3c SHORT
t
ToA
t
ToACoarse
t
ToA
^
^
10 OFDM SYMBOLS
short phy preamb: 6.75x512 samples
frame header: (128+512) samples
payload: 10x512 samples
total: 9216 samples
T= 3.5 µs
Figure 3: The considered ranging package. 10 OFDM sym-
bols are appended to the 802.15.3c HSI PHY preamble. All
32 data sub carriers are equal gain and arbitrary phase mod-
ulated. The 16 pilot sub carriers are modulated by all ones.
spectral mask is an important action, yet, it is often
omitted in algorithmic papers. The complete package
structure is visualized in Fig. 3. The figure also de-
fines the position of the t
ToA
, being the time stamp on
which the first payload OFDM symbol is received.
4 AUTO CORRELATION AS
COARSE TOA ESTIMATION
The here-applied ToA estimation is based on aligning
the (discrete Fourier transform) DFT window to the
N
DFT
OFDM symbols, trailing the preamble. How-
ever, due to the high amount of identical trailing
OFDM symbols, this alignment procedure can re-
HIGH RESOLUTION TIME-OF-ARRIVAL FOR A CM-PRECISE SUPER 10 METER 802.15.3C-BASED 60GHZ
OFDM POSITIONING APPLICATION
273
sult in a misalignment by k · T
DFT
, with k an inte-
ger and T
DFT
the OFDM symbol duration. This is
why an initial coarse timing estimate
ˆ
t
ToACoarse
, po-
sitioning this DFT window, should lie in the interval
[t
ToA
−
T
DFT
2
...t
ToA
+
T
DFT
2
]. For this coarse timing es-
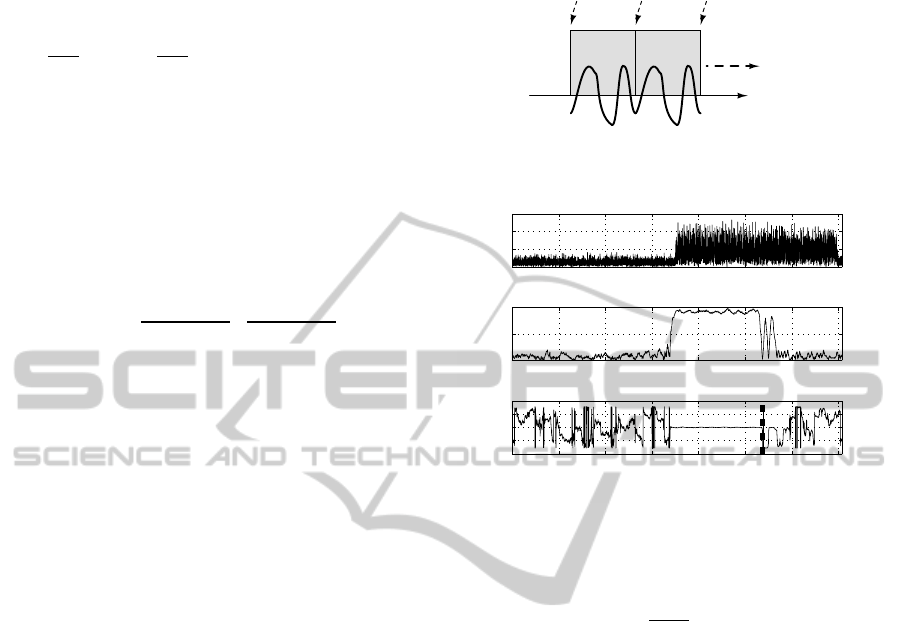
timate an auto correlation operation is preferred. The
definition of the auto correlation for the signal y[k] is
shown in Eqn. (7) and Fig. 4. ∆k = 128 is the win-
dow over which auto correlation is carried out and the
∗
-operator represents the complex conjugation.
def : r
u
[k] =
k+∆k
∑
i=k
u[i] · u[i+ ∆k]
∗
r
y
[k] = |h[0]|
2
·
k+∆k
∑
i=k
u[i] · u[i+ ∆k]
∗
| {z }
+n
′
[k]
Wantedcontribution (7)
+
M
∑
l=1
M
∑
m=1
h[l] · h[m]
∗
k+∆k
∑
i=k
u[i− l] · u[i− m]
∗
The
ˆ
t
ToACoarse
is found by detecting a phase jump
of π in the auto correlation phase. Fig 5 shows the
802.15.3c HSI PHY preamble and the amplitude and
phase output of the auto correlation. The dashed
line in the correlation phase realizes a fixed time
difference with the ToA coarse estimate as is indi-
cated in (Fig. 3). The reason why an auto corre-
lation is preferred is that this operation is generally
known to be less susceptible to fading channel con-
ditions than cross correlation based synchronizations
(K. Wang and Tolochko, 2003). However, one should
be aware of the fact that the auto correlation expres-
sion shows a |h(0)|
2
-gain for the LOS component,
stressing the NLOS components’ gain with respect to
the weaker h[0]-LOS component when facing a severe
NLOS propagation. Whereas using the cross corre-
lation (the LOS component has a gain of h[0]), this
NLOS-stressing does not occur under severe NLOS
conditions since it is a linear operation.
5 HIGH RESOLUTION
TECHNIQUE AS FINE TOA
ESTIMATION
The initial auto correlation based coarse ToA estimate
is important for the high resolution technique. For
this technique a frequency domain content analysis is
performed and thus a DFT window needs to be posi-
tioned in an accurate way.
For pure data recovery, synchronization of the DFT
window is not a critical issue to obtain channel in-
formation, thanks to the cyclic prefix. A malposi-
u[k] u[k+∆k] u[k+2∆k]
128
samples
128
samples
AUTO CORRELATION
t (samples)
moving window
Figure 4: Illustration of the auto correlation operation.
0 1000 2000 3000 4000 5000 6000 7000
0
1
2
3
Sample index
Amplitude 802.15.3c
preamble (a.u.)
1000 2000 3000 4000 5000 6000 7000
0
0.5
1
Amplitude
a−corr. (a.u.)
Sample index
0 1000 2000 3000 4000 5000 6000 7000
−4
−2
0
2
4
Sample index
Phase
a−corr. (rad)
Figure 5: The auto correlation applied to the 802.15.3c HSI
PHY preamble.
tioning of the DFT window by ∆T
DFT
causes the sig-
nal’s frequency domain taps’ phase to be shifted lin-
early by a slope 2 · π ·
∆T
DFT
T
DFT
, T
DFT
representing the
time window over which the DFT is performed. For
ToA estimation, knowing this linear phase perturba-
tion is a main concern. In order to identify the lin-
ear phase contribution caused by a misaligned DFT,
a simple linear regression on the frequency domain
taps phases seems to be sufficient. However, when
facing severe channel multipath components, an elab-
orated analysis of the estimated impulse response
ˆ
h[k]
or its frequency domain version
ˆ
H is needed. High
resolution techniques based on identifying the fre-
quency content (Tufts and Kumaresan, 1982) of the
frequency domain channel taps
ˆ
H bring a solution.
In (Winter and Wengerter, 2000) the Modified-Least-
Squares-Prony method (MLS-Prony), based on linear
prediction modeling and noise reduction, is applied to
GSM signals improving ranging capabilities of a mo-
bile phone based ToA ranging system. In this paper,
it is used as a fine-tuning step after finding the coarse
auto correlation based timing estimate. It is applied to
802.15.3c HSI signals, dealing with the finite knowl-
edge of the frequency domain impulse response due
to the inherent notches by the presence of guard car-
riers. The MLS-Prony method is applied to the fre-
quency domain channel taps, the
ˆ
H vector:
PECCS 2012 - International Conference on Pervasive and Embedded Computing and Communication Systems
274

N
DFT
·
ˆ
H =
N
DFT
∑
i=1
F
h
y[
ˆ
k
s
+ 512(i− 1)], ..., y[
ˆ
k
s
+ 512i− 1]
i
F
h
u[
ˆ
k
s
+ 512(i− 1)], ..., u[
ˆ
k
s
+ 512i− 1]
i
with : (8)
ˆ
k
s
=
ˆ
t
ToACoarse
T
s
.
The F operation represents the 512-point DFT. The
ˆ
H vector is realized by a tap-by-tap division of two
512 tap DFT vectors. In order to match the sub
carrier allocation of Table 1, the
ˆ
H vector is indexed
-256..255. Due to the inherent notches in the sub
carrier spectrum, a limited scope on this frequency
domain taps is provided.
The high resolution method itself (Winter and
Wengerter, 2000) is based on identifying the linear
prediction filter with length L producing the
ˆ
H sam-
ples. The zeros r
i
of the prediction error filter are
complex and those close to the unit circle represent
the
ˆ
H vector’s frequency content, which is related to
the time domain impulse response
ˆ
h[k]’s multipath
time instances and thus the ToA. The root with the
lowest phase value defines the line of sight component
and thus provides a correction to the initial
ˆ
t
ToACoarse
timing estimate:
ˆ
t
ToA
= min
i
N · T
s
2· π
∠ (r
i
)
+
ˆ
t
ToACoarse
(9)
The ∠-operator represents the complex angle. In this
work, a maximum correction ability |
ˆ
t
ToACoarse
−
ˆ
t
ToA
|
for the MLS-Prony method is applied, according to
the performance of the
ˆ
t
ToACoarse
estimation. The
interval [
−10m
c
,
10m
c
] seems reasonable for the auto
correlation implementation. c is the speed of light.
T
s
= 1/[2.64GHz] represents the receiver sample rate,
N the number of samples of the signal to which the
MLS-Prony method is applied.
The here-proposed modification of the MLS-Prony
algorithm is based on the matrix A. This data matrix
A, which is needed in the process to identify the lin-
ear prediction filter, should only be filled by the cor-
responding non-zero
ˆ
H values. Therefore, it is con-
structed based on the concatenation of 2 data matrices
based on respectively the lower and higher non-zero
176 frequency domain taps. Eqn. (11) defines this
matrix.
A
T
=
A
T
low
A
T
high
=
"
ˆ
H
−168
·· ·
ˆ
H
−3
ˆ
H
∗
−176
·· ·
ˆ
H
∗
−11
ˆ
H
11
·· ·
ˆ
H
176
ˆ
H
∗
3
·· ·
ˆ
H
∗
168
.
.
.
.
.
.
.
.
.
.
.
.
.
.
.
.
.
.
.
.
.
.
.
.
.
.
.
.
.
.
.
.
.
.
.
.
ˆ
H
−177
·· ·
ˆ
H
−12
ˆ
H
∗
−167
·· ·
ˆ
H
∗
−2
ˆ
H
2
·· ·
ˆ
H
167
ˆ
H
∗
12
·· ·
ˆ
H
∗
177
#
(10)
The
T
operator represents the matrix transpose.
The H matrix for the algorithm of (Winter and
Wengerter, 2000) will be reformed into:
H
T
=
H
T
low
H
T
high
=
ˆ
H
−167
···
ˆ
H
−2
ˆ
H
−177
···
ˆ
H
−12
ˆ
H
12
···
ˆ
H
177
ˆ
H
2
···
ˆ
H
167
In order to reduce the computational complexity, no
noise reducing singular value decomposition is car-
ried out on the A matrix.
6 SIMULATION RESULTS
An algorithmic Matlab model of the transmitter,
channel and receiver is implemented according to the
design decisions as presented in sections 3, 4 and 5.
The channel is modeled by a random additive white
Gaussian noise contribution (AWGN) and multipath
propagation according to Eqn. (3). The considered
impulse response is shown in Eqn. (11).
h(t) = 0.25 · δ(t) · e
j·θ
1
+ δ(t −
5m
c
) · e
j·θ
2
+ δ(t −
6m
c
) · e
j·θ
3
+ δ(t −
7.5m
c
) · e
j·θ
4
(11)
Transmitter-receiver crystal frequency mismatch, re-
sulting in carrier frequency offset (CFO) and sam-
pling clock offset (SCO) is modeled. No Doppler
frequency shift is considered since the application’s
wireless nodes move at low speed. This means that
CFO and SCO perturbations are equal, and linked by
the shared receiver’s crystal. This work assumes a
CFO estimation and compensation as is proposed in
(Moose, 1994). This is a straightforward approach.
Iterative, and joint timing and frequency synchro-
nization approaches are available (Minn et al., 2003),
(Abdzadeh-Ziabari and G. Shayesteh, 2011) but they
come at an increased computation cost. Moreover,
(Minn et al., 2003) makes abstraction of the SCO. Af-
ter frequency offset compensation, the resulting fre-
quency error is a function of the received signal’s
Signal-to-Noise-Ratio (SNR
y
) and satisfies the con-
ditions for its mean (µ) and its standard deviation (σ)
as is shown in Eqn. (12).
µ[
ˆ
ε− ε | ε] = 0
σ
2
[
ˆ
ε− ε | ε] =
1
4π
2
· SNR
y
· ∆T
estim
/2· B
(12)
ε en
ˆ
ε are the normalized actual and estimated fre-
quency offset. ∆T
estim
is the time window over which
the frequency offset is estimated. The SYNC field
HIGH RESOLUTION TIME-OF-ARRIVAL FOR A CM-PRECISE SUPER 10 METER 802.15.3C-BASED 60GHZ
OFDM POSITIONING APPLICATION
275

of the PHY preamble consists of 14 code repeti-
tions of the 128 sample a
128
, and therefore ∆T
estim
=
14· 128· T
s
= 679ns. These formulae provide interes-
ting information on the expected amount of frequency
mismatch. (Moose, 1994), (Pollet et al., 1995) and
(Pollet et al., 1994) all provide formulae, expressing
the effect of a resulting CFO and SCO as an SNR-
degradation to the signal, modeling the inter carrier
interference (ICI) and inter symbol interference (ISI).
However, in this work the resulting CFO and SCO are
applied to the signal y[k] according its definition in
Eqn. (13), providing signal y
′
[k], which is fed to the
algorithm. This approach enables realistic simulation
results.
y
′
[k] = y(t) · e
j·2·π(
ˆ
ε−ε)·[60GHz]·t
|
t=k·T
s
·(1+(
ˆ
ε−ε))
(13)
Fig. 6 shows the technique’s ToA performance fig-
ures. For each input SNR value (20 dB down to
3 dB), 1000 different sets {θ
1
, .. θ
4
} for the NLOS-
AWGN-channel of Eqn. (11) are evaluated and both a
good precision and accuracy is achieved. For the sake
of comparison, the auto correlation based
ˆ
t
ToACoarse
is also evaluated. The auto correlation operation is
normalized in order to compensate for channel gain
variations (K. Wang and Tolochko, 2003). Its perfor-
mance is more-or-less constant over the AWGN-SNR
range, but it faces an overestimation of more than 6m
due to the time-spread caused by the discrete multi-
path components. The here-proposed method shows
a cm-accurate and precise ToA estimation at the low-
est SNR values. These values correspond to distances
over 10m.
7 CONCLUSIONS
In this paper, the ranging abilities for the 802.15.3c
HSI PHY OFDM standard are evaluated in order to
enable an integrated 60 GHz cm-ranging/data com-
munications system. A general evaluation of the
OFDM ranging capabilities is performed. A rang-
ing method for non-frequency locked, frequency off-
set compensating, wireless nodes is introduced. The
MLS-Prony high resolution technique is an interes-
ting tool and implies cm-precise and accurate rang-
ing for discrete multipath NLOS-conditions at 60
GHz 802.15.3c HSI WPAN, using a single antenna.
The MLS-Prony data matrix is modified in order to
deal with zero sub carriers. The technique still per-
forms well at SNR values close to 3 dB. 10 addi-
tional OFDM-packages are added to the HSI pream-
ble, achieving a total package length of 3.5µs, reali-
zing a super 300kHz update rate.
4 6 8 10 12 14 16 18 20
10
−3
10
−2
10
−1
10
0
Received signal’s SNR (dB)
Ranging precision (m)
Ranging precision and accuracy a function of the input signal’s SNR
variance
1/2
for high res. method
variance
1/2
for auto corr. method
4 6 8 10 12 14 16 18 20
−0.06
−0.04
−0.02
0
0.02
0.04
Received signal’s SNR (dB)
Ranging accuracy (m)
mean for high res. method
2 4 6 8 10 12 14 16 18 20
5.5
6
6.5
Received signal’s SNR (dB)
Ranging accuracy (m)
mean for auto corr. method
Figure 6: Accuracy (|
ˆ
t
ToA
−t
ToA
|) and precision
p
Var(
ˆ
t
ToA
−t
ToA
)
as a function of the received signal’s SNR for the high re-
solution MLS-Prony method and the auto correlation. Both
methods face a positively biased ranging error due to the
trailing multipath energy.
ACKNOWLEDGEMENTS
The authors would like to thank the Flemish agency
for Innovation by Science and Technology (IWT)
and the company ESSENSIUM NV for the funding.
Moreover, they thank E. Van Lil, P. A. J. Nuyts and
N. De Clercq for the interesting discussions.
REFERENCES
Abdzadeh-Ziabari, H. and G. Shayesteh, M. (2011). Robust
timing and frequency synchronization for OFDM sys-
tems. Vehicular Technology, IEEE Transactions on,
PP(99):1.
IEEE (2009). IEEE standard for information technology
- telecommunications and information exchange be-
tween systems - local and metropolitan area networks
- specific requirements. part 15.3: Wireless medium
access control (MAC) and physical layer (PHY) spec-
ifications for high rate wireless personal area net-
works (WPANs) amendment 2: Millimeter-wave-
based alternative physical layer extension. IEEE Std
802.15.3c-2009 (Amendment to IEEE Std 802.15.3-
2003), pages c1 –187.
K. Wang, M. Faulkner, J. S. and Tolochko, I. (2003). Tim-
ing synchronization for 802.11a WLANs under mul-
tipath channels. In Australasian Telecommunication
PECCS 2012 - International Conference on Pervasive and Embedded Computing and Communication Systems
276

Networks And Applications Conference 2003, ATNAC
2003.
Knapp, C. and Carter, G. (1976). The generalized correla-
tion method for estimation of time delay. Acoustics,
Speech and Signal Processing, IEEE Transactions on,
24(4):320 – 327.
Liu, C. and Li, F. (2004). Spectrum modelling of OFDM
signals for WLAN. Electronics Letters, 40(22):1431
– 1432.
Minn, H., Bhargava, V., and Letaief, K. (2003). A robust
timing and frequency synchronization for OFDM sys-
tems. Wireless Communications, IEEE Transactions
on, 2(4):822 – 839.
Moose, P. (1994). A technique for orthogonal frequency di-
vision multiplexing frequency offset correction. Com-
munications, IEEE Transactions on, 42(10):2908 –
2914.
Neri, A., Di Nepi, A., and Vegni, A. (2010). DOA and
TOA based localization services protocol in IEEE
802.11 networks. Wireless Personal Communications,
54:155–168. 10.1007/s11277-009-9719-y.
Pollet, T., Spruyt, P., and Moeneclaey, M. (1994). The BER
performance of ofdm systems using non-synchronized
sampling. In Global Telecommunications Confer-
ence, 1994. GLOBECOM ’94. Communications: The
Global Bridge., IEEE, pages 253 –257 vol.1.
Pollet, T., Van Bladel, M., and Moeneclaey, M. (1995).
BER sensitivity of OFDM systems to carrier fre-
quency offset and wiener phase noise. Communica-
tions, IEEE Transactions on, 43(234):191 –193.
Quazi, A. (1981). An overview on the time delay esti-
mate in active and passive systems for target localiza-
tion. Acoustics, Speech and Signal Processing, IEEE
Transactions on, 29(3):527 – 533.
Tufts, D. and Kumaresan, R. (1982). Estimation of frequen-
cies of multiple sinusoids: Making linear prediction
perform like maximum likelihood. Proceedings of the
IEEE, 70(9):975 – 989.
Winter, J. and Wengerter, C. (2000). High resolution es-
timation of the time of arrival for gsm location. In
Vehicular Technology Conference Proceedings, 2000.
VTC 2000-Spring Tokyo. 2000 IEEE 51st, volume 2,
pages 1343 –1347 vol.2.
Xu, H., Chong, C.-C., Guvenc, I., Watanabe, F., and Yang,
L. (2008). High-resolution TOA estimation with
multi-band OFDM UWB signals. In Communica-
tions, 2008. ICC ’08. IEEE International Conference
on, pages 4191 –4196.
HIGH RESOLUTION TIME-OF-ARRIVAL FOR A CM-PRECISE SUPER 10 METER 802.15.3C-BASED 60GHZ
OFDM POSITIONING APPLICATION
277
