
ENHANCING FPGA ROBUSTNESS
VIA GENERIC MONITORING IP CORES
Alexander Biedermann, Thorsten Piper, Lars Patzina, Sven Patzina,
Sorin A. Huss, Andy Sch
¨
urr and Neeraj Suri
CASED - Center for Advanced Security Research Darmstadt, Mornewegstraße 32, 64293 Darmstadt, Germany
Keywords:
System monitoring, Embedded HW/SW design, FPGA monitoring.
Abstract:
Today, state of the art technology allows a very dense integration of embedded HW/SW designs. As a conse-
quence, more errors are introduced in these circuits that have to be observed during run-time. Adding monitors
to a design enables the recognition of and the reaction to these threats, but, usually, monitors have to be devel-
oped for every individual FPGA design. Our approach provides generic IP cores that permit the monitoring
of arbitrary hardware modules. Furthermore, by providing a central monitoring module, statements about the
behaviour of the entire system can be made.
1 INTRODUCTION
Nowadays, embedded systems spread over nearly ev-
ery application domain. With advancement of tech-
nology the integration density of Integrated Circuits
(ICs) increases and with it, further sources of errors
are introduced. Such systems co-operating in net-
works as communicating control units or sensors are
exposed to threats from the outside world. These can
be the manipulation of sensors or injection of ma-
licious messages that can cause severe security and
safety risks. To reduce these, an appropriate tech-
nique as monitoring has to be applied to make specific
statements about the system behavior. Suitable moni-
tors can be realized as a wrapper around a single com-
ponent of the network or as separate instance in the
network. Often these communicating systems have
real-time constraints that do not allow high delays in-
troduced by a monitoring approach. Therefore, a re-
alization of these monitors completely in hardware or
in a combination of hardware and software is needed
to achieve required performance. Though, realizing
such monitoring functionalities in an FPGA design
needs the manual implementation of these observing
structures. The design and realization of such mon-
itors for different systems are time-consuming and
repetitive tasks. However, the structure of such mon-
itoring wrappers and components are very similar to
each other, which demands a generic solution.
Our contributions are:
• a framework for instrumenting arbitrary IP cores
with wrappers in an FPGA design
• a central monitoring core for more complex mon-
itoring functions that aggregates and coordinates
the wrappers
• a predefined repository for generic and predefined
monitoring functions
• possibility to extend the repository by self-
developed monitoring modules
Therefore, we extend the Embedded Development Kit
(EDK) developed by Xilinx, the market leader in re-
configurable logic, by generic monitoring IP cores.
The extensible toolbox includes predefined logical
monitoring blocks that can be tailored for special pro-
poses. These are used to add monitor functions to
existing or newly developed FPGA designs.
The remainder of this paper is organized as fol-
lows. In Section 2 we take a look at related work. Af-
terwards, in Section 3 we present the architecture of
our framework and show its applicability in a temper-
ature measurement scenario in Section 4. Section 5
concludes our approach.
2 RELATED WORK
Monitors are powerful and versatile tools to gain in-
sight on the internal states and signals of a system.
Monitors can furthermore be applied to ensure the
379
Biedermann A., Piper T., Patzina L., Patzina S., A. Huss S., Schürr A. and Suri N..
ENHANCING FPGA ROBUSTNESS VIA GENERIC MONITORING IP CORES.
DOI: 10.5220/0003353503790386
In Proceedings of the 1st International Conference on Pervasive and Embedded Computing and Communication Systems (PECCS-2011), pages
379-386
ISBN: 978-989-8425-48-5
Copyright
c
2011 SCITEPRESS (Science and Technology Publications, Lda.)

correct operation of a component or to detect and
react on faulty component behavior. Monitors are
widely applied in embedded systems, as there are
many areas of application throughout the lifecycle of
a product, ranging from design time to run-time. Dur-
ing design time, embedded monitors aid in debugging
and profiling a system or parts thereof, whereas at
run-time, they provide performance measures and en-
sure operability of the system.
Embedded logic analyzers (ELA) such as Xilinx’s
ChipScope Pro (Xilinx, 2010) or Altera’s SignalTap
II (Altera, 2010) are the simplest form of monitors in
terms of complexity. ELAs provide direct access to
internal signals of a system and, therefore, constitute
an essential tool during test and verification of a de-
sign, as only few components offer externally accessi-
ble interfaces. Their use is limited to scenarios where
the direct exposure of a signal path without further
processing is desired or sufficient.
Debugging tasks that require triggering on spe-
cific events or sequential patterns depend on a more
sophisticated monitoring solution than ELAs can pro-
vide. To allow for more complex scenarios, (Pentti-
nen et al., 2006) presents a method to monitor the in-
ternal signals of FPGA circuits by using an embedded
microprocessor as central monitoring instance. Their
setup is able to account for timing constraints and
does not suffer from slowdowns in case of many or
complex input patterns, like HDL simulators do.
Another approach is taken in (Cheng et al., 2010),
where the authors propose a run-time RTL debug-
ging methodology for FPGA-assisted co-simulation.
By instrumenting the design under test (DUT) with
a wrapper, parts of the design simulation are exe-
cuted transparently on an FPGA. Furthermore, their
approach provides internal node probing and, thus,
achieves full observability of the DUT.
Profiling and performance monitoring (PM)
(Sprunt, 2002) constitutes another application area of
hardware monitors. PM is commonly implemented
by performance event (PE) detectors and PE coun-
ters. PE detectors trigger on certain events, such
as distinct program characteristics, memory access,
pipeline stalls, branch predictions or resource utiliza-
tion and increment their corresponding PE counter.
The implementations of existing performance moni-
toring solutions such as (DeVille et al., 2005), (Lan-
caster et al., 2010) and (Tong and Khalid, 2008) are
often highly application dependent and offer no or
low reuseability. With the framework for generic
monitoring IP cores presented in this paper, the instru-
mentation of HW components with monitoring func-
tionality is highly automated. By using pre-defined
monitoring blocks from the frameworks’s library or
by extending the library with user-supplied blocks,
code reuse for common monitoring tasks is easily
achieved.
Based on similar considerations, the authors of
(Schulz et al., 2005) propose Owl, a framework
to pervasively deploy programmable monitoring ele-
ments throughout a system. Owl is built on the archi-
tectural principle of programmable capsules, which
are comparable to the wrapper notation of our ap-
proach, and analysis modules that provide function-
ality within the capsules. Programmable capsules are
realized as reconfigurable and programmable logic in
an FPGA and are used to integrate hardware moni-
tors at potential event sources. Although their frame-
work is suited for generic application scenarios, the
authors’ main focus is on profiling. They propose
memory access logging, memory access histograms
and dynamic pattern recognition and reduction as pos-
sible use cases. One of the major differences to
our approach is the absence of a central monitor-
ing core (CMC) that provides a facility to aggregate
systemwide monitoring events and to coordinate sys-
temwide reaction patterns during run-time.
Apart from implementing existing monitoring so-
lutions, our proposal aims at extending the area of
application of HW monitors in embedded systems.
As related work shows, HW monitors are tradition-
ally employed for tasks such as debugging, profiling
and performance measurement. In addition to this, we
aim to implement well-established software concepts
of the dependability, safety and security domains, es-
pecially those which are commonly implemented by
component wrappers. In this context, the proposed
framework can therefore be seen as first step to deliver
an enabling platform upon which further research and
experiments will be conducted.
Currently, we consider several future applica-
tion scenarios. The first one is to implement fault-
containment wrappers (Saridakis, 2003) for IP cores,
in order to limit a fault’s effect to the wrapped com-
ponent and prevent its propagation to other parts of
the system. We furthermore consider to use monitors
for the safe implementation of component isolation in
mixed-criticality designs (Pellizzoni et al., 2009) and
also investigate to provide monitors that offer reac-
tion triggers for reconfiguration in self-adaptive auto-
nomic systems (Santambrogio, 2009).
3 MONITORING
ARCHITECTURE
The approach presented in this paper delivers a frame-
work for automatic integration of monitoring func-
PECCS 2011 - International Conference on Pervasive and Embedded Computing and Communication Systems
380

IP Core IP Core
IP Core
Figure 1: An exemplary FPGA design.
IP Core IP Core
IP Core
Central Monitoring
Core
Wrapper Wrapper
Figure 2: The same design with Monitoring Modules inserted.
tionalities into existing HW/SW designs. A smooth
integration into the existing design flow for reconfig-
urable devices from Xilinx is provided. A simple ex-
emplary design consisting of three IP cores is shown
in figure 1. To add monitoring functionalities, prede-
fined monitoring functions from a repository can be
easily inserted into a design. Thus, monitoring of an
IP core of a system is achieved by wrapping a Mon-
itoring Module Wrapper (MMW) around it. Further-
more, a so-called Central Monitoring Core (CMC)
coordinates all connected Monitoring Module Wrap-
pers. It allows for coordinating all MMWs and for
monitoring the entire system, if every IP core in the
design is wrapped by a MMW. After adding these
monitoring components to the exemplary system, the
result can be seen in figure 2. MMWs and the CMC
communicate over a dedicated communication struc-
ture. The dedicated communication is displayed by
dashed lines in this figure. In the following, we de-
scribe the components of our monitoring framework.
3.1 Monitoring Interconnect Structure
All monitoring-related communication is independent
from the communication structure of the original sys-
tem. Therefore, besides delays caused by monitoring
functions, normal system communication of modules
is not affected by the monitoring functionalities. The
communication of the entire monitoring system re-
lies on the Fast Simplex Link (FSL) (Rosinger, 2004).
The FSL is well-suited for several reasons:
• It has a lightweight protocol with very fast data
handling: in each clock cycle, a data packet can
be sent.
• It supports asynchronous communication between
different clock regions.
• Besides many existing hardware modules, the
Microblaze processor provided by Xilinx sup-
ports FSL communication via 16 independent
FSL ports.
• It has a FIFO buffer of adjustable depth to catch
stalls caused, for example, by temporary bursts of
monitored data.
For demonstration purposes, we restricted ourselves
for now to monitor only modules, which also employ
FSL interfaces. It is possible to support other inter-
faces and bus standards.
3.2 Monitoring Module Wrapper
To observe the status of a module, a Monitoring Mod-
ule Wrapper (MMW) can be placed around a module.
Such a wrapper for a simple IP core with two inputs,
i and j, and two outputs, o and p, is depicted in figure
3. Each of the inputs and outputs of a module can be
selected to be monitored by the MMW. Ports which
are not monitored are left untouched. Monitored ports
are fed into the input switch of the MMW. For exam-
ple, in figure 3, input i and its adjacent output p are
monitored. The Monitoring Module Wrapper allows
to monitor and evaluate an output port or relations be-
tween input and output ports of modules. For the last
of these options, the input switch waits as long as the
output delivered from the monitored IP core matches
its corresponding input. Until then, the correspond-
ing input is buffered in the input switch. However, to
match a value from an input with its corresponding
value on an output port, the designer has to denote
the processing time of the IP core in the configura-
tion of the input switch. In further research, the time
needed to buffer an input will be calculated automat-
ically if a constant processing time is assumed. The
monitored values are now sent to the processing stage
of the wrapper as well as to the Central Monitoring
Core which is explained in Section 3.3. The process-
ing stage contains monitoring functions, which an-
alyze the monitored ports. Monitoring functions in
ENHANCING FPGA ROBUSTNESS VIA GENERIC MONITORING IP CORES
381

IP Core
i
j
o
p
Monitoring Function 1
Monitoring Function 2
...
Monitoring Function n
to Monitoring Core from and to Monitoring Core
Reactor
Ouput
stage
Input Switch
Monitoring Wrapper
Figure 3: An IP-Core wrapped by the Monitoring Module Wrapper. Input j and output p are monitored. Synchronization
between these ports is handled in the Input Switch.
the MMW are intended to quickly deliver statements
about the monitored values. For example, a moni-
toring function may evaluate, if monitored values are
within a predefined range of values. Several of such
predefined and configurable monitoring functions are
held ready in a repository as VHDL-written modules.
The designer may chose, which monitoring functions
he wants to add to the current wrapper. This is done
by editing a configuration file. If a malfunction or de-
viation of a module is detected by a monitoring func-
tion, the monitored output port may be altered by the
reactor within the MMW. The designer may config-
ure the reactor of the MMW to define which monitor-
ing function is prioritized, if more than one of them
detects a malfunction or deviation. If and in which
way an output will be altered is defined in the corre-
sponding monitoring function. In some cases of de-
tected erroneous behavior, it may be appropriate to
send a predefined default value instead of leaving the
wrong data untouched. Furthermore, rather than al-
tering an output value, an error message may be sent
to the CMC via the Reactor.
3.3 Central Monitoring Core
The Central Monitoring Core is a configurable IP core
of our monitoring framework designed to evaluate the
state of a group of monitored modules or of the entire
system. By aggregating information gathered by the
independent MMWs, the CMCs is able to combine
these data to make statements about the system’s sta-
tus. Reactions to deviations may be triggered by the
CMC and may be sent to the corresponding MMWs.
Furthermore, the Central Monitoring Core is intended
to run more complex monitoring functions than in
MMWs. Mainly, if several monitored values from
the past have to be evaluated, a monitoring function
within the MMW is not well-suited, since they are in-
tended to deliver statements quickly. Therefore, Each
MMW is automatically connected to the CMC, de-
livering a set of inputs and outputs of the monitored
module that have to be monitored. The designer can
define in each MMW, which ports he wants to moni-
tor in the CMC. As for the MMW, the designer may
choose, which monitoring functions are included into
the CMC. In contrast to the MMW, monitoring func-
tions in the CMC may use inputs and outputs from
more than one monitored module. As a consequence,
statements about a group of modules or even the en-
tire system are possible. The CMC consists of con-
figurable central monitoring functions, a switch inter-
face, a log file memory block and an optional soft core
processor. A CMC is depicted in figure 4.
Communication Switch
Central Monitoring Function 1
Central Monitoring Function 2
...
Central Monitoring Function n
Microblaze Processor
Log RAM
... ...
...
Data from and to Monitoring Module Wrappers
Figure 4: The Central Monitoring Core and its connections
to the MMWs.
3.3.1 Switch Interface
The CMC communicates with the MMWs via FSL
interfaces. A switching module coordinates commu-
nication between wrapped modules and the CMC’s
monitoring functions. The designer may configure,
which inputs and outputs of the wrapped module are
sent to the central monitoring functions added into
PECCS 2011 - International Conference on Pervasive and Embedded Computing and Communication Systems
382

the CMC. If a monitoring function of the CMC trig-
gers an output manipulation for a monitored port, the
intended value is sent via FSL to the reactor of the
corresponding wrapped module. Output manipula-
tions triggered by the CMC are intended to correct
long-term deviations of a module. Here, non-blocking
writes are used to send altered output data from the
CMC to the output switch of a wrapper. Since mon-
itoring functions in the CMC may take a longer time
to deliver results, the output switch of the MMW is,
therefore, not blocked by waiting for results from the
CMC.
3.3.2 Log File Memory Block
Since some central monitoring functions might need
monitored data, which were captured in the past, a
dedicated memory saves monitored values. For each
central monitoring function in the CMC, the designer
may adjust, if and when monitored values have to be
stored in the log file memory block. Therefore, the
size of the log file memory block is adjustable. Cen-
tral monitoring functions, as well as the optional Mi-
croblaze soft core processor, access the log file mem-
ory via the communication switch. For the log file
memory block, the on-board BlockRAM of an FPGA
is used.
3.3.3 Microblaze Soft Core Processor
Writing combinatorial monitoring functions in VHDL
often delivers fast results. However, especially in
complex monitoring scenarios, the use of a high-level
programming language is desirable to describe mon-
itoring functions. Therefore, within the CMC, an
optional, C-programmable Microblaze soft core pro-
cessor is available. The designer may either imple-
ment several monitoring functions by himself or use
some of the predefined C-written monitoring func-
tions available in a repository. As for VHDL-written
monitoring functions, the Microblaze uses FSL as
communication interface for monitored values. For
each port of a wrapped module that has to be evalu-
ated using the Microblaze, a dedicated FSL connec-
tion is connected between the communication switch
and the Microblaze. The communication switch sends
the values from monitored module ports to the corre-
sponding FSL ports of the Microblaze. Up to 16 in-
dependent ports may be evaluated on a Microblaze.
3.4 Integration into the Xilinx Design
Flow
In our approach, we provide a smooth integration into
the Xilinx design flow. Our framework is aimed at
being used in combination with the Xilinx Embedded
Delevopmenet Kit (EDK). The EDK is mainly used to
create reconfigurable HW/SW designs by instantiat-
ing and connecting IP cores. To add monitoring func-
tionalities into the design, the designer has to config-
ure a script file written in Python. It defines, which ex-
isting modules of an EDK design have to be wrapped
and which monitoring functions will be added to the
MMWs and the CMC. In Section 4, we show for an
exemplary design, how the script is configured to add
monitoring functionalities. By executing this script,
the configured Monitoring Module Wrappers are then
wrapped around the selected IP cores. As a result, in
Xilinx EDK, the modules are replaced by a wrapped
instance of themselves. Figure 5 shows a wrapped
module with automatically created connections to the
CMC. Note that the IP type – marked by a red bor-
der on both figures – of a wrapped IP core changes to
”hw2mon”. The module’s connection to its environ-
ment persists. Additionally, connections to the Cen-
tral Monitoring Core and the Core itself are automat-
ically created. Then, the normal design flow, such as
bitstream generation may be executed.
4 EVALUATION
AND DISCUSSION
To demonstrate the integration of our generic mon-
itoring approach into existing designs, we imple-
mented a simple temperature sensor station. The de-
sign which will result from the following process is
shown in figure 6. Three independent sensors based
on thermistors deliver values of resistance. In three
VHDL-written hardware modules on an FPGA, these
raw values are normalized based on the thermistors’
characteristics. Output of these modules are dis-
crete temperature values. Afterwards, these values
are then sent to a Microblaze soft core processor via
FSL connections. It visualizes the current tempera-
ture data as well as the average of the three sensors
on a display. We now want to monitor the normal-
izing modules to detect possibly abnormal temper-
ature values. Therefore, we add Monitoring Mod-
ule Wrappers around the normalizing VHDL mod-
ules by configuring and executing a Python script.
Such an exemplary configuration is shown in figure
1. In the configuration file, we define to wrap the IP
core normalizingModule which converts raw values
into temeprature values. Thus, two existing monitor-
ing functions, mmw
value range, and mmw threshold
are inserted. They test, if the monitored port deliv-
ers data which are within a range of values or lie be-
low a defined threshold. These values are passed via
ENHANCING FPGA ROBUSTNESS VIA GENERIC MONITORING IP CORES
383
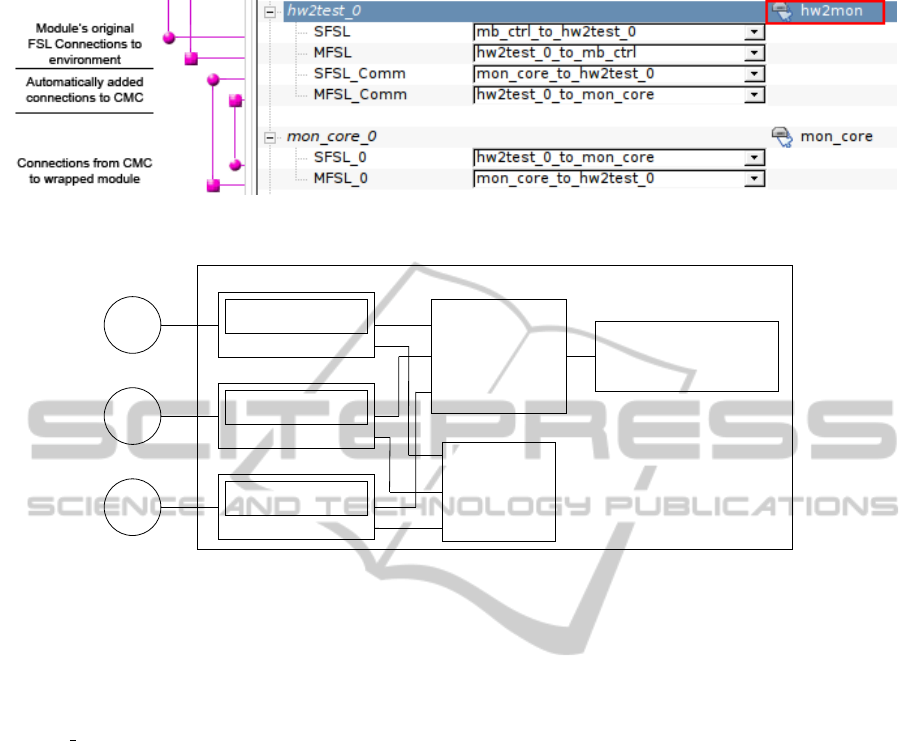
Figure 5: The EDK showing a wrapped IP core with automatically created connections to the automatically added CMC.
Normalizing Module
MMW
Normalizing Module
MMW
Normalizing Module
MMW
Microblaze Processor
CMC
Sensor1: 22.8
◦
C
Sensor2: 23.1
◦
C
Sensor3: 58.2
◦
C
Sensor
Sensor
Sensor
Figure 6: An FPGA design with three temperature sensors, three mapped normalizing modules, a Microblaze with an attached
display, and the CMC.
generics into the monitoring functions. In the con-
figuration file, these monitoring functions are then
bound to the corresponding port. Furthermore, the
CMC is configured to include the monitoring func-
tion cmc tendency. It monitors, if the tendency of the
monitored data changes, e.g. if the monitored tem-
perature data fall after a period of rising. At last, a
Microblaze is added and connected to the wrapped
module. Further monitoring functions written in C
can be added to the Microblaze.
After executing the Python script, the EDK has
all of the configured monitoring functionalities in-
serted. For each MMW around the normalizing mod-
ules, monitoring a pair of input and output values con-
sumes 106 LUTs and 208 slice registers on a Virtex-5
FPGA. Resource consumption of the CMC without
monitoring functions added, and without the optional
Microblaze added is 86 LUTs and 69 Registers. A
Microblaze, if used within the CMC, consumes 916
LUTs and 583 Registers. For each central monitor-
ing function added and for each MMW connected to
the CMC, the resource consumption will rise. On the
one hand, this is due to the resource consumption of
the central monitoring functions. On the other hand,
this is due to the generic structure of the communi-
cation switch of the CMC. Its complexity rises with
each new monitoring module that has to be connected
to the CMC.
As seen in figure 3, the input and output switches
as well as the monitoring functionalities add a delay to
monitored ports. Therefore, our approach might not
be suited for systems with harsh timing constraints.
In this case, the constant delay caused by the MMW
might be considered by the designer of an IP core in
advance. However, is possible to eliminate the de-
lay caused by the monitoring functionalities: Here,
monitored output ports are forked. One branch is im-
mediately sent out of the module. The other branch
is fed into the input switch of the MMW. Indeed, cor-
recting a detected deviation would not be possible any
more, since the anomalous value was already sent to
its adjacent modules via the first branch. We are cur-
rently analyzing, in which cases and scenarios the de-
lay caused by our Monitoring Module Wrapper is a
reasonable price to pay to gain the ability to alter out-
put values. As said in Section 3.1, we restrict our-
selves to monitor modules, which communicate via
FSL. By using the blocking read and write structure
of the FSL interface for modules we attenuate the neg-
ative side effects caused by delays, because modules
adjacent to the monitored module will wait as long as
the observed output is available.
PECCS 2011 - International Conference on Pervasive and Embedded Computing and Communication Systems
384

Listing 1: Configuration script to add monitoring functionality to an existing design.
## M o n i t o r i n g C o n f i g u r a t i o n F i l e .
# p r o j e c t p a t h
p r o j e c t : . . / s e n s o r s t a t i o n /
#Name o f e n t i t y and o f f i l e o f t h e VHDL−m odule wh i c h has t o be wrapped
[ n o r m a l i z i n g M o d u l e ]
# name o f t h e p c o re −m odule a f t e r wr a p pi n g
o u t p u t : n o r m a l i z i n g M o d u l e m o n i t o r e d
# c o r r e s p o n d i n g VHDL f i l e
f i l e : n o r m a l i z i n g M o d u l e . vhd
# A u t o m a t i c a l l y r e p l a c e mo d ule w i t h MMW−wrapped i n s t a n c e
# i f f a l s e , t h e new m o n i t o r e d mo d ule ca n be a dded m a n u a l l y i n t o t h e d e s i g n
r e p l a c e : t r u e
# M i c r o p r o c e s s o r P e r i p h e r a l D e f i n i t i o n / P e r i p h e r a l A n a l y z e Or der F i l e ne e de d by EDK
# ( f o u n d a u t o m a t i c a l l y i f p r o j e c t p a t h i s g i v e n )
mpd : n o r m a l i z i n g M o d u l e / d a t a / n o r m a l i z i n g M o d u l e v 2 1 0 . mpd
pao : n o r m a l i z i n g M o d u l e / d a t a / n o r m a l i z i n g M o d u l e v 2 1 0 . pao
# P o r t s o f wrapped m o dule t o m o n i t o r by MMW
# f o r m a t : <p o r t > p o r t I D < d i r e c t i o n >
p o r t 0 o u t : t e m p o u t
# M o n i t o r i n g F u n c t i o n s t o add
# f o r m a t : <m o n i to r > p o r t I D m o n i t o r I D [ ge n e r i c 1 , g e n e r i c 2 , . . . ]
m o n i t o r 0 0 : mmw value r a n g e −20 ,40
m o n i t o r 0 1 : mmw t h r e s hold 50
## C e n t r a l M o n i t o r i n g Core C o n f i g u r a t i o n F i l e
[ c o r e ]
# which CMC M o n i t o r F u n c t i o n s t o i n c l u d e
m o n i t o r 0 : c m c t e n d e n c y
# b i n d each CMC M o n i t o r i n g F u n c t i o n t o one or s e v e r a l MMWs
c m c t e n d e n c y 0 : n o r m a l i z i n g M o d u l e
# a s s i g n a m i c r o b l a z e t o t h e c o r e
m i c r o b l a z e n a m e : cmc mb
# comma s e p a r a t e d l i s t o f wrapped mo du l e s which w i l l be c o n n e c t e d t o t h e m i c r o b l a z e
m i c r o b l a z e e n t i t i e s : n o r m a l i z i n g M o d u l e
5 CONCLUSIONS
In this paper, a novel design method to add moni-
toring functionality to HW/SW designs is presented.
Monitoring functionality can be easily added by au-
tomatically wrapping modules and by choosing suit-
able monitoring functions from a repository. A Cen-
tral Monitoring Core coordinates monitored modules
and is able to make statements about the entire sys-
tem’s status. Complex monitoring functions can be
implemented in C via the Microblaze soft core pro-
cessor optionally included in the Central Monitoring
Core. Since the monitoring system uses a commu-
nication structure independent of the communication
structure of the original system, the monitoring sys-
tem smoothly integrates into existing designs. Apart
from a delay caused by the evaluation of the moni-
toring functions in the wrappers, the system’s com-
munication is not affected. The application scenario
in 4 shows that our approach is suitable to be used in
existing HW/SW systems. Resource consumption de-
pends on the amount of Module Wrappers employed,
the confiugration of the CMC with or without Microb-
laze and the number of Monitoring Functions added.
Further research includes the use of the monitoring
system in distributed environments. There, several
interconnected embedded systems are monitored by
independent monitoring systems. The Central Moni-
ENHANCING FPGA ROBUSTNESS VIA GENERIC MONITORING IP CORES
385

toring Cores of these systems may then communicate
with each other. As a result, not only the status of a
single system, but the status of an entire network of
embedded systems can be gained. Possible fields of
application are distributed sensor networks as well as
security-related sensor systems.
ACKNOWLEDGEMENTS
This work was supported by CASED
(http://www.cased.de).
REFERENCES
Altera (2010). Design Debugging Using the SignalTap II
Logic Analyzer.
Cheng, X., Ruan, A., Liao, Y., Li, P., and Huang, H. (2010).
A run-time rtl debugging methodology for fpga-based
co-simulation. In Communications, Circuits and Sys-
tems (ICCCAS), 2010 International Conference on,
pages 891 –895.
DeVille, R., Troxel, I., and George, A. (2005). Perfor-
mance monitoring for run-time management of recon-
figurable devices. Engineering of Reconfigurable Sys-
tems and Algorithms (ERSA).
Lancaster, J., Buhler, J., and Chamberlain, R. (2010). Ef-
ficient runtime performance monitoring of FPGA-
based applications. In SOC Conference, 2009. SOCC
2009. IEEE International, pages 23–28. IEEE.
Pellizzoni, R., Meredith, P., Nam, M., Sun, M., Caccamo,
M., and Sha, L. (2009). Handling mixed-criticality in
soc-based real-time embedded systems. In Proceed-
ings of the seventh ACM international conference on
Embedded software, pages 235–244. ACM.
Penttinen, A., Jastrzebski, R., Pollanen, R., and Pyrhonen,
O. (2006). Run-Time Debugging and Monitoring of
FPGA Circuits Using Embedded Microprocessor. In
IEEE Design and Diagnostics of Electronic Circuits
and systems, pages 147 –148.
Rosinger, H. (2004). Connecting customized IP to the Mi-
croBlaze soft processor using the Fast Simplex Link
(FSL) channel. Xilinx Application Note.
Santambrogio, M. (2009). From Reconfigurable Architec-
tures to Self-Adaptive Autonomic Systems. In Inter-
national Conference on Computational Science and
Engineering, pages 926–931. IEEE.
Saridakis, T. (2003). Design patterns for fault contain-
ment. In The 8th European Conference on Pattern
Languages of Programs (EuroPLoP 2003), Germany.
Schulz, M., White, B. S., McKee, S. A., Lee, H.-H. S., and
Jeitner, J. (2005). Owl: next generation system moni-
toring. In CF ’05: Proceedings of the 2nd conference
on Computing frontiers, pages 116–124, New York,
NY, USA. ACM.
Sprunt, B. (2002). The basics of performance-monitoring
hardware. IEEE Micro, 22(4):64–71.
Tong, J. and Khalid, M. (2008). Profiling Tools for FPGA-
Based Embedded Systems: Survey and Quantitative
Comparison. Journal of Computers, 3(6):1.
Xilinx (2010). ChipScope Pro 12.3 Software and Cores -
User Guide.
PECCS 2011 - International Conference on Pervasive and Embedded Computing and Communication Systems
386
