
AUTOMATIC SPATIAL PLAUSIBILITY CHECKS
FOR MEDICAL OBJECT RECOGNITION RESULTS
USING A SPATIO-ANATOMICAL ONTOLOGY
Manuel M
¨
oller, Patrick Ernst, Andreas Dengel
German Research Center for Artificial Intelligence (DFKI) and University of Kaiserslautern, Kaiserslautern, Germany
Daniel Sonntag
German Research Center for Artificial Intelligence (DFKI), Saarbrcken, Germany
Keywords:
Medical imaging, Semantic technologies, Spatial reasoning, Formal ontologies.
Abstract:
We present an approach to use medical expert knowledge represented in formal ontologies to check the results
of automatic medical object recognition algorithms for spatial plausibility. Our system is based on the com-
prehensive Foundation Model of Anatomy ontology which we extend with spatial relations between a number
of anatomical entities. These relations are learned inductively from an annotated corpus of 3D volume data
sets. The induction process is split into two parts: First, we generate a quantitative anatomical atlas using
fuzzy sets to represent inherent imprecision. From this atlas we abstract onto a purely symbolic level to gen-
erate a generic qualitative model of the spatial relations in human anatomy. In our evaluation we describe how
this model can be used to check the results of a state-of-the-art medical object recognition system for 3D CT
volume data sets for spatial plausibility. Our results show that the combination of medical domain knowledge
in formal ontologies and sub-symbolic object recognition yields improved overall recognition precision.
1 INTRODUCTION
During the last decades a lot of effort went into the de-
velopment of automatic object recognition techniques
for medical images. Today there is a huge variety
of algorithms available solving this task very well.
The precision and sophistication of the different im-
age parsing techniques have improved a lot to cope
with the increasing complexity of medical imaging
data. There are numerous advanced object recogni-
tion algorithms for the detection of particular objects
on medical images. However, the results of the dif-
ferent algorithms are neither stored in a common for-
mat nor extensively integrated with patient and image
metadata.
At the same time the biomedical informatics com-
munity managed to represent huge parts of medical
domain knowledge in formal ontologies. Today, com-
prehensive ontologies cover large parts of the avail-
able taxonomical as well as mereological (part-of)
knowledge of human anatomy.
With the shift to the application of digital imaging
techniques for medical diagnosis, such as CT, MRI,
etc., the volume of digital images produced in modern
clinics increased tremendously. Our clinical partner,
the University Hospital Erlangen, Germany, has a to-
tal of about 50 TB of medical images. Currently they
have about 150,000 medical examinations producing
13 TB data per year.
To cope with this data increase (semi-)automatic
image segmentation and understanding techniques
from computer vision are applied to ease the task
of radiological personnel during image assessment
and annotation. However, these systems are usually
based on statistical algorithms. Thus, detection and
localization of anatomical structures can only be per-
formed with limited precision or recall and conse-
quently remain with a certain number of incorrect re-
sults.
Our approach is to augment medical domain on-
tologies and to allow for an automatic detection
of anatomically implausible constellations in the re-
sults of a state-of-the-art system for automatic object
recognition in 3D CT scans. The output of our system
5
Möller M., Ernst P., Dengel A. and Sonntag D..
AUTOMATIC SPATIAL PLAUSIBILITY CHECKS FOR MEDICAL OBJECT RECOGNITION RESULTS USING A SPATIO-ANATOMICAL ONTOLOGY.
DOI: 10.5220/0003058600050013
In Proceedings of the International Conference on Knowledge Discovery and Information Retrieval (KDIR-2010), pages 5-13
ISBN: 978-989-8425-28-7
Copyright
c
2010 SCITEPRESS (Science and Technology Publications, Lda.)

also provides feedback which anatomical entities are
most likely to have been located incorrectly. The nec-
essary spatio-anatomical knowledge is learned from a
large corpus of annotated medical image volume data
sets. The spatial knowledge is condensed into a dig-
ital anatomical atlas using fuzzy sets to represent the
inherent variability of human anatomy.
Our main contributions are (1) the inductive learn-
ing of a spatial atlas of human anatomy, (2) its repre-
sentation as an extension of an existing biomedical
ontology, and (3) an application of this knowledge in
an automatic semantic image annotation framework
to check the spatio-anatomical plausibility of the re-
sults of medical object recognition algorithms. Our
approach fuses a statistical object recognition and rea-
soning based on a formal ontology into a generic sys-
tem. In our evaluation we show that the combined
system is able to rule out a incorrect detector results
with a precision of 85.6% and a recall of 65.5% and
can contribute to improve the overall performance of
the object recognition system.
2 RELATED WORK
As the primary source of medical domain knowledge
we use the Foundational Model of Anatomy (FMA)
(Rosse and Mejino, 2007), the most comprehensive
formal ontology of human anatomy available. How-
ever, the number of spatial relations in the FMA is
very limited and covers only selected body systems
(M
¨
oller et al., 2009). Thus, our approach is to infer
additional spatial relations between the concepts de-
fined in the FMA by learning from annotated medical
volume data sets.
In (da Luz et al., 2006) the authors describe a
hybrid approach which also uses metadata extracted
from the medical image headers in combination with
low-level image features. However, their aim is to
speed up content-based image retrieval by restricting
the search space by leveraging metadata information.
The approach in (Hudelot et al., 2008) is comple-
mentary to our work in so far as the authors also pro-
pose to add spatial relations to an existing anatomical
ontology. Their use-case is the automatic recognition
of brain structures in 3D MRI scans. However, they
generate the spatial relations manually while a major
aspect of our approach is the automatic learning from
a large corpus.
Quantitative spatial models are the foundation of
digital anatomical atlases. Fuzzy logic has been
proven as an appropriate formalism which allows
quantitative representations of spatial models (Bloch,
2005). In (Krishnapuram et al., 1993) the authors ex-
pressed spatial features and relations of object regions
using fuzzy logic. In (Bloch and Ralescu, 2003) and
(Bloch, 1999b) Bloch et al. describe generalizations
of this approach and compare different options to ex-
press relative positions and distances between 3D ob-
jects with fuzzy logic.
3 SYSTEM ARCHITECTURE
Figure 1 shows an abstraction of the distributed sys-
tem architecture. It is roughly organized in the order
of the data processing horizontally from left to right.
All parsing results are stored in a custom-tailored spa-
tial database.
Medical
Ontologies
SpatialReasoning
QualitativeAnatomicalModel
Image
Image Medico Spatial
QuantitativeAnatomicalAtlas
Corpus
Parser Server Database
Figure 1: System architecture overview.
3.1 Image Parser
To represent the results of the automatic object recog-
nition algorithms in the format of our ontology we had
to integrate rather disparate techniques into a hybrid
system. The automatic object recognition performs
an abstraction process from simple low-level features
to concepts represented in the Foundational Model of
Anatomy (FMA) (Rosse and Mejino, 2007), the on-
tology we use as our primary source of anatomical
domain knowledge.
For automatic object recognition we use a state-
of-the-art anatomical landmark detection system de-
scribed in (Seifert et al., 2010). It uses a network of
1D and 3D landmarks and is trained to quickly parse
3D CT volume data sets and estimate which organs
and landmarks are present as well as their most prob-
able locations and boundaries. Using this approach,
the segmentation of seven organs and detection of 19
body landmarks can be obtained in about 20 seconds
with state-of-the-art accuracy below 3 mm mean mesh
error and has been validated on 80 CT full or partial
body scans (Seifert et al., 2010).
The image parsing algorithm generates two funda-
mentally different output formats: Point3D for land-
marks and Mesh for organs. Apart from their geomet-
ric features they always point to a certain anatomical
KDIR 2010 - International Conference on Knowledge Discovery and Information Retrieval
6

concept which is hard-wired to the model that the de-
tection/segmentation algorithm has used to generate
them. A landmark is a point in 3D without spatial
extension. Usually they represent extremal points of
anatomical entities with a spatial extension. In some
cases these extremal points are not part of the official
FMA. In these cases we modeled the respective con-
cepts as described in (M
¨
oller et al., 2009). In total we
were able to detect 22 different landmarks from the
trunk of the human body. Examples are the bottom
tip of the sternum, the tip of the coccyx, or the top
point of the liver.
Organs, on the contrary, are approximated by
polyhedral surfaces. Such a surface, short mesh, is
a collection of vertices, edges, and faces defining the
shape of the object in 3D. For the case of the uri-
nary bladder, the organ segmentation algorithm uses
the prototype of a mesh with 506 vertices which are
then fitted to the organ surface of the current patient.
Usually, vertices are used for more than one triangle.
Here, these 506 vertices form 3,024 triangles. In con-
trast to the Point3D data, meshes are used to segment
organs. For our test, the following organs were avail-
able: left/right kidney, left/right lung, bladder, and
prostate.
3.2 Medico Server
Fig. 1 shows the overall architecture of our approach
for integrating manual and automatic image annota-
tion. One of the main challenges was to combine the
C++ code for volume parsing with the Java-based li-
braries and applications for handling data in Seman-
tic Web formats. We came up with a distributed ar-
chitecture with the MedicoServer acting as a middle-
ware between the C++ and Java components using
CORBA (Object Management Group, 2004).
3.3 Spatial Database
As we have seen in the section about the image pars-
ing algorithms, the automatic object recognition al-
gorithms generate several thousand points per volume
data set. Storage and efficient retrieval of this data for
further processing made a spatial database manage-
ment system necessary. Our review of available open-
source databases with support for spatial data types
revealed that most of them now also have support
for 3D coordinates. However, the built-in operations
ignore the third dimension and thus yield incorrect
results, e. g., for distance calculations between two
points in 3D. Eventually we decided to implement
a light-weight spatial database supporting the design
rationales of simplicity and scalability for large num-
bers of spatial entities.
4 CORPUS
The volume data sets of our image corpus were se-
lected primarily by the first use-case of MEDICO
which is support for lymphoma diagnosis. The se-
lected data sets were picked randomly from a list of
all available studies in the medical image reposito-
ries of the University Hospital in Erlangen, Germany.
The selection process was performed by radiologists
at the clinic. All images were available in the Digital
Imaging and Communications in Medicine (DICOM)
format, a world wide established format for storage
and exchange of medical images (Mildenberger et al.,
2002).
Table 1: Summary of corpus features.
volume data available in total 777 GB
number of distinct patients 377
volumes (total) 6,611
volumes (modality CT) 5,180
volumes (parseable) 3,604
volumes (w/o duplicates) 2,924
landmarks 37,180
organs 7,031
Table 1 summarizes major quantitative features
of the available corpus. Out of 6,611 volume data
sets in total only 5,180 belonged to the modality CT
which is the only one currently processible by our
volume parser. Out of these, the number of volumes
in which at least one anatomical entity was detected
by the parser was 3,604. This results from the ratio-
nale of the parser which was in favor of precision and
against recall. In our subsequent analysis we found
that our corpus contained several DICOM volume data
sets with identical Series ID. The most likely reason
for this is that an error occurred during the data export
from the clinical image archive to the directory struc-
ture we used to store the image corpus. To guaran-
tee for consistent spatial entity locations, we decided
to delete all detector results for duplicate identifiers.
This further reduced the number of available volume
data sets to 2,924.
AUTOMATIC SPATIAL PLAUSIBILITY CHECKS FOR MEDICAL OBJECT RECOGNITION RESULTS USING A
SPATIO-ANATOMICAL ONTOLOGY
7
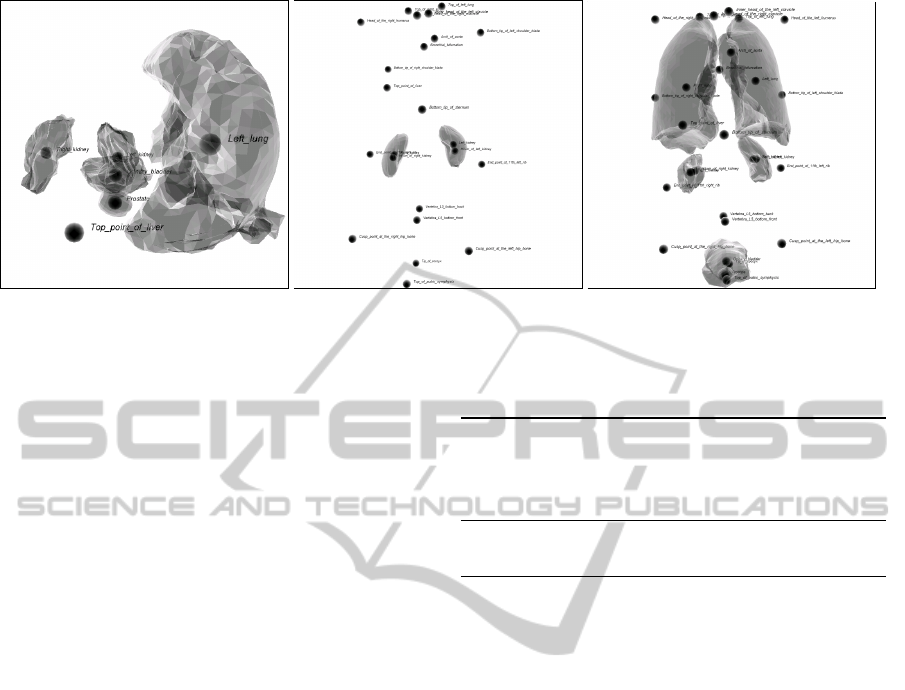
(a) (b) (c)
Figure 2: Visualizations of detector results: (a) incorrect; (b) sufficient; (c) perfect.
Controlled Corpus
Due to the statistical nature of the object detection al-
gorithm used for annotating the volume data sets we
have to assume that we have to deal with partially in-
correct results. Hence, we decided to conduct man-
ual corpus inspections using a 3D detect result visu-
alization. The goal was to identify a reasonable set of
controlled training examples suitable for generation
and evaluation of a quantitative anatomical atlas and
a qualitative model. These manual inspections turned
out to be very time consuming. For each volume in
the corpus a 3D visualization had to be generated and
manually navigated to verify the correct location of
landmarks and organ meshes. After some training we
were able to process approximately 100 volume data
sets per hour. For higher accuracy, all manual inspec-
tion results were double checked by a second person
resulting in a bisection of the per-head processing rate
to about 50 per hour.
During our inspection we found that the quality of
the detector results exhibits a high variability. Subse-
quently, we distinguish three quality classes: clearly
incorrect, sufficiently correct, and perfectly correct.
The visualizations in Figure 2 show one example for
each class.
To have a solid basis for the generation of the
spatio-anatomical model we decided to label a rea-
sonable subset of the available volume data sets man-
ually. This work was done by the author with the help
of two students. We ended up with more than 1,000
manually labeled volume data sets. Table 2 summa-
rizes the results quantitatively. All quantitative eval-
uations of the performance of the spatial consistency
check are based on this corpus.
We consider a detector result as incorrect if a
spatial entity configuration has been detected that is
clearly contradictory to human anatomy. Figure 2 (a)
Table 2: Summary of the manual corpus inspection.
detector results inspected in total 1,119
apparently incorrect volume data sets 482 (43%)
sufficiently correct detector results 388 (34%)
perfect detector results 147 (13%)
volumes containing meshes 946 (85%)
volumes containing landmarks 662 (59%)
shows such an example with arbitrarily deformed
lungs. Normally, the lungs should be located verti-
cally at about the same level. Here, this is not the
case. Additionally, the prostate has been located on
the top right side of the right lung while it belongs to
a completely different body region.
A detector result is considered as sufficiently cor-
rect if it contains a reasonable number of landmarks
and/or meshes. The following flaws distinguish them
from perfect detector results (at least one condition
is met): (i) It contains either only landmarks or only
meshes. (ii) A minor number of anatomical entities
has been detected at slightly incorrect positions. (iii)
The overall number of detected anatomical entities in
the detector result is rather low.
A perfectly correct detector result has to contain
both landmarks and meshes. In addition, none of the
landmarks or meshes is allowed to be located incor-
rectly. The anatomical atlas is learned only from de-
tector results labeled as either sufficiently or perfectly
correct. Incorrect detector results are discarded dur-
ing model generation.
KDIR 2010 - International Conference on Knowledge Discovery and Information Retrieval
8

5 QUANTITATIVE ANATOMICAL
ATLAS
Based on the spatial entities in the corpus we distin-
guish between two different types of relations to build
up a quantitative atlas, namely: 1. elementary rela-
tions directly extracted from 3D data and represented
as fuzzy sets, and 2. derived relations which are de-
fined using fuzzy logic and based on one or more ele-
mentary relation.
5.1 Elementary Relations
5.1.1 Orientation
The orientation or relative position of objects to each
other is important information to describe spatial co-
herencies. Typically, the fuzzy representation of the
orientation depends on two angles used to rotate two
objects on one another (Bloch, 1999a). The fuzzy set
is thereby defined using six linguistic variables spec-
ifying the general relative positions: above, below,
left, right, in front of, and behind. Their membership
functions are basically the same.
µ
rel
(α
1
, α
2
) =
(
cos
2
(α
1
)cos
2
(α
2
) if α
1,2
∈
−
π
2
,
π
2
0 otherwise
They only vary in a direction angle denoting the ref-
erence direction, e. g., for left the angle is π.
µ
le f t
(α
1
, α
2
) = µ
rel
(α
1
− π, α
2
)
More details about this approach can be found in
(Bloch, 1999a). The definition of complex objects’
relative positions is not straight forward. One possi-
bility is to use centroids. Mirtich et al. describe a fast
procedure for the computation of centroids (Mirtich,
2005). However, complex objects are reduced to sin-
gle points and therefore information is lost. As the au-
thors of (Berretti and Bimbo, 2006) state: “This still
limits the capability to distinguish perceptually dis-
similar configurations”. For this reason we decided
to use 3D angle histograms providing a richer quanti-
tative representation for the orientation. A histogram
H
R
A
stores the relative number of all angles between
a reference object R and a target A. The degree of
membership is then obtained by computing the fuzzy
compatibility between H
R
A
and a particular directional
relation µ
rel
. Thus, we achieve a compatibility fuzzy
set describing the membership degree.
µ
CP(µ
rel
,H)
(u) =
0 if H
R
A
−1
(α
1
, α
2
) = 0
sup
(α
1
,α
2
),u=H
R
A
(α
1
,α
2
)
µ
rel
(α
1
, α
2
) ⊥
To compute a single value the center of gravity of
µ
CP(µ
rel
,H)
is determined by
µ
R
rel
(A) =
1
R
0
uµ
CP(µ
rel
,H)
(u)du
1
R
0
µ
CP(µ
rel
,H)
(u)du
Using this approach the orientation relations are now
depending on the entire shape of the spatial entities.
In addition, these histograms capture distance infor-
mation. For example, if one object is moved nearer or
farer to another one, the angles will also change ac-
cording to the distance. Unfortunately, the member-
ship degree computation is more complex compared
to using centroids. Although, since we are relying
exclusively on the surface points of meshes, the com-
putation time is acceptable with an average of 33 sec-
onds for an entire volume.
5.1.2 Intersection
The detection of organ borders is a very difficult task
in medical image understanding, because it is mainly
based on the tissue density (Bankman, 2000). How-
ever, adjacent organs can have very similar densities.
Thus, detection is sometimes error-prone and objects
may intersect. To check for such inconsistencies we
are determining the degree of intersection between
two spatial entities A and B. On that account, a new
mesh or point is generated describing the intersection
Int, so that the degree of intersection is determined by
dividing the volume of Int with the minimum volume
of A and B.
µ
int
(A, B) =
V
Int
min{V
A
,V
B
}
5.1.3 Inclusion
The inclusion of two spatial entities is similar defined
as the intersection. We say that a spatial entity B is
included in an entity A, if
µ
inc
(A, B) =
V
Int
V
B
Compared to intersection inclusion only considers the
volume of the entity being included. For that reason
this relation is not symmetrical contrary to all other
relations described in this work.
5.2 Derived Relations
5.2.1 Adjacency
There exist many anatomical entities in the human
body sharing a common border or adjoining to each
AUTOMATIC SPATIAL PLAUSIBILITY CHECKS FOR MEDICAL OBJECT RECOGNITION RESULTS USING A
SPATIO-ANATOMICAL ONTOLOGY
9
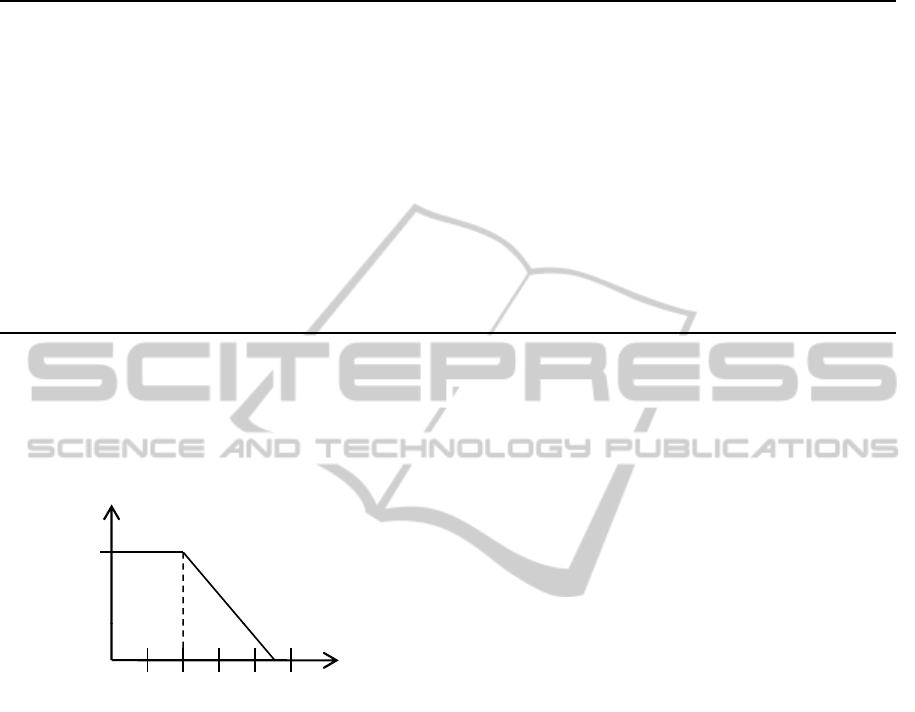
Table 3: Mean values and standard deviations for fuzzy membership values for the adjacency relation depending on the choice
of the t-norm.
>
Goedel
>
prod
>
Lukas
Relation avg stddev avg stddev avg stddev
Bronchial bifurcation, Right lung 0.0485 0.2001 0.0485 0.2001 0.0485 0.2001
Hilum of left kidney, Left kidney 0.0043 0.0594 0.0043 0.0594 0.0043 0.0594
Hilum of right kidney, Right kidney 0.0032 0.0444 0.0032 0.0444 0.0032 0.0444
Left kidney, Left lung 0.0427 0.1753 0.0427 0.1753 0.0427 0.1753
Left lung, Right lung 0.1556 0.3319 0.1556 0.3319 0.2617 0.3967
Left lung, Top of left lung 0.2322 0.3526 0.2322 0.3526 0.2322 0.3526
Prostate, Top of pubic symphysis 0.0116 0.0922 0.0116 0.0922 0.0116 0.0922
Prostate, Urinary bladder 0.2647 0.4035 0.2647 0.4035 0.7442 0.3408
Right kidney, Right lung 0.0376 0.1788 0.0376 0.1788 0.0383 0.1796
Right lung, Top of right lung 0.2900 0.3985 0.2900 0.3985 0.2900 0.3985
Right lung, Top point of liver 0.2288 0.3522 0.2288 0.3522 0.2288 0.3522
Top of pubic symphysis, Urinary bladder 0.0114 0.0918 0.0114 0.0918 0.0114 0.0918
other, e. g., the border of the prostate and urinary blad-
der. These adjacent coherencies are represented using
a trapezoid neighborhood measure depicted in figure
3. Two spatial entities are fully neighbored, if the
m
bership
1
12
34 5
Me
m
Euclidean distance inmm
Figure 3: Graph of the fuzzy membership function for the
linguistic variable adjacent.
distance between them is lower than two millimeters.
After that border the neighborhood decreases to a dis-
tance of 4.5 millimeters at which spatial entities are
not considered as neighbored anymore. However, for
an appropriate representation of adjacency the inter-
section between two objects has to be incorporated.
This is important, since if two spatial entities inter-
sect, they are not adjacent anymore. To formulate
those circumstances using fuzzy sets, we comprise
the degree of non-intersection and the neighborhood
measure using a fuzzy t-norm (Klir and Yuan, 1994):
µ
ad j
(A, B) = t[µ
¬Int
(A, B), sup
x∈A
sup
y∈B
n
xy
]
where the non-intersection is computed using the
fuzzy logical not. Currently, three different t-norm
based logic definitions are implemented, namely Lu-
kasiewicz Logic, Gdel Logic and Product Logic. The
details of their definitions can be derived from (Klir
and Yuan, 1994). Table 3 compares the average and
standard deviations between the different logics. We
decided to use the Lukasiewicz logic, because it pro-
vides the highest average of actual adjacent concepts
determined during a manual data examination. Addi-
tionally, the logic also yields the lowest standard de-
viations in comparison to the average value.
6 QUALITATIVE ANATOMICAL
MODEL
Figure 4 illustrates our modeling of instantiated fuzzy
spatial relations. It is loosely oriented on the formal-
ism in the FMA for storing spatial relations. However,
the value for each spatial relation is stored separately.
Another difference is the representation with a term
further qualifying the relation together with a truth
value in a separate instance. Currently, we integrate
orientation and adjacency in a qualitative model.
In order to create a qualitative anatomical model
we extract instances containing the spatial relations
described in Sect. 5. An instance describes the rela-
tion between two spatial entities occurring in a vol-
ume data set. To transform a relation into the model
a truth value is computed representing the mean of all
extracted values of this relation. Thereby, the orienta-
tion is stated using a directional term, i. e., left, right,
in front, etc. determined by the linguistic variables.
On the other hand, the adjacency only gets a simple
boolean qualifier. We determined a threshold of 0.2
(see table 3) to distinguish between adjacent and not
adjacent.
KDIR 2010 - International Conference on Knowledge Discovery and Information Retrieval
10
Instanceof FuzzyRelation
Anatomical Entity B
s
oc
n
Instanceof FuzzyRelation
Instance
of
FuzzyRelation
[0..1]
left|right|
above|…
term
truthValue
location
Related_object
ySpatialAs
s
t
ionRelatio
n
type
[0..1]
left|right|
a
bove
|
…
term
truthValue
[0..1]
left|right|
above
|
term
truthValue
Instance
of
FuzzyRelation
[0..1]
left|right|
term
truthValue
Instanceo
f
FuzzyRelation
[0..1]
left|right
|
t
truthValue
Instanceof FuzzyRelation
Anatomical Entity A
location
Fuzz
ia
t
above
|
…
above|…
term
left|right
|
above|…
t
erm
Figure 4: Illustration of the extended structure for storing the six linguistic variables separately and represent truth values in
the ontology.
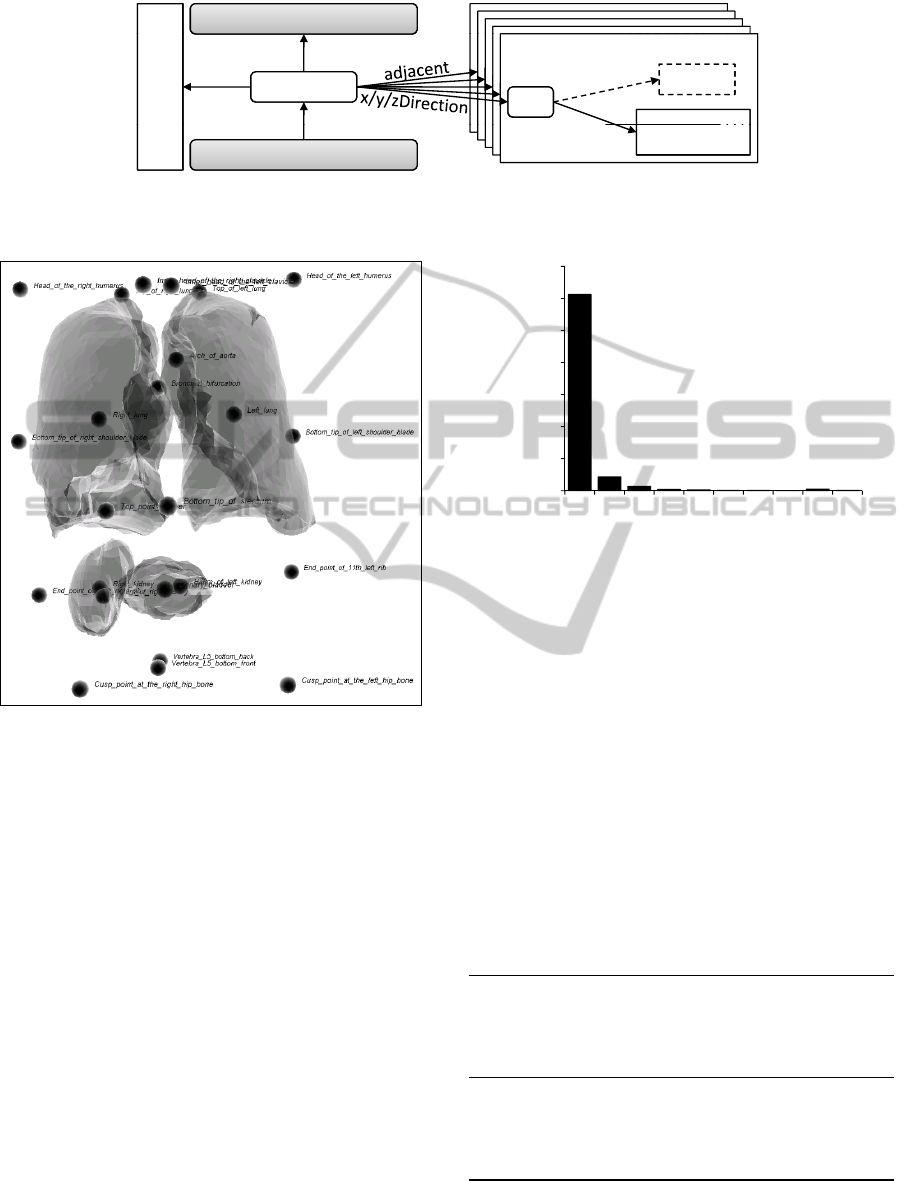
Figure 5: Visualization of the organ and landmark locations
for an incorrect detector results (cf. the location of the uri-
nary bladder).
7 EVALUATION AND RESULTS
When an actual detector result is to be checked
against the generic qualitative anatomical model, we
first represent all its inherent spatial relations us-
ing the same formalism that we use for the generic
anatomical model. This yields a set of OWL in-
stances. Next, we iterate over all instances of the
detector result and compare their directions and truth
values to the generic model. We consider a spatial
relation instance to be not conform with the model if
the truth values differ by at least 50%. We then count
the occurrences of the anatomical concepts among the
non-conform instances. The higher this number is for
a given anatomical concept, the more likely the re-
spective organ has been located incorrectly.
Figure 5 shows the visualization of an incorrect
detector result. In the upper part you can see the two
lungs and a number of landmarks. In the lower half
1225
1200
1400
v
en
Histogram
1225
1000
1200
1400
w
ithagiven
Histogram
1225
800
1000
1200
1400
t
anceswithagiven
yvalue
Histogram
1225
600
800
1000
1200
1400
i
oninstanceswithagiven
n
formityvalue
Histogram
1225
86
200
400
600
800
1000
1200
1400
r
ofrelationinstanceswithagiven
conformityvalue
Histogram
1225
86
28
8
6
2
3
1
10
3
0
200
400
600
800
1000
1200
1400
numberofrelationinstanceswithagiven
conformityvalue
Histogram
1225
86
28
8
6
2
3
1
10
3
0
200
400
600
800
1000
1200
1400
10 20 30 40 50 60 70 80 90 >90
numberofrelationinstanceswithagiven
conformityvalue
conformit
y
deviationin%
Histogram
1225
86
28
8
6
2
3
1
10
3
0
200
400
600
800
1000
1200
1400
10 20 30 40 50 60 70 80 90 >90
numberofrelationinstanceswithagiven
conformityvalue
conformitydeviationin%
Histogram
Figure 6: Distribution of the differences of the truth values
between model and the detector result presented in Figure 5.
you see one kidney and right from the kidney the uri-
nary bladder has been located. This is clearly incor-
rect. In fact the urinary bladder should lie much fur-
ther below. The other kidney has not been detected
at all. Figure 6 shows a histogram of the differences
in percent between the model and the spatial relation
instances of this volume data set. Apparently, most of
the relation instances have a comparably low differ-
ence to the model. Among all relation instances with
a difference to the model of more than 50%, those
with relation to urinary bladder account for 11 out of
16. This information gives evidence that the location
of the urinary bladder is very likely to be incorrect.
Table 4: Results of the spatial consistency check evaluation.
true positives 407
true negatives 431
false positives 67
false negatives 213
avg. difference correct detector results 2.7%
avg. difference incorrect detector results 9.0%
precision 85.7%
recall 65.5%
AUTOMATIC SPATIAL PLAUSIBILITY CHECKS FOR MEDICAL OBJECT RECOGNITION RESULTS USING A
SPATIO-ANATOMICAL ONTOLOGY
11

Validation on Controlled Corpus
We performed a systematic evaluation of the spatial
consistency check on our manually labeled corpus us-
ing four-fold cross evaluation. Our results show that
the average difference in percent between the spa-
tial relation instances in the learned model and the
instances generated for an element from the evalua-
tion set is an appropriate measure for the spatial con-
sistency. The average difference to the truth value
in the model for correct detector results was 2.77%
whereas the average difference to the truth value in the
model for incorrect detector results was 9%. Using
5% as a threshold to distinguish spatially consistent
(< 5%) from inconsistent (>= 5%) yields a precision
of 85.7% with a recall of 65.5% for the detection of
spatially inconsistent detector results.
8 CONCLUSIONS AND FUTURE
WORK
We presented an approach fusing state-of-the-art ob-
ject recognition algorithms for 3D medical volume
data sets with technologies from the Semantic Web.
In a two-stage process we augmented the FMA as
the most comprehensive reference ontology for hu-
man anatomy with spatial relations. These relations
were acquired inductively from a corpus of semanti-
cally annotated CT volume data sets. The first stage
of this process abstracted relational information using
a fuzzy set representation formalism. In the second
stage we further abstracted from the fuzzy anatomi-
cal atlas to a symbolic level using an extension of the
spatial relation model of the FMA.
In our evaluation we were able to show that this
spatio-anatomical model can be applied successfully
to check the results of automatic object detection al-
gorithms. The detection of incorrect object recogni-
tion constellations can be performed with a high pre-
cision of 85.6% and a recall of 65.5%. The presented
method can thus improve existing statistical object
recognition algorithms by contributing a method to
sort out incorrect results and increase the overall per-
formance by reducing the number of incorrect results.
Currently our anatomical model only covers direc-
tional information for pairs of spatial entities in our
corpus. We plan to add spatial inclusion and intersec-
tion between entities.
Among our next steps is also a user evaluation
of clinical applications making use of the reasoning,
e. g., to support radiologists by suggesting anatomi-
cal concepts and relations during manual image an-
notation. Furthermore, our approach could be used to
generate warnings for manually generated image an-
notations in case they do not conform to the spatial
anatomical model. A clinical evaluation of these fea-
tures is planned for the near future.
ACKNOWLEDGEMENTS
This research has been supported in part by the re-
search program THESEUS in the MEDICO project,
which is funded by the German Federal Ministry of
Economics and Technology under the grant number
01MQ07016. The responsibility for this publication
lies with the authors.
KDIR 2010 - International Conference on Knowledge Discovery and Information Retrieval
12

REFERENCES
Bankman, I., editor (2000). Handbook of medical imaging:
processing and analysis. Elsevier.
Berretti, S. and Bimbo, A. D. (2006). Modeling spatial re-
lationships between 3d objects. Pattern Recognition,
2006. ICPR 2006. 18th International Conference on,
1:119 – 122.
Bloch, I. (1999a). Fuzzy relative position between ob-
jects in image processing: new definition and prop-
erties based on a morphological approach. Interna-
tional Journal Of Uncertainty, Fuzziness And Knowl-
edge Based Systems, 7:99–134. Notes.
Bloch, I. (1999b). On fuzzy distances and their use in image
processing under imprecision. Pattern Recognition,
32(11):1873–1895.
Bloch, I. (2005). Fuzzy spatial relationships for image pro-
cessing and interpretation: a review. Image and Vision
Computing, 23(2):89–110.
Bloch, I. and Ralescu, A. (2003). Directional relative posi-
tion between objects in image processing: a compar-
ison between fuzzy approaches. Pattern Recognition,
36(7):1563–1582.
da Luz, A., Abdala, D. D., Wangenheim, A. V., and Co-
munello, E. (2006). Analyzing dicom and non-dicom
features in content-based medical image retrieval: A
multi-layer approach. In Computer-Based Medical
Systems, 2006. CBMS 2006. 19th IEEE International
Symposium on, pages 93–98.
Hudelot, C., Atif, J., and Bloch, I. (2008). Fuzzy spatial
relation ontology for image interpretation. Fuzzy Sets
Syst., 159(15):1929–1951.
Klir, G. J. and Yuan, B. (1994). Fuzzy sets and fuzzy logic:
theory and applications. Prentice-Hall, Inc. Upper
Saddle River, NJ, USA.
Krishnapuram, R., Keller, J. M., and Ma, Y. (1993). Quan-
titative analysis of properties and spatial relations of
fuzzy image regions. IEEE Transactions on Fuzzy
Systems, 1(3):222–233.
Mildenberger, P., Eichelberg, M., and Martin, E. (2002).
Introduction to the DICOM standard. European Radi-
ology, 12(4):920–927.
Mirtich, B. (2005). Fast and accurate computation of poly-
hedral mass properties. Graphics tools: The jgt edi-
tors’ choice.
M
¨
oller, M., Folz, C., Sintek, M., Seifert, S., and Wenner-
berg, P. (2009). Extending the foundational model of
anatomy with automatically acquired spatial relations.
In Proc. of the International Conference on Biomedi-
cal Ontologies (ICBO).
Object Management Group, I. (2004). Common object re-
quest broker architecture: Core specification. online.
Version 3.0.3.
Rosse, C. and Mejino, J. L. V. (2007). Anatomy Ontolo-
gies for Bioinformatics: Principles and Practice, vol-
ume 6, chapter The Foundational Model of Anatomy
Ontology, pages 59–117. Springer.
Seifert, S., Kelm, M., M
¨
oller, M., Mukherjee, S., Cavallaro,
A., Huber, M., and Comaniciu, D. (2010). Semantic
annotation of medical images. In Proc. of SPIE Med-
ical Imaging, San Diego, CA, USA.
AUTOMATIC SPATIAL PLAUSIBILITY CHECKS FOR MEDICAL OBJECT RECOGNITION RESULTS USING A
SPATIO-ANATOMICAL ONTOLOGY
13
