
KONSULTANT
A Knowledge Base for Automated Interpretation of Profit Values
Bojan Tomić and Tanja Milić
Faculty of Organizational Sciences, University of Belgrade, Jove Ilića 154, Belgrade, Serbia
Keywords: Expert system applications, Knowledge base, Rule-based system.
Abstract: Modern reporting systems and business intelligence tools provide various reports for everyday (business)
use. Unfortunately, it seems that these reports contain mostly data and little or no information. The
consequence is that users need to manually analyze and interpret large quantities of data in order to get
information on how the business is doing. A potential solution for this problem is presented in this paper. It
is a knowledge base for automated interpretation of annual profit values for enterprises.
1 INTRODUCTION
Increased usage of reporting systems and business
intelligence tools (BI onward) has lead to improved
reporting throughout various enterprises. However,
some experts in the BI area state that the generated
reports are not that useful as it seems that they
contain mostly data and little or no information.
A potential solution for this problem is presented
in this paper. The idea is to automate the process of
transforming data into information. The information
generated this way can then be presented along with
data, thus making reports more useful.
The result is a knowledge base for automated
interpretation of annual profit values for enterprises -
Konsultant. This simple prototype takes relevant
business data and creates natural-language-like
conclusions about the state of business.
2 RELATED WORK
Recent magazine articles and interviews with
professionals in the BI area reveal that there might
be an abundance of data and lack of information in
reports generated by BI systems. One article
(Whiting, 2002) suggests that users don't have easy
access to the information they need because there is
too much information to sift through. Gnatovich
(2005, §2) stated that “one would think this
avalanche of data would be delivering huge benefits,
but executives report that they are no closer to
making good use of this mountain of information”.
In an interview, Wise said that “BI is so data heavy
that it's often very difficult in terms of being able to
get the information that people want”(All, 2008, §3).
Data can be defined as “the raw material that is
processed and refined to generate information”
(Silver and Silver, 1989, pp. 6). Data becomes
information when meaning is added to it (Floridi,
2005, pp. 353). This can be presented as an equation
(Checkland and Scholes, 1990, pp. 303):
INFORMATION = DATA + MEANING (1)
When the user gets a report (it usually contains a
few spreadsheets together with some charts), he/she
takes a look and interprets the data presented within
by using his/her knowledge. Information about the
current state of business is the result (equation (2)).
INFORMATION = DATA +
INTERPRETATION KNOWLEDGE
(2)
Finally, by consulting equations (1) and (2), it
can be deducted that it is the users' interpretation
knowledge that adds meaning to data thus making
information. This leads to equation (3) which is
described in detail in a paper by Tomić (2009).
INTERPRETATION KNOWLEDGE =
MEANING
(3)
Hence, the user is the one who manually
interprets data, adding meaning to it and turning it
into information. Ideally, this data-to-information
transformation process should to be automated. The
420
Tomi
´
c B. and Mili
´
c T. (2010).
KONSULTANT - A Knowledge Base for Automated Interpretation of Profit Values.
In Proceedings of the 12th International Conference on Enterprise Information Systems - Artificial Intelligence and Decision Support Systems, pages
420-423
DOI: 10.5220/0002968904200423
Copyright
c
SciTePress

first step then is to formalize this interpretation
knowledge and create a knowledge base.
The knowledge base presented in the following
sections is just one major milestone in our project,
while the other includes developing an explanation
facility which could provide natural-language-like
explanations in various output formats and
languages (Tomić, Horvat and Jovanović, 2010).
3 MODEL
The knowledge for the Konsultant knowledge base
was extracted from literature and experts. Literature
included several university textbooks (Milićević and
Ilić, 2005; Žarkić Joksimović, 2005; Jovanović,
2005) and an expert was called on to verify the
model for correctness and completeness.
The process of analyzing annual profit values
was the basis of the knowledge base model. This
process can be divided into four steps.
The first step is to interpret profit value for the
current year. No other data is taken into account, not
even profit values for previous years. The only
information that can be inferred is whether profit is
positive, negative or neutral (close to zero). But,
depending on the size of the enterprise, the industry
sector and other factors, it can be hard to determine
if profit is neutral or positive (a profit of ten
thousand dollars may be considerate for some
enterprises, but insignificant for others). Each
enterprise has its own set of referential values, so it
was decided that the boundary values for neutral
profit should be entered together with other data.
Positive profit is always considered to be a good
thing. But, negative or neutral profit may not be
interpreted as bad in all situations. New enterprises
tend to achieve negative profit in the first few years
of business. This is why, in the second step, it is
important to check whether the enterprise is new and
if the return-on-investment (ROI) period is over. It is
bad if negative or neutral profit persists after the
projected ROI period is over. Established enterprises
should almost always be able to achieve positive
profit, except if they undergo a major investment.
The third step includes comparing current profit
with average profit in the industry sector. Average
profit values are never good indicators by
themselves as individual profit values may be very
scattered. But, negative or neutral average sector
profit can indicate a serious crisis or disruption in
the market and thus enable finding root cause for
negative profit values. If the annual profit is larger
than the average in sector, the enterprise is doing
better than most of its competitors and vice versa.
Since it is hard to determine accurately if the profit
is significantly larger or smaller than the average
profit in sector, the solution we employed was to
enter a percentage value to act as a boundary.
The final step is to compare profit value for the
current year with values from previous years. This
time series analyses is always limited to a few years
in the past (usually three to five) and helps
determine whether profit is on the rise, oscillatory or
declining. The analyses is made by comparing
differential profit for two consecutive years. If, for
example, profit is on the rise, it can be determined if
the growth trend is exponential, asymptotic or nearly
linear. Declining profit can have a parabolic,
asymptotic or nearly linear trend. Oscillatory profit
trends are most common. Their interpretation starts
by determining if profit is on the rise since the
previous year or not. Then, profit values for the
current year and two years before get compared in
order to see if the oscillation has lead to an overall
growth or decline.
The knowledge model derived from this process
contains four parts (which correspond to the process
steps). The acquired knowledge is formalized by
using production rules and objects. Forward
chaining is the inferencing technique of choice as
there is a need to infer as much information as
possible from a limited set of data. A few example
rules can be seen in the following listing.
IF enterprise.currentProfit > 0 AND
enterprise.ProfitNearZero = false
THEN “Enterprise is making money and
profit is significantly large
which is good.”
IF enterprise.currentProfit > 0 AND
enterprise.diffProfit1 > 0 AND
enterprise.diffProfit2 > 0 AND
enterprise.diffProfit1 >
enterprise.diffProfit2
THEN “The profit has had an exponen-
tial growth trend in the past two
years which is excellent.”
4 IMPLEMENTATION
The Konsultant knowledge base is implemented by
using the Drools Expert rule engine (JBoss
Community, 2009). This free tool uses Java objects
as facts and has support for forward chaining. The
implementation consists of 73 rules, two of which
can be seen in the following figure (Figure 1).
KONSULTANT - A Knowledge Base for Automated Interpretation of Profit Values
421
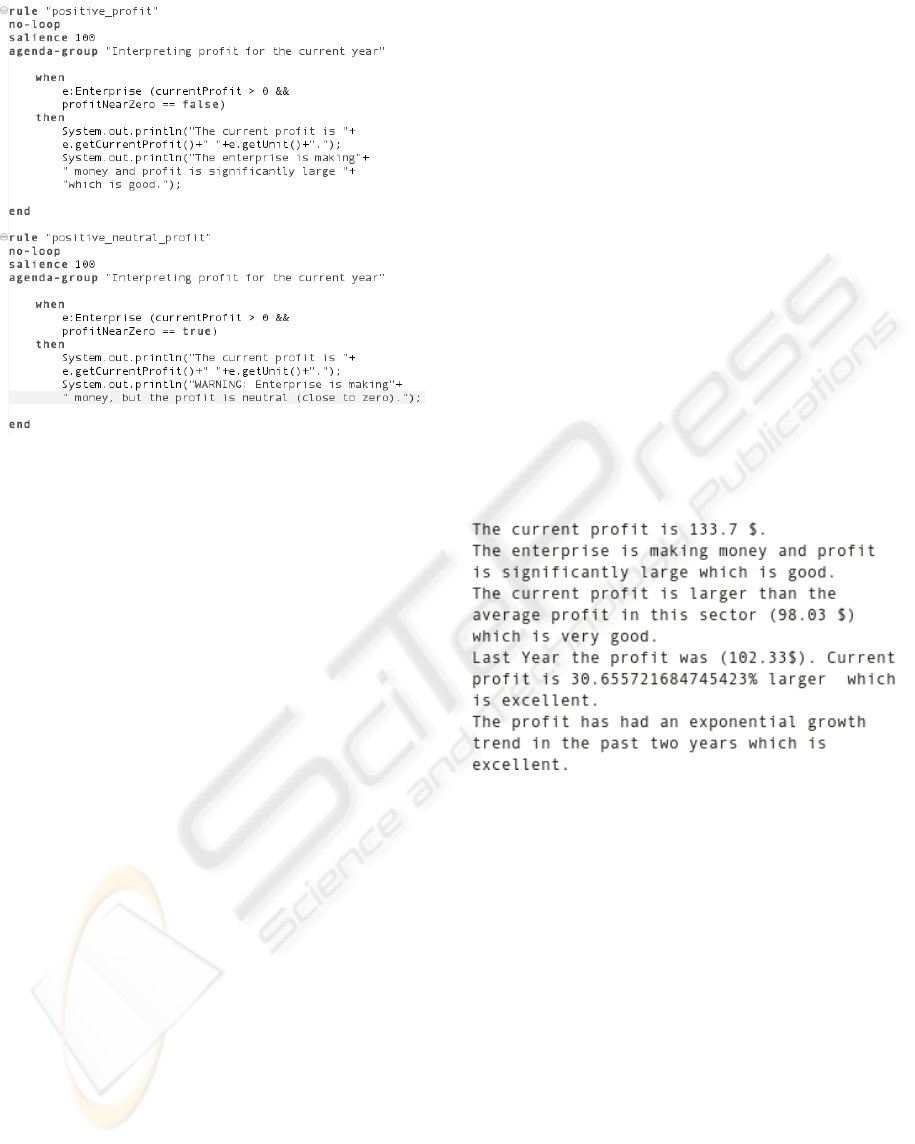
Figure 1: Knowledge base implemented in Drools Expert.
All rules are divided into “agenda groups”. These
groups provide a way of controlling which rules are
active during the inference process and, together
with rule importance (“salience”), can help control
the order in which inferences are made. Each part of
the model is implemented as an agenda group.
Second, all rules use regular Java objects as facts
in their “if” part (in Drools Expert, this is the
“when” part). Business data is represented by using
an instance of the “Enterprise” class. For example,
attributes “currentProfit” and “profitNearZero”
contain values which are used to determine whether
the “if” part of the rule evaluates as true. Private
methods do all of the necessary calculations before
the inference process begins. For example, the
“profitNearZero” attribute is set to true or false in
advance by a method that checks whether current
profit is inside the defined neutral profit boundaries.
The actions in the “then” part of each rule enable
creation of information in the form of natural-
language-like explanations. These explanations are
generated by commands that output text on the
standard Java output stream - computer screen. Also,
these commands do not alter existing facts nor create
new facts to be used for future inferences.
Up to this point there has been no mention about
data sources used for Konsultant. The data source is
a small OLAP implemented in the MySQL relational
database (Oracle Corporation, 2009). The data is
structured in the form of a “star schema”, meaning
that it is not normalized and contains redundant,
precalculated data suitable for reporting. Time is the
only dimension (in years), and data tables contain
annual profit, average sector profit and differential
profit values. Additional data provided by the user
like neutral profit boundaries and near average profit
boundaries are stored in separate data tables.
The connection between the OLAP data source
and the knowledge base is made by using the
Hibernate object-relational mapping framework
(JBoss Corporation, 2008). A single instance of the
“Enterprise” class is created and populated with data
from the OLAP data source. This instance is then
inserted into the working memory, and the
inferencing can begin.
An example of a report generated by Konsultant
can be seen in the following figure (Figure 2). The
report consists of simple, unformatted text with
some data values inserted at certain places.
Information it contains can simply be read and
understood without further interpretation. Since data
is also present, the user can ensure that the
information is correct. Currently, there is no
possibility of including data tables or charts in the
report, or transforming the report to XML or PDF.
Figure 2: A report example generated by Konsultant.
5 EVALUATION
The reports Konsultant provides are very basic, and
we believe that an evaluation with end users would
be premature and strongly influenced by limitations
of the report presentation techniques. Therefore, this
section summarizes experiences that the expert and
knowledge engineers gained during development.
On the positive side, business data interpretation
knowledge is not difficult to acquire because it is
standardized and can be found in university
literature. The knowledge base can easily be
maintained and upgraded thanks to the modular
design. The reports contain both information and
data, thus enabling the user to assert that the
information is correct. Also, the information is given
in the form of natural-language-like sentences which
ICEIS 2010 - 12th International Conference on Enterprise Information Systems
422

can just be read and require no additional technical
skills on behalf of the user. Finally, the inferred
information is not biased and is of constant quality
(uninfluenced by fatigue, lack of knowledge etc.).
The solution has some negative aspects as well.
First, graphical charts and data tables cannot be
inserted into the reports at this time. Also, there is no
standard way of defining fuzzy facts such as “near
average”, “close to zero” etc. Currently, Konsultant
uses “hard” boundaries (usually represented by
constants) to define these facts. Finally, the
knowledge base is not able to work with missing or
incorrect data. The consequence is that the inferred
information can prove to be incomplete or incorrect.
6 FUTURE WORK
Konsultant is a part of a larger project, so future
work is dictated by the overall project plan and
findings presented in the evaluation section.
First of all, issues regarding presentation of fuzzy
facts, working with missing and incorrect data as
well as graphical representation of data need to be
resolved. Second, the explanation facility which is
being developed (Tomić, Horvat and Jovanović,
2010) should be utilized. This facility should be able
to insert graphical representations of data into
reports thus addressing one of the issues. Only then
should an evaluation with end users be performed.
7 CONCLUSIONS
A knowledge base for automated interpretation of
annual profit values is presented in this paper. It
transforms business data into information which is
then presented as natural-language-like sentences.
Positive aspects of this solution include easy
maintenance and upgrading through availability of
standardized knowledge. The provided information
is unbiased and constant in quality. On the negative
side, the generated reports cannot contain any data
tables or charts, there is no standard way of defining
fuzzy facts and the issue of missing and incorrect
data has not yet been properly addressed.
Future work includes resolving all issues and
utilizing the explanation facility that is being
developed. The final step should include an
evaluation with end users.
REFERENCES
All, A. (2008). With Broader BI Usage, Who Owns the
Data? IT Business Edge. Retrieved January 9, 2008,
from: http://www.itbusinessedge.com/item/?ci=37391
Checkland, P. B. and Scholes, J. (1990). Soft Systems
Methodology in Action. NY: John Wiley & Sons.
Floridi, L. (2005). Is Semantic Information Meaningful
Data? Philosophy and Phenomenological Research,
70(2), 351-370.
Gnatovich, R. (2005). Closing the Analysis Gap. Imedia
Connection. Retrieved January 10, 2008, from:
http://www.imediaconnection.com/content/6060.asp
JBoss Community. (2009). Drools Expert. Retrieved
September 1, 2009, from:
http://labs.jboss.com/drools/drools-expert.html
JBoss Corporation. (2008). Hibernate: Relational
Persistence for Java and .NET. Retrieved November
13, 2008, from http://www.hibernate.org/
Jovanović, P. (2005). Upravljanje investicijama (5th ed.).
Belgrade: Faculty of organizational sciences.
Milićević, V. and Ilić, B. (2005). Ekonomika preduzeća:
fokus na savremeno poslovanje (2nd ed.). Belgrade:
Faculty of organizational sciences.
Oracle Corporation. (2009). MySQL. Retrieved December
3, 2009, from: http://www.mysql.com/
Silver, G. A. and Silver, M. L. (1989). Systems Analysis
and Design. MA: Addison Wesley.
Tomić, B. (2009). Automated interpretation of key
performance indicators by using rules. In Giurca, A.,
Gasevic, D. and Taveter, K. (Eds.) Handbook of
Research on Emerging Rule-Based Languages and
Technologies: Open Solutions and Approaches (pp.
625-646). IGI Publishing: Hershey.
Tomić, B., Horvat, B. and Jovanović, N. (2010). JEFF:
Java Explanation Facility Framework. Proceedings
from YU INFO 2010: The 16th Computer Science and
Informatics Conference. Kopaonik.
Whiting, R. (2002). Analysis gap. Information Week
Retrieved January 10, 2008, from: http://
www.informationweek.com/story/IWK20020418S000
7
Žarkić Joksimović, N. (2005). Upravljanje finansijama:
osnove i principi (2nd ed.). Belgrade: Faculty of
organizational sciences.
KONSULTANT - A Knowledge Base for Automated Interpretation of Profit Values
423
