
MOVIE RECOMMENDATION WITH K-MEANS CLUSTERING
AND SELF-ORGANIZING MAP METHODS
Eugene Seo and Ho-Jin Choi
Department of Computer Science, Korea Advanced Institute of Science and Techonology (KAIST)
119 Munjro,Yuseong, Daejeon, 305-732, Korea
Keywords: Recommendation system, Machine learning, K-means clustering, Self-organisation map.
Abstract: Recommendation System has been developed to offer users a personalized service. We apply K-means and
Self-Organizing Map (SOM) methods for the recommendation system. We explain each method in movie
recommendation, and compare their performance in the sense of prediction accuracy and learning time. Our
experimental results with given Netflix movie datasets demonstrates how SOM performs better than K-
means to give precise prediction of movie recommendation with discussion, but it needs to be solved for
the overall time of computation.
1 INTRODUCTION
Recommender systems appeared as the increasing
amount of data on Web and other digital
applications which contains huge data for users.
Because of the large amount of data, users have been
able to obtain useful information and various
services. However, users faced to the problem of
overflow information and they have been in trouble
to fine the useful and suitable information for them
among a bunch of data. The overflow information
problem comes from not only increasing data
volume by time but also unwanted information. The
early recommender system started to remove the
useless information such as SPAM mails. This
system is called as filtering (Shardanand, 1995). In
addition to filtering, researchers have come up with
personalized system in the sense of recommendation.
Those recommendation systems focus on each user
rather than filtering documents. Based on users'
preference, the recommender systems provide
favorable service or information to the user.
Currently the importance of recommendation of
information is getting to increase in web
environment and many web sites started to develop
and make use of the recommendation technology to
provide user-customized services (Bennett, 2006).
Amazon.com (Lilien, 2003) is one good example to
utilize recommendation for users. It recommends
some books by analyzing the user's profile. Users
also prefer the recommendation systems because it
helps them to save time to search information and
get the best documents or products. It causes to
activate the web site and increase its profit in case of
E-commerce such as web shopping mall. In the such
a reason, recommendation technology is highlighted
in marketing fields as well.
In spite of the success of recommendation
technology in some web sites, the developers
realized the difficulties to recommend increasing
products to increasing users. From this problem,
many machine learning researchers have been
focused on developing effective recommendation
system with large number of data. In 2006, Netflix
offered a prize to the developer who makes an
effective movie-recommendation algorithm beyond
the current systems (Bell, 2007). Several machine
learning methods are used to develop the movie
recommendation with Netflix data. In this paper, we
apply two machine learning methods, K-means
clustering and Self-Organizing Map (SOM) into
movie recommendation system, and compare their
performance of two methods with sample data. It
shows the strong and weak points of each method
and indicates assignments the future advance
methods should solve.
This paper is organized as follows: the next
section reviews two traditional clustering algorithms,
K-means and SOM. Section 3 explains how to make
movie recommendation using two clustering
385
Seo E. and Choi H. (2010).
MOVIE RECOMMENDATION WITH K-MEANS CLUSTERING AND SELF-ORGANIZING MAP METHODS.
In Proceedings of the 2nd International Conference on Agents and Artificial Intelligence - Artificial Intelligence, pages 385-390
DOI: 10.5220/0002737603850390
Copyright
c
SciTePress
methods. Section 4 describes our experiment
environment and evaluation criteria. Section 5 shows
the experimental results and section 6 concludes
with discussion.
2 RECOMMENDATION
METHODS
2.1 K-means Clustering
In this section, we briefly describe the K-means
algorithm (Alpaydin, 2004) and its utilization for
recommendation. K-means clustering is an
unsupervised and semi-parametric learning method.
It groups the data, and the groups are represented by
their centers. In classification, each group is referred
as a class. A new input data is assigned to the closest
center of group. In recommendation system, K-
means clustering can be used to group users or
items. Most of cases, K-means method applies to
users to find similar user groups. It is called as
collaborative filtering (Adomavicius, 2005). Once
the recommender system finds a group, they provide
differentiated recommendation to the group based on
its characters. The description of algorithms is like
following.
2
1
arg min
ji
k
ji
iS=∈
−
∑∑
S
x
x μ
Given a set of observations (x
1
, x
2
, …, x
n
), K-means
clustering partitions the n observations into k groups,
which is smaller than n. S is the set of group, S={S
1
,
S
2
, …, S
k
}. Ultimately, this algorithms aims to find
the groups which minimize the within-cluster sum of
squares between data and mean of groups. The
algorithm proceeds by alternating between two steps.
Assignment step:
*
() () () *
{ : }, 1, ...,
ttt
ijji j
i
Sik=−≤− =xxm xm
Update step:
()
(1)
()
1
t
jj
t
ij
t
S
i
S
+
∈
=
∑
x
mx
Given an initial set of k means, in assignment step, it
assigns each observation to the cluster with the
closest mean. In update step, it calculates the new
means to be the center of the observation in the
cluster. It continues until it converges with no longer
change.
K-means method has three key features which
affect the result. One is the choice of k. The number
of k means the suitable number of groups. The
second feature is the way of compute distance
between observation and mean of groups. Generally,
Euclidean distance is used, but there are the other
ways to measure the distance. The third one is the
way to initial set of k. One study shows that the
result of K-means clustering algorithm is largely
depending on the initial position of k. Therefore
those are the consideration to get the better result
from K-means clustering
2.2 Self-Organizing Map (SOM)
The self-organizing map (SOM) algorithm (Honkela,
2008) is a type of artificial neural network trained
using unsupervised learning for mapping from high-
dimensional space to another low-dimensional
space. The low-dimensional representation of the
input space of the training samples is called map. A
self-organizing map consists of components called
nodes or neurons. Associated with each node is a
weight vector of the same dimension as the input
data vectors and a position in the map space. The
procedure for placing a vector from data space onto
the map is to find the node with the closest weight
vector to the vector taken from data space and to
assign the map coordinates of this node to our vector.
SOM methods operates in two modes: training
and mapping. Training builds the map using input
examples and mapping determines one single wining
node for the input vector. SOM training also
proceeds by alternating between two steps.
Competitive step:
()
() ()
arg min ,( 1,..., )
t
i
tt
ii
BMU i k=−=
n
xn
Update step:
() ()
(1) ()
() ( )
tt
tt
ii ii
thα
+
=+ −nn xn
where
()t
i
n is node with weight vector, ()tα is
adaptation coefficient, and
()t
i
h is neighborhood
function.
3 MOVIE RECOMMENDATION
In this section, we explain how to make movie
recommendation using K-means and SOM methods.
First, we assume each user have given some ratings
(from 1 to 5) for movies which they have watched.
Then K-means and SOM make movie
recommendation based the pattern of ratings. Two
ICAART 2010 - 2nd International Conference on Agents and Artificial Intelligence
386
methods are similar in the sense of making group of
users to recommend movies. However, the way to
make groups is different.
3.1 Recommendation with K-means
K-means forms groups as many as given k value.
Users are placed on movie dimension in according
to their movie ratings.
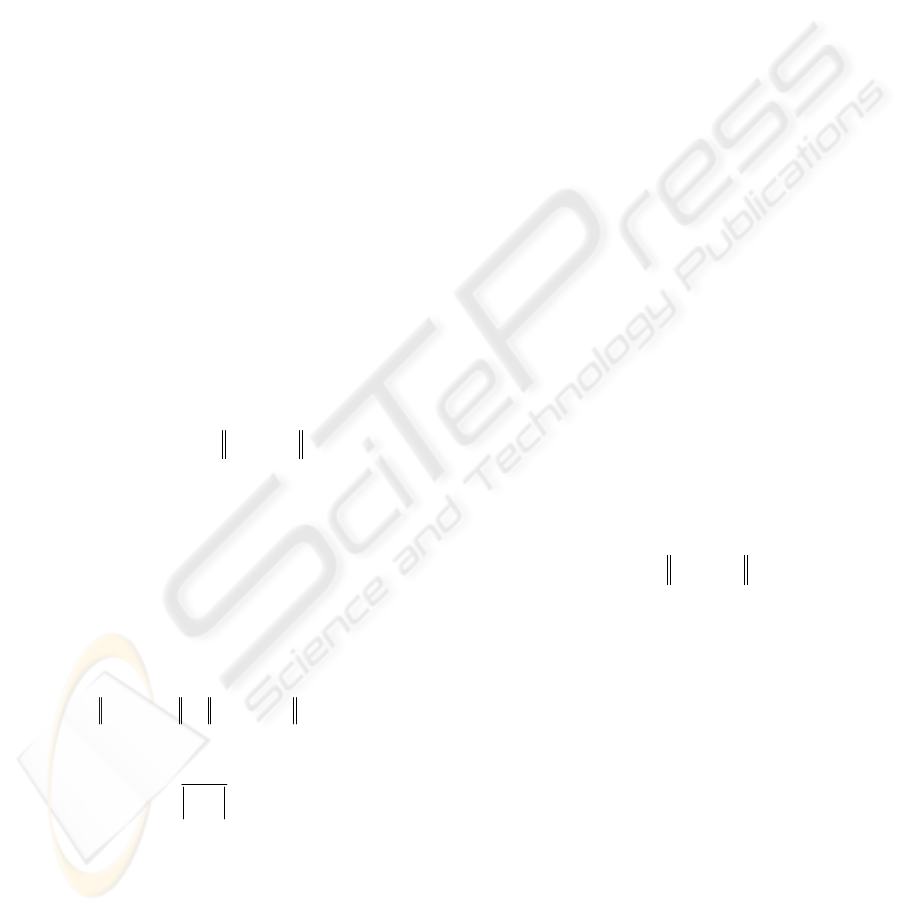
To give a example, we assume there are two
movies and seven users. The ratings seven users
gave for two movies are shown in Table 1.
Table 1: Movie ratings of users.
Users M1 M2
U1 1 1
U2 1 2
U3 2 2
U4 1 5
U5 2 5
U6 4 4
U7 5 5
The Fig. 1 shows a example of user distribution on
movie dimension.
0 1 2 3 4 5 6 7
0
1
2
3
4
5
6
7
Movie 1
Movie 2
User distribution on movie domain
Figure 1: User distribution in movie dimension.
0 1 2 3 4 5 6 7
0
1
2
3
4
5
6
7
Movie 1
Movie 2
User distribution on movie domain
Group 2
Group 3
Group 1
Figure 2: User grouping in movie dimension.
As it intuitively shows the group pattern among
users, k-means can make k groups based on the
distance between users. If k is three, the users are
divided it to three groups as shown in Fig. 2.
From this matrix, we can make movie
recommendation for a new user. If the new user
rated movie 1 as 5 star, the user will be located on 5
scale in movie 1. By computing the distance
between the new user and each center of group in
movie 1 domain, it decide which center the user will
belong to. Once user was assign to one group,
system predict expected ratings for the other movies
and select best rated movie to recommend to them.
In our example, a new user will belong to group 3
and system will predict rating of movie 2 as mean of
movie 3 ratings group 3 member have given. If the
number of movies is extended, we can predict all
ratings of each movies and select best movies to
users based on the highest rating value.
3.2 Recommendation with SOM
SOM is similar to K-means to make a group based
on user-given ratings for movies. SOM, however,
utilizes map to assign users rather than using movie
dimensionality. In example, we make a 3 by 3 map
consisting 9 nodes because two dimension map is
easy to visualize user distribution with same
assumption for movies and users given in section 3.1.
First, map initializes the value of each node and
update by user's ratings. In users' point view, they
search their best matched unit (BMU) in the map
and form a group in the same BMU. Fig. 3 shows
the group of users.
Once it form map and groups, it is ready to
recommend movies to a new user. The new user is
assigned to one of nodes and the system utilizes the
same group member's movie ratings to make
recommendation as shown in Fig. 3.
Figure 3: User distribution in SOM map.
MOVIE RECOMMENDATION WITH K-MEANS CLUSTERING AND SELF-ORGANIZING MAP METHODS
387
4 EXPERIMENT
This section describes our experiment with two
methods. After analyzing each method performance,
we compare those two method performance.
4.1 Netflix Date Set
In this section, we briefly describe Netflix given data
which we utilize to develop recommendation system.
Netflix data is divided into two parts; one is training
set, another is test set. Training set consists of one-
hundred million ratings from over 480 thousand
randomly chosen anonymous customers on nearly
18 thousand movies. This data has been collected
from October 1998 to December 2005. The rating
scale is from 1 to 5. Rating 0 means non-value.
Additionally, Netflix also provides the data of each
rating as well as the title and year of movies. Test
sets have over 2.8 million customer-movie pairs
with rating removed from training sets. It was
selected from the most recent ratings from a subset
of the same customers in the training data set, over a
subset of the same movies.
4.2 Experiment Environment
We experimented movie recommendation with
Netflix data in following environments.
MATLAB - Version 7.7.0.471 (R2008b)
OS- Window Vista Ultimate K 64 bit
Process - Inter(R) Core(TM) 2 Quad CPU @ 2.40
GHz
RAM - 8191 MB
4.3 Evaluation Matrix
Predicted rating of test sets is scored by computing
the square root of the averaged difference between
each prediction and the actual rating. It is called the
root mean squared error, RMSE. The lower RMSE
value is, the better recommend algorithms is. With
this evaluation matrix, it can compare the
performance of recommendation algorithms.
5 RESULTS
5.1 Results of K-means
Since whole training data is huge to learn K-means
clustering method, we use 10 thousand sample data
from 480 thousand customers. To capture the groups
of users, we observe 10 sample customers on 18
thousand movie dimension. Once we find the groups
of users, we predict the rating for the new users by
assigning them to the closest group and giving an
averaged value of group members' rating for a
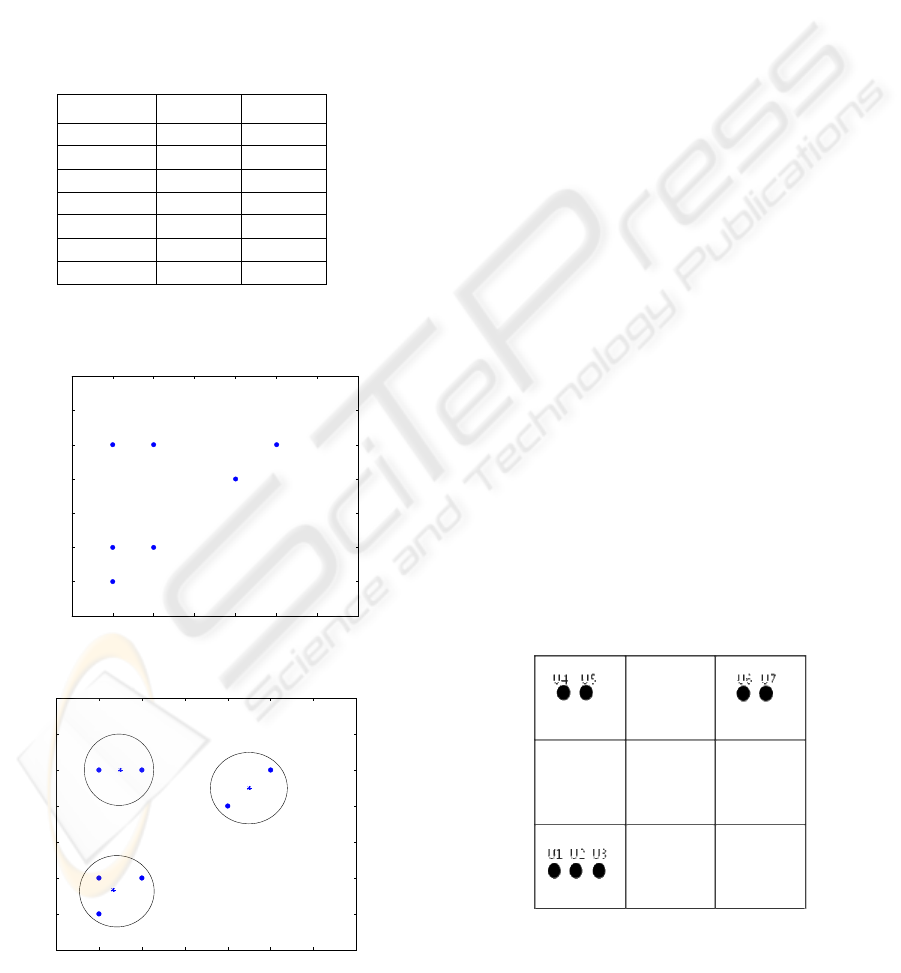
certain movie. As Fig 4. shows, K-means algorithms
takes a lot of time for learning as k is increased, and
give not favorable RMSE value for smaller number
of k.
Figure 4: RMSE and Prediction Time by K-Means
clustering.
In case of affecting by initialization ways or distance
measure functions, we experiment with all different
value of options. For the distance measurement, we
experiment with 4 different functions; Euclidean,
Cosine, Correlation, Cityblock. Fig. 5 shows the
result of each method.
It shows that Euclidean functions give a lower
RMSE value meaning that it give better prediction,
but it takes more time than other functions like
Cosine and Cityblock. The correlation functions give
the worst result in sense of both prediction and
learning time.
Figure 5: RMSE, Learning Time, and Prediction Time by
K-means clustering with different initialization methods.
ICAART 2010 - 2nd International Conference on Agents and Artificial Intelligence
388
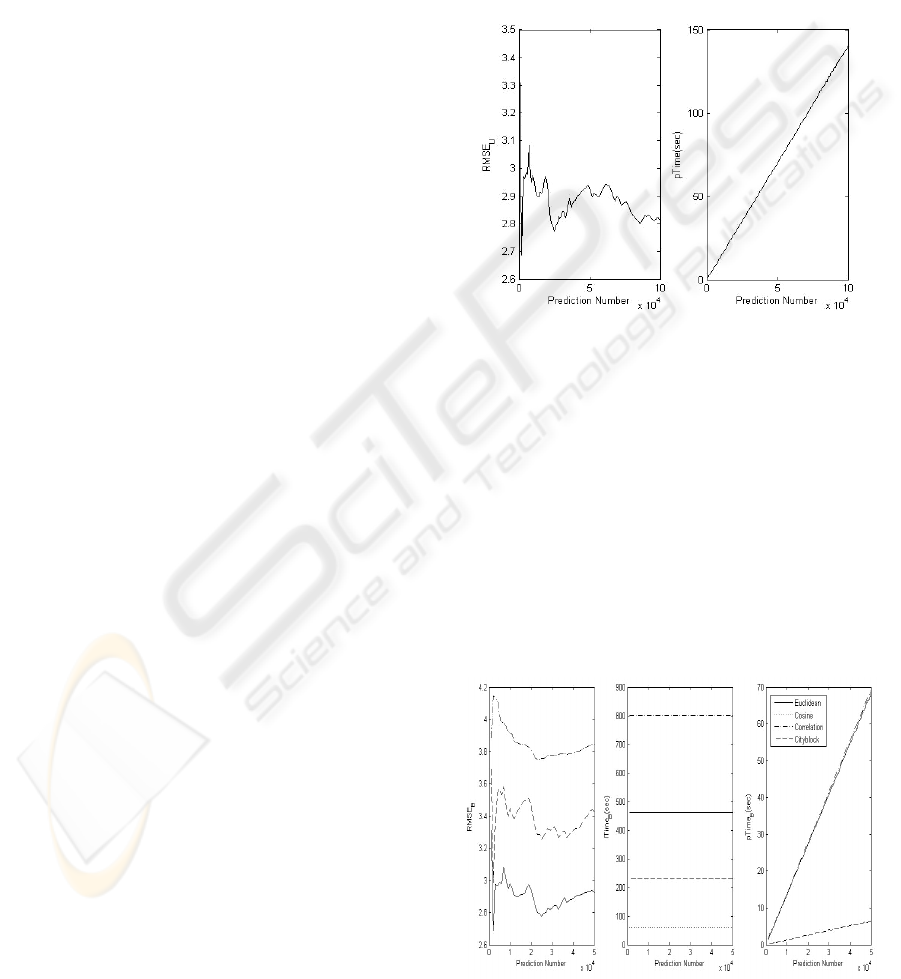
5.2 Results of SOM
We experiment SOM with 10 by 10 matrix map. It
doesn't take too long time to learn the training sets,
but it takes long time to give prediction to users. In
Fig. 6, it shows that it gives quite accurate prediction
result.
Figure 6: RMSE and Prediction Time by SOM.
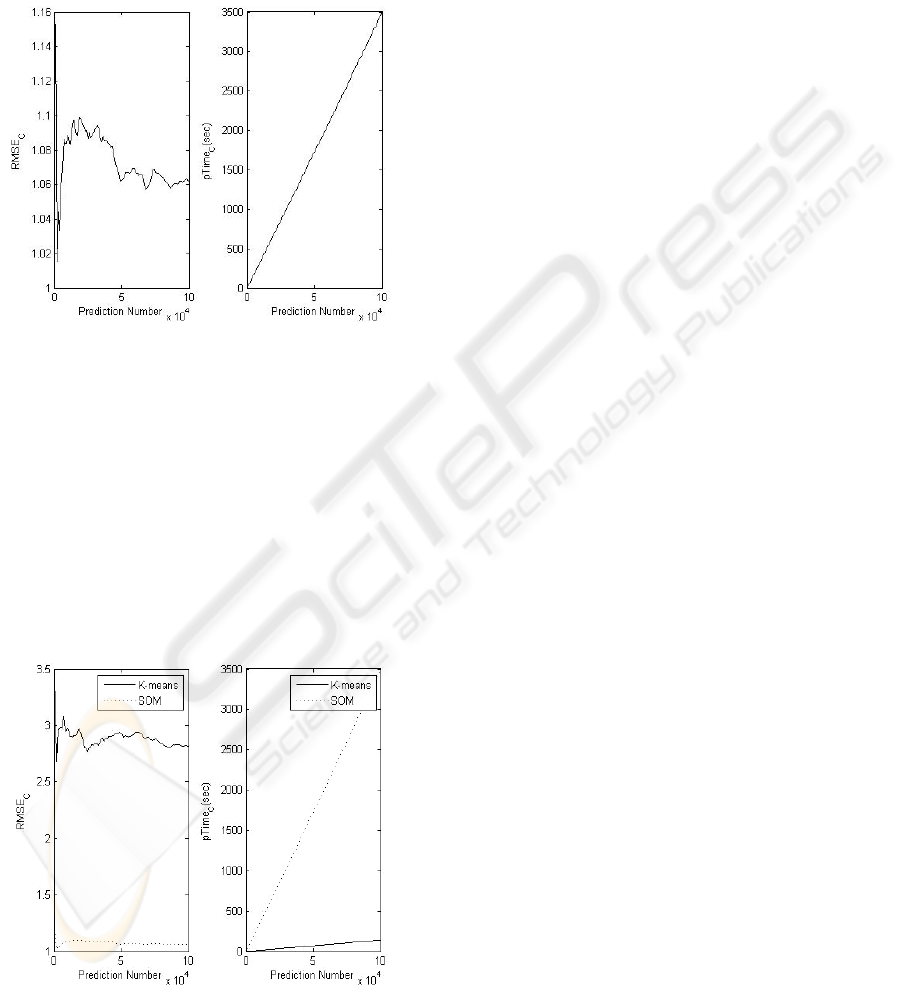
5.3 Comparison of Two Methods
Finally, we compare both two methods' performance
as looking at RMSE and Prediction time. It turns out
that SOM gives much accurate prediction rating
value than K-means clustering, but it spend a lot of
time for prediction as the number of user is
increasing. In real recommendation system, it
doesn't really matter as long as RMSE from SOM
doesn't change a lot by the number of prediction
value likely with K-means clustering (See Fig.7).
Figure 7: Comparison RMSE and Prediction Time
between K-means clustering and SOM.
6 CONCLUSIONS
In this paper, we presented the two machine learning
methods for recommendation system. Our
experimental results demonstrated that SOM
algorithm is superior to accurately predict rating of a
new user for a movie than K-means clustering. Even
though SOM surprisingly take too long time for
prediction rating for large number of users
comparing to the K-Means clustering, it turns out to
be no problem since the RMSE value are not
affected by the number of prediction. For some
methods like K-means give unstable value by the
number of prediction, it needs to predict a sufficient
number of users to get average RMSE value.
Even though SOM gives a great performance in
sense of accuracy, it needs to be solving in
computation time in case SOM methods should give
a large number of prediction to users. It is caused by
data size as well as sparsity. Therefore, we need to
deal with missing value among a large size of data
as future work. The advanced recommendation
algorithms will be applied to web and help users to
unitize information in their taste.
ACKNOWLEDGEMENTS
This research was supported by the MKE(Ministry
of Knowledge Economy), Korea, under the
ITRC(Information Technology Research Center)
support program supervised by the NIPA(National
IT Industry Promotion Agency) (NIPA-2009-
(C1090-0902-0032)).
REFERENCES
Adomavicius, G. and Tuzhilin, A. (2005). Toward the
Next Generation of Recommender Systems: A Survey
of the State-of –the-art and Possible Extensions. IEEE
Transactions on Knowledge and Data Engineering,
17( 6), 734-749.
Alpaydin, E. (2004). Introduction of Machine Learning,
The MIT Press.
Bennett, J. (2006). The Cinematch System: Operation,
Scale, Coverage, Accuracy, Impact. Retrieved July 15,
2009, from http://blog.recommenders06.com/wp-
content/uploads/2006/09/1jimbennett.wmv
Bell, R., Koren, Y. and Volinsky, C. (2007). The BellKor
solution to the Netflix Prize.
Billsus, D., Brunk, C.A., Evans, C., Gladish, B. and
Pazzani, M. (2002). Adaptive Interfaces for
Ubiquiitous Web Access. Comm. ACM. 45(5), 34-38.
MOVIE RECOMMENDATION WITH K-MEANS CLUSTERING AND SELF-ORGANIZING MAP METHODS
389

Bishop. C. M. (2006). Pattern Recognition and Machine
Learning, Springer.
Bishop, C. M., Svensén, M. and Williams, C. (1998).
GTM: The Generative Topographic Mapping, Neural
computation, The MIT Press.
Honkela, T. (1998). Description of Kohonen’s Self-
Organizing Map. Retrieved April 10, 2009,
http://mlab.taik.fi/~timo/som/thesis-som.html
Honkela, T., Virpioja, S. and Väyrynen, J. (2008)
Adaptive translation: Finding interlingual mappings
using self-organizing maps. Lecture Notes in
Computer Science, 5163, 603–612.
Lilien, G. L., Smith, P. and York, J. (2003). Amazon.com
Recommendations: Item-to-Item Collaborative
Filtering. IEEE Internet Computing.
Lindh-Knuutila, T., Raitio, J. and Honkela, T. (2008).
Combining self-organized and Bayesian models of
concept formation. In Proceedings of NCPW11.
Paterek, A. (2007). Improving regularized singular value
decomposition for collaborative filtering. KDD-Cup
and Workshop, ACM press.
Polcicova, G. (2004). Topographic organization of user
preference patterns in collaborative filtering. PhD
thesis, Slocak University of Techonology in Bratislava,
Faculty of Informatics and Information Techonologies.
Resnick, P., lakovou, N., Sushak, M., Bergstrom, P. and
Riedl, J. (1994). GroupLens: An Open Architecture
for Collaborative Filtering of Networks. Proc. 1994
Computer Supported Cooperative Work Conf.
Roh, T.H., Oh, K. and Han, I. (2003). Collaborative
filtering recommendation based on SOM cluster-
indexing CBR. Expert Systems with Applications,
25(3), 413-423.
Shardanand, U. and Maes, P. (1995). Social Information
Filtering: Alforithms for Automating ‘Word of Mouth’.
Proc. Conf. Human Factors in Computing Systems.
Vatanen, T., Paukkeri, M., Nieminen, I. T. and Honkela, T.
(2008). Analyzing authors and articles using keyword
extraction, self-organizing map and graph algorithms.
In Proceedings of the AKRR08, 105–111.
ICAART 2010 - 2nd International Conference on Agents and Artificial Intelligence
390
