
EVOLUTION STRATEGIES COMPARED TO GENETIC
ALGORITHMS IN FINDING OPTIMAL SIGNAL TIMING
FOR OVERSATURATED TRANSPORTATION NETWORK
Ali Hajbabaie and Rahim F. Benekohal
Civil and Environmental Engineering, University of Illinois at Urbana Champaign
205 N Mathew ave, Urbana, Illinois, U.S.A.
Keywords: Traffic Signal Optimization, Oversaturated Network, Evolution Strategies, Genetic Algorithms.
Abstract: This paper compares the performance of Evolution Strategies (ES) with simple Genetic Algorithms (GAs)
in finding optimal or near optimal signal timing in a small network of oversaturated intersections with
turning movements. The challenge is to find the green times and the offsets in all intersections so that total
vehicle-mile of the network is maximized. By incorporating ES or GA with the micro-simulation package,
CORSIM, we have been able to find the near optimal signal timing for the above-mentioned network. The
results of this study showed that both algorithms were able to find the near optimal signal timing in the
network. For all populations tested in this study, GA yielded higher fitness values than ES. GA with a
population size of 300, and selection pressure of 10% produced the highest fitness values. In GA for
medium and large size populations, a lower selection pressure produced better results while for small size
population a large selection pressure resulted in better fitness values. In ES for small size population, larger
µ/λ yielded better results, for medium size population both µ/λ ratios produced similar results, and for large
size population smaller µ/λ provided better results.
1 INTRODUCTION
Traffic congestion in major US metropolitan areas
costs $87 billion dollars annually. These costs plus
other negative effects of traffic congestion, calls for
practical methods for managing congestion in
transportation networks. Transportation supply
management can effectively reduce congestion in a
network by determining the optimal signal timing
that provides maximum capacity. In this study, two
different methods, ES and GAs, were used to find
the optimal or near optimal signal timing for a
transportation network consisting of nine
oversaturated intersections with turning movements.
In the past 10 years, much research has been
conducted to optimize signal timing in transportation
networks. A few examples are: Abu-Lebdeh and
Benekohal (2000) considered a two-way arterial
consisting of several intersections and tried to
manage the queues on this oversaturated arterial
using Gas. Chang and Sun (2003) considered a
network of 12 oversaturated and 13 undersaturated
intersections and proposed the Maximal Progression
Possibility method to minimize the delay and total
number of stops in the network by choosing the most
critical intersection and removing congestion from
that. Girianna and Benekohal (2004) considered an
oversaturated network consisting of 20 intersections
with one-way streets and used GAs to solve the
problem. Their algorithm was able to determine a
common cycle for the network and coordinate the
signals to remove congestion from the network.
Sanchez Medina et al. (2008) used GA to determine
optimal signal timing in two urban areas in Spain
and in one of their case studies increased the fitness
by 10% compared to the currently used signal
timing.
Similar to GAs, Evolution Strategies (ES) are
meta-heuristic approaches that start with a
population of candidate answers and try to improve
the fitness of the population over generations. Beyer
and Schwefel (2002) explained different aspects of
ES in their comprehensive introduction to ESs. ES
have been used extensively as an optimization
engine in a variety of scientific fields; however, we
did not find any study using ES to optimize signal
timing in transportation networks. This motivated us
to compare ES with GAs in finding signal
optimization solutions.
298
Hajbabaie A. and Benekohal R. (2009).
EVOLUTION STRATEGIES COMPARED TO GENETIC ALGORITHMS IN FINDING OPTIMAL SIGNAL TIMING FOR OVERSATURATED TRANS-
PORTATION NETWORK.
In Proceedings of the International Joint Conference on Computational Intelligence, pages 296-301
DOI: 10.5220/0002316202960301
Copyright
c
SciTePress

In this study, ES and GAs were used to find the
optimal or near optimal signal timing for a small size
oversaturated transportation network. Different
settings of GAs have been used and compared to
different settings of ES and their benefits and
drawbacks are discussed. The next sections discuss
methodology, results and our conclusions.
2 METHODOLOGY
In this section, the problem statement and
formulation, and the methodology to solve the
problem are presented.
2.1 Signal Optimization Problem
In signal optimization the goal is to find signal
timing such that a measure of effectiveness is
optimized. In this study, we are trying to maximize
total vehicle-mile in the network. The network is
oversaturated meaning that the traffic demand in the
network is more than the capacity. By signal timing,
we mean green times for each movement at the
intersection and the offsets. To study if ES and GAs
are capable of solving the signal optimization
problem, a simulated oversaturated transportation
network is used. This symmetric network consists of
nine intersections forming a rectangular grid as
shown in Figure 1. The length of each street is 2000
ft (including the entry and exit links as well).
Entry
Point
Figure 1: The schematic study network.
Traffic consists of only passenger cars; and they
enter the system at nine entry points shown in Figure
1. At each entry point, the volume is 1000 passenger
cars per hour per lane. It is assumed that 70% of
vehicles go straight, 10% turn right, and the
remaining 20% turn left. A fixed time signal timing
plan is used. All streets are two-way with one
approach lane per direction. At each intersection a
1000 ft long left turn pocket is assumed to avoid the
through lane being blocked by the left turning
vehicles. The traffic signal is assumed to have 4
phases, staring with left turn green arrows and
continued by through traffic green for each
direction.
ES or GAs determines the green times
(consequently the cycle lengths) and the offset for
each intersection to improve the total vehicle-mile
travelled in the entire network.
2.2 Signal Optimization Problem
Formulation
The problem could be formulated as an optimization
problem where we try to maximize total vehicle-
mile in the network. Vehicle-mile depends on the
signal timing of each intersection. In this problem,
the vehicles are moved in the network by CORSIM
simulation model and the vehicle-mile travelled is
tallied by software as well. We assumed that the left
turn green times are between 7 and 15 seconds. A
minimum of 20 seconds and a maximum of 80
seconds of green time are assumed for the through
traffic. The signal optimization problem is
formulated as follows:
M
a
x
v
=
f
(
g
ki
,Of
f
i
)
s.t.
7 ≤ g
1i
,g
3i
≤15
20 ≤ g
2i
, g
4i
≤ 80
0 ≤ Off
i
≤ C
i
C
i
= g
1i
+ g
2i
+ g
3i
+ g
4 i
+14
i
=
1..9
Where:
),(
iki
Offgf
: is the total vehicle-mile in the
network, i: is the intersection index, g
1i
,g
3i
: are the
left turn green times at intersection i, g
2i
,g
4i
: are the
through traffic green times at intersection i, Off
i
: is
the offset at intersection i, C
i
: is the cycle length at
intersection i, and number 14: is the lost time at each
intersection.
2.3 How the Problem is Solved
For signal timing problem, each individual consists
of signal timing for the whole network, and the
fitness function is the total vehicle-mile travelled in
the entire network. The ES Algorithm used in this
study uses three different recombination methods
which are: global intermediary, local intermediary,
and discrete recombination. Each time one of these
recombination operators is chosen randomly with
similar probabilities. In addition, a correlated
mutation is used. For simple GA that is used,
tournament selection with replacement, two-point
crossover with probability of 0.85, and simple
mutation with probability of 0.01 are used.
To solve the problem with ES, the initial
population is randomly generated and the fitness of
all individuals is evaluated (by CORSIM). Using
recombination and mutation, the descendants are
generated and their fitness is evaluated by CORSIM.
Using selection operator, the parents for the next
EVOLUTION STRATEGIES COMPARED TO GENETIC ALGORITHMS IN FINDING OPTIMAL SIGNAL TIMING
FOR OVERSATURATED TRANSPORTATION NETWORK
299
generation are selected and this process is continued
until the termination criteria are met.
To solve the problem by GAs, the initial
population is randomly generated and the fitness of
all individuals is evaluated (by CORSIM). Then
using selection operator, the mating pool is formed
and the individuals are crossed over and mutated to
form the next generation. The fitness of all
individuals in the new generation is evaluated by
CORSIM and this procedure is continued until the
termination criteria are met.
The problem is solved using a PC with Pentium
4 CPU with clock time of 3.2 GHz, and memory of 1
GB. Each run of the algorithm that contains 9000
times fitness function evaluations takes around 8
hours of CPU time. For each setting, three different
seeds are used: 12345701, 52345681, and 92345723
(unique numbers). For each seed, the fitness of each
generation is the maximum fitness of the population
in that generation and the average of these three
fitness values is the reported fitness value.
3 RESULTS
We made both ES and GAs algorithms to evaluate
the objective function 9000 times in order to get
comparable results. In the following sections, details
on fine tuning GA and ES will be presented and then
the two methods will be compared.
3.1 Fine Tuning GA
In order to get good results from GAs, GA
parameters were selected according to Goldberg et
al. (1993). Three different population sizes were
tested: 25, 75, and 300 corresponding to a small,
medium size, and large population respectively. For
all of these three population sizes, tournament
selection with replacement with two different
pressures was tested: 40%, and 10%. These selection
pressures correspond to a high and a low selection
pressure. The values of fitness function versus the
number of fitness function evaluations are presented
in Figure 2 separately for each population size.
For medium and large size populations (75
and 300 in case study), using a low selection
pressure results in better fitness values. The reason is
that a large selection pressure ends up selecting the
best individuals over and over and does not let other
individuals (that are less fit) to participate in
generating the next population. The less fit
individuals my pass some good genes and end up
creating a descendant with a higher fitness value. In
an extreme case, choosing a selection pressure of
100% forces the algorithm to choose the fittest
individual of the population each time. This setting
does not provide any good result and will be trapped
in a local optimum. On the other hand, a very small
selection pressure results in choosing parents almost
randomly. This way of choosing parents does not
pass the good genes to the next generation and does
not result in a significant increase in fitness value.
3500
3600
3700
3800
3900
4000
4100
0 5000
Fitness Value
No of Fitness Function Evaluations
SP = 40% SP = 10%
3500
3600
3700
3800
3900
4000
4100
0 5000
Fitness Value
No of Fitness Function Evaluations
SP = 40% SP = 10%
a) Population size = 25 b) Population size = 75
3500
3600
3700
3800
3900
4000
4100
0 5000
Fitness Value
No of Fitness Function Evaluations
SP = 40% SP =10%
3800
3850
3900
3950
4000
4050
4100
0 2000 4000 6000 8000
GA 25-40% GA 25-10% GA 75-40%
GA 75-10% GA 300-40% GA 300-10%
NoofFitnessFunctionEvaluations
FtinessValue
c) Population size = 300 d) All settings
Figure 2: Effects of SP on the value of fitness function for
different population sizes (*SP: Selection Pressure).
On the other hand, for a small population size, a
higher selection pressure should be used. The reason
is that when the population size is small (25 in this
case) a relatively small selection pressure (10%)
results in selecting only two individuals each time;
and then selecting the fittest of the two as one of the
parents. Figure 2 supports the above-mentioned
statements. When the population size is equal to 25,
setting selection pressure equal to 40% results in
better fitness values compared to setting selection
pressure equal to 10%. However, when the
population size becomes 75 or 300, choosing a
smaller selection pressure results in better fitness
values. Based on Figure 2, GA setting that provided
numerically better fitness values is GA 300-10%.
This setting has been chosen as the best setting in
GA.
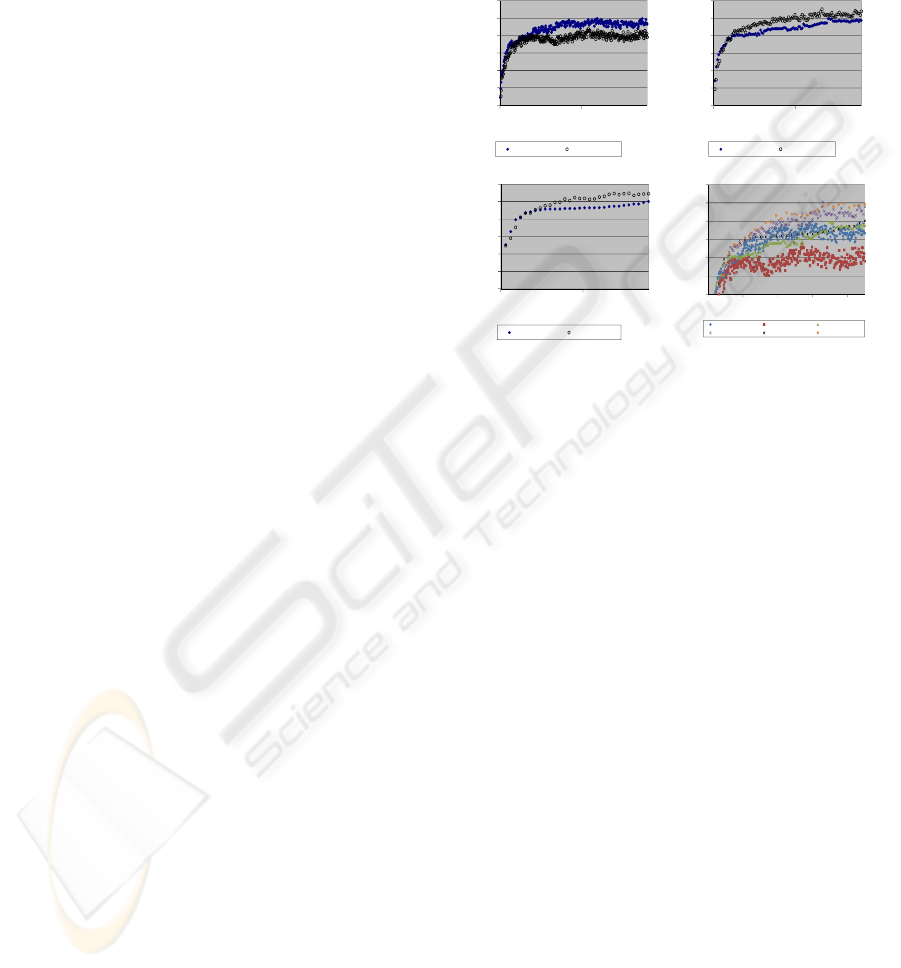
3.2 Fine Tuning ES
Six different settings were tested to fine tune ES.
These settings were chosen corresponding to the
setting used for GA. These six settings are: ES10,25,
ES4,25, ES30,75, ES7,75, ES120,300, and
ES20,300 and correspond to GA25-40%, GA25-
10%, GA75-40%, GA 75-10%, GA300-40%, and
GA300-10% respectively. As presented in Figure 3,
for small and medium size populations, large and
small µ/λ ratios result in very similar fitness values.
IJCCI 2009 - International Joint Conference on Computational Intelligence
300

However, when the population size is 300, similar to
GA, a µ/λ ratio of 10% produces a faster increase in
fitness value. Comparing different ES settings
reveals that ES30,75, and ES7,75 produced
numerically higher fitness values compared to the
other settings tested in this study.
3500
3600
3700
3800
3900
4000
4100
0 2000 4000 6000 8000
Fitness Value
No of Fitness Function Evaluations
ES µ/λ=40% ES µ/λ=10% GA SP=40%
3500
3600
3700
3800
3900
4000
4100
0 2000 4000 6000 8000
Fitness Value
No of Fitness Function Evaluations
ES µ/λ=40% ES µ/λ=10% GA SP=10%
a) λ = 25 b) λ = 75
3500
3600
3700
3800
3900
4000
4100
0 2000 4000 6000 8000
Fitness Value
No of Fitness Function Evaluations
ES µ/λ=40% ES µ/λ=10% GA SP=10%
3700
3750
3800
3850
3900
3950
4000
4050
4100
0 2000 4000 6000 8000
Ftiness Value
No of Fi tness Function Evaluati ons
ES 25 µ/λ=40% ES 25 µ/λ=10% ES 75 µ/λ=40%
ES 75 µ/λ=10% ES 300 µ/λ=40% ES 300 µ/λ=10%
c) λ = 300 All settings
Figure 3: Effects of SP on the fitness value for different
population sizes (*GA SP=10%: GA with SP=10%).
3.3 GA vs. ES
In Figure 3 for each ES population size, the
corresponding best GA setting for that population
size is plotted. This plot shows that for all three
population sizes tested in this study, GA
outperforms ES. For small population size (25)
ES10,25 results in higher fitness values during the
first 1000 fitness function evaluations, however, for
the rest of fitness function evaluations GA 25-40%
results in numerically higher fitness values. This
observation shows that for small population sizes,
ES may be able to find a good quality answer faster
than GA. For mid-size and large size populations,
GA with 10% selection pressure clearly produces
higher fitness values than both tested settings of ES.
4 CONCLUSIONS
This paper compares the effectiveness of ES to GAs
in solving signal optimization problem. Both
algorithms were tested on a small transportation
network of nine oversaturated intersections. We
compared six different ES settings with six different
GA settings and found out that both algorithms were
capable of solving the signal optimization problem.
Findings of this study showed that, GA
outperforms ES for all three different populations
sizes tested. The setting that produced the highest
fitness values was GA with 300 population size,
10% selection pressure, two-point crossover with
probability of 85%, and simple mutation with
probability of 1%. For small population size (25),
for the first 1000 fitness function evaluations ES
provided higher fitness values than GA. However,
for the rest of fitness function evaluations (9000
total), GA outperformed ES.
In fine tuning GA, for medium size and large
size population sizes, a low selection pressure (10%)
resulted in higher fitness value due to providing
enough diversity and conducting a more
comprehensive search in the feasibility area.
However, for a small population size, a large
selection pressure (40%) provides higher fitness
values compared to a low selection pressure (10%).
Comparing the fitness values of different settings
numerically indicates that GA with 300 population
size and 10% selection pressure, outperforms all
other GA settings.
In fine tuning ES, for 25 and 75 population sizes,
both selection pressures, 40% and 10%, result in
similar fitness values. For population size equal to
300, selecting a lower selection pressure provides
higher fitness values. Comparing different ES
settings revealed that ES 30,75 and ES 7,75 resulted
in highest fitness values compared to the other
settings.
REFERENCES
Abu-Lebdeh G., Benekohal R. F., 2000. Algorithms for
Traffic Signal Control and Queue Management of
Oversaturated Two-way Arterials. Transportation
Research Record 1727.
Chang T.-H., Sun H.-Y., 2003. Modeling and
Optimization of an Oversaturated Signalized Network.
Transportation Research Part B.
Giriana M., Benekohal R. F., 2004. Using Genetic
Algorithms to Design Signal Coordination for
Oversaturated Networks. Intelligent Transportation
Systems.
Schwefel H. -P., 1992. Imitating Evolution: Collective,
Two-Level Learning Processes. Explaining Process
and Change – Approaches to Evolutionary Economics.
Te University of Michigan Press, Ann Arbor, MI.
Goldberg, D. E., Deb, K., Thierens, D., 1993. Toward a
better understanding of mixing in genetic algorithms.
Journal of the Society of Instrument and Control
Engineers.
H. Beyer, Schwefel H., 2002. Evolution Strategies A
Comprehensive Introduction. Natural Computing.
Cluwer Academic Publishers.
Sanchez Medina J., Moreno M., Royo E., 2008.
Evolutionary Computation Applied to Urban Traffic
Optimization. Advances in Evolutionary Algorithms.
EVOLUTION STRATEGIES COMPARED TO GENETIC ALGORITHMS IN FINDING OPTIMAL SIGNAL TIMING
FOR OVERSATURATED TRANSPORTATION NETWORK
301
