
A LEARNING METHOD FOR IMBALANCED DATA SETS
Jorge de la Calleja
Department of Informatics, Polytechnical University of Puebla, Puebla, 72640, Mexico
Olac Fuentes
Computer Science Department, University of Texas at El Paso, El Paso, Texas, 79968, U.S.A.
Jes´us Gonz´alez
Computer Science Department, INAOE, Tonantzintla, Puebla, 72840, Mexico
Rita M. Aceves-P´erez
Department of Informatics, Polytechnical University of Puebla, Puebla, 72640, Mexico
Keywords:
Machine learning, Imbalanced data sets.
Abstract:
Many real-world domains present the problem of imbalanced data sets, where examples of one class signif-
icantly outnumber examples of other classes. This situation makes learning difficult, as learning algorithms
based on optimizing accuracy over all training examples will tend to classify all examples as belonging to the
majority class. In this paper we introduce a method for learning from imbalanced data sets which is composed
of three algorithms. Our experimental results show that our method performs accurate classification in the
presence of significant class imbalance and using small training sets.
1 INTRODUCTION
The class imbalance problem occurs when there are
many more examples of some classes than others.
Generally, classifiers perform poorly on imbalanced
data sets because they generalize from sample data
and output the simplest hypothesis that best fits the
data (Akbani et al., 2004). With imbalanced data sets
we will have biased classifiers that obtain high predic-
tive accuracy over the majority class, but poor predic-
tive accuracy over the minority class which is gener-
ally the class of interest. Some examples of applica-
tions with imbalanced data sets include text classifi-
cation (Zheng et al., 2004), cancer detection (Chawla
et al., 2002), searching for oil spills in radar images
(Kubat et al., 1998), detection of fraudulent telephone
calls (Fawcett and Provost, 1996), astronomical ob-
ject classification (de-la Calleja and Fuentes, 2007),
and many others.
We introduce a method for learning from imbal-
anced data sets composed of three algorithms. The
first algorithm over-samples the minority class exam-
ples. The second algorithm selects minority class ex-
amples from misclassified data for over-sampling. Fi-
nally, the third algorithm uses only the support vec-
tors given by SVMs with the purpose of reducing the
training set to construct the approximation in locally
weighted linear regression for classification. The re-
mainder of the paper is organized as follows. Section
2 describes related work to deal with imbalanced data
sets. In Section 3 we describe the proposed method.
In Section 4 we show experimental results, and finally
in Section 5 we present conclusions and future work.
2 RELATED WORK
Approaches to deal with imbalanced data sets can
be categorized into two groups: internal and exter-
nal approaches (Japkowicz, 2000). The first one
307
de la Calleja J., Fuentes O., González J. and M. Aceves-Pérez R. (2009).
A LEARNING METHOD FOR IMBALANCED DATA SETS.
In Proceedings of the International Conference on Knowledge Discovery and Information Retrieval, pages 307-310
DOI: 10.5220/0002305303070310
Copyright
c
SciTePress

consists of modifying or creating new learning algo-
rithms (Domingos, 1999; Japkowicz et al., 1995; Ku-
bat et al., 1998; Pazzani et al., 1994; Riddle et al.,
1994). In the second approach the original dataset
is re-sampled, either by over-sampling the minor-
ity class and/or under-sampling the majority class.
We now present some works related to our method.
Kubat and Matwin (Kubat and Matwin, 1997) pre-
sented a heuristic under-sampling method to bal-
ance the data set in order to eliminate noisy, border-
line, and redundant training examples of the major-
ity class, keeping the original population of the mi-
nority class. Japkowicz (Japkowicz, 2000) evaluated
the over sampling and under sampling techniques and
concluded that both were effective. Chawla et al.
(Chawla et al., 2002), devised a method called Syn-
thetic Minority Over-sampling Technique (SMOTE).
This technique creates new synthetic examples from
the minority class. SMOTEBoost is an approach in-
troduced by Chawla et al.(Chawla et al., 2003) that
combines SMOTE with the boosting ensemble. Ak-
bani et al. (Akbani et al., 2004) proposed a variant
of the SMOTE algorithm combined with Veropoulos
et al’s different error costs algorithm, using support
vector machines as the learning method. Hui Han
et al. (Han et al., 2005) presented two new minor-
ity over-sampling methods: borderline-SMOTE1 and
borderline-SMOTE2, in which only the minority ex-
amples near the borderline are over-sampled. Liu et
al. (Liu et al., 2006) proposed an ensemble of SVMs
with an integrated sampling technique, which com-
bines both over-sampling and under-sampling.
3 THE METHOD
Our proposed method is shown in Figure 1, which is
composed of three algorithms: M-SMOTE, SMMO
and SVM-LWLR. This method performs as follows:
given a data set, new examples are created using
M-SMOTE; misclassified examples are selected with
SMMO; and few training examples are selected using
SVM-LWLR, with the purpose of improving the per-
formance of classifiers on minority class examples.
3.1 M-SMOTE
This algorithm performs similarly to SMOTE
(Chawla et al., 2002), that is to create the new syn-
thetic positive examples we do the following: sepa-
rate positive and negative examples from the original
data set D. Find the n closest examples to each pos-
itive example, which have been weighted by the in-
verse of the distance from the positive example to the
M-SMOTE
SVM-LWLR
SMMO
Data set
Classifier
Figure 1: The method for learning from imbalanced data
sets. This method is composed of three algorithms: M-
SMOTE, SMMO and SVM-LWLR.
query example. For doing this, we only consider the
positive data set P. Then, we average these n closest
instances to obtain the mean example µ. After that we
take the difference δ between the minority example
and the mean instance, that is x
i
− µ. Later, we multi-
ply this difference by a random number σ between 0
and 1, to select a random point. Finally, we add the
new synthetic positive instance η to the original data
set D.
3.2 SMMO
Generally those examples closer to the boundary are
frequently misclassified, that is, they are more diffi-
cult to identify, and then more important for classi-
fication. Therefore, these examples may contribute
to train classifiers that alow us to correctly classify
more minority class examples. Selecting Minority
examples from Misclassified data for Over-sampling
(SMMO) performs as follows. We first train n clas-
sifiers C to create an ensemble C
⋆
, combining their
individual decisions by voting to obtain the classifica-
tion of the examples. Then, we select those misclas-
sified examples, m, that belong to the positive class to
create a data set M. Then, we only use the examples
in M to create new instances in order to obtain a more
dense positive space.
3.3 SVM-LWLR
Support vector machines calculate the optimal hyper-
plane by solving a constrained quadratic optimization
problem whose solution is obtained in terms of a sub-
set of training patterns that lie on the margin. These
training patterns, called support vectors, carry all the
relevant information about the classification problem
(Burges, 1998). Because we are interested in classify-
ing more minority class examples as well as using the
smallest training data set, we take advantage of these
KDIR 2009 - International Conference on Knowledge Discovery and Information Retrieval
308
support vectors. That is, we first used support vector
machines to find the subset of support vectors. Then
we used them as the training data set for the algorithm
of locally weighted linear regression.
3.4 Locally Weighted Linear Regression
Locally-weighted regression (LWR) belongs to the
family of instance-based learning methods. This kind
of algorithms simply store all training examples T,
and when they have to classify new instances x, they
find similar examples to them (Mitchell, 1997). In this
work we use a linear model around the query point to
approximate the target function.
4 EXPERIMENTAL RESULTS
In order to asses the effectiveness of the proposed
method, we tested it on ten different data sets from
the UCI Machine Learning Repository
1
. We selected
those data sets that do not have missing attribute val-
ues. Since most of these data sets have more than two
classes, we selected the class which has the fewest
examples to be the minority class, that is the positive
class, while the other examples were grouped to cre-
ate the majority class, that is the negative class.
In all the experiments reported here we used 10-
fold cross-validation and we use locally weighted lin-
ear regression as the machine learning method. We
want to notice that the over-sampled examples only
were used for training. We also vary the amount of
over-sampling in 100%, 400% and 1000% with the
purpose of analyzing how many examples are needed
to construct good classifiers. In addition, we use the
five closest examples to create the mean example for
M-SMOTE. The results we show later correspond to
the average of five runs.
Since accuracy is not a good metric for imbal-
anced data sets we evaluate our method using two
metrics used in information retrieval: precision=TP
/ (TP)+FP and recall=TP/(TP+FN).
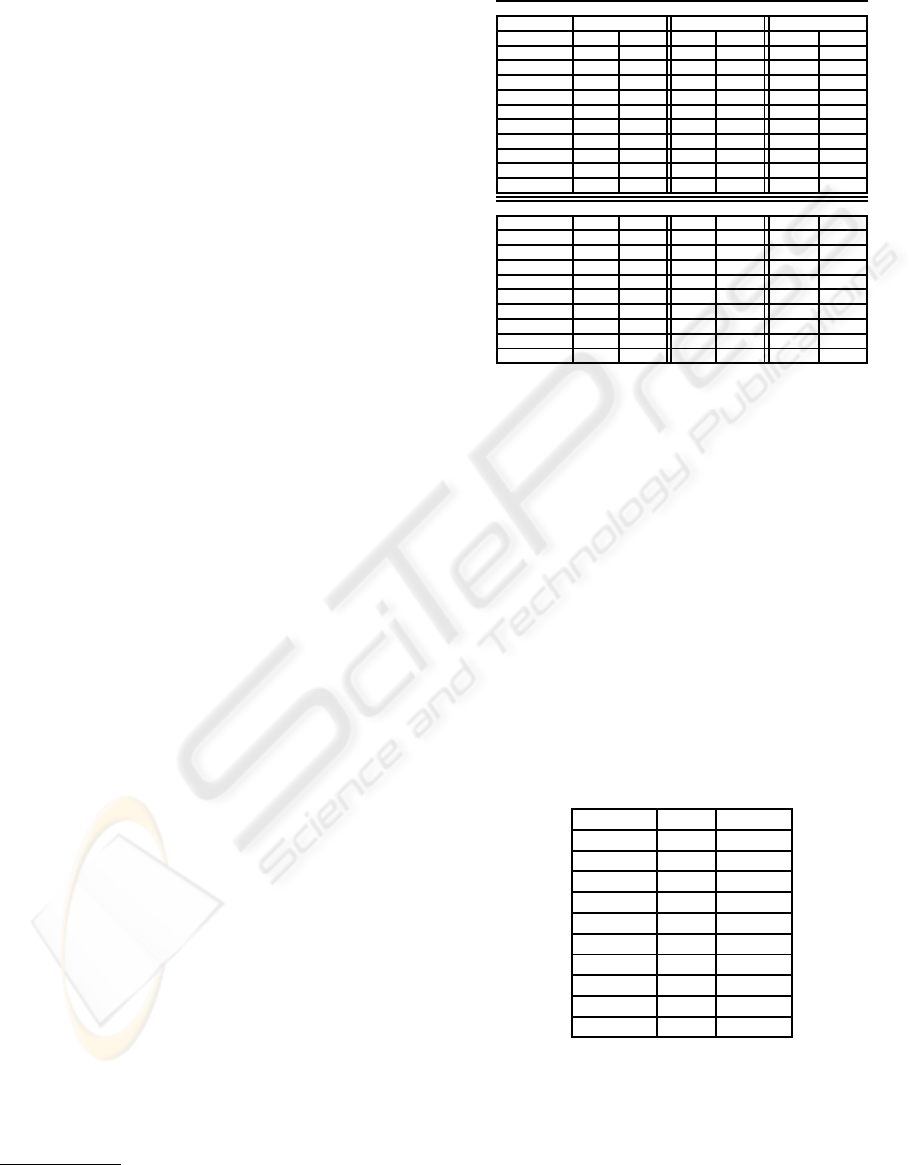
In Table 1 we show the performance of M-
SMOTE and SMMO varying the amount of over-
sampling. First, we can observe that for the case of
M-SMOTE, the best results using the recall metric
where obtained when data is over-sampled by 1000%;
when data is over-sampled by 100%, we obtained six
of the best results using the precision metric. Now,
for the case of SMMO, we can observe that in seven
data sets the best result for recall is at least .952, while
for precision there are five results over .945. The data
1
http://archive.ics.uci.edu/ml/
Table 1: Performance of M-SMOTE and SMMO varying
the amount of oversampling.
M-SMOTE
100% 400% 1000%
Rec. Prec. Rec. Prec. Rec. Prec.
balance .050 .141 .123 .180 .196 .230
car .448 .756 .798 .686 .851 .637
chess .988 .993 .992 .981 .987 .975
glass .887 .867 .855 .831 .878 .841
ionosphere .563 .687 .574 .743 .592 .775
nursery .802 .987 .982 .846 1.000 .645
thyroid .910 .861 .892 .871 .872 .876
tic-tac-toe .691 .996 .691 .819 .750 .692
wine .821 .718 .825 .686 .827 .661
yeast .322 .384 .391 .314 .441 .288
SMMO
balance .800 .743 .967 .545 .988 .517
car .974 .882 1 .692 1 .616
chess .995 .988 .997 .980 .997 .974
glass .952 .921 .952 .903 .917 .945
ionosphere .636 .730 .698 .727 .709 .774
nursery .944 .992 .994 .980 1 .812
thyroid .933 .880 .953 .967 .920 .842
tic-tac-toe .985 .999 .959 .873 .973 .774
wine .879 .736 .825 .701 .841 .746
yeast .603 .656 .692 .621 .736 .514
sets chess, glass, and nursery always obtained results
over .900 for both measure metrics.
The average of support vectors found and used as
data sets to train locally weighted linear regression
was between 22% and 49%. In all the experiments
we used a linear kernel function for support vector
machines. In table 2 we present the results of combin-
ing: M-SMOTE, SMMO and SVMs-LWLR. For do-
ing these experiments we only over-sampled the mi-
nority class by 1000%. From these results we can ob-
serve that two results are equal to the best ones when
using SMMO, that is for car and nursey. Also, two
results are better than the previous results obtained
when using M-SMOTE and SMMO, that is for chess
and wine, considering the recall metric.
Table 2: Performance of SVM-LWLR+SMMO+M-
SMOTE.
Recall Precision
balance .845 .672
car 1 .624
chess 1 .982
glass .921 .857
ionosphere .683 .713
nursery 1 .864
thyroid .873 .893
tic-tac-toe .738 .804
wine .928 .746
yeast .469 .417
5 CONCLUSIONS
We have presented a method for dealing with imbal-
anced data sets composed by three algorithms: M-
A LEARNING METHOD FOR IMBALANCED DATA SETS
309

SMOTE, SMMO and SVM-LWLR. These ones al-
lows us to increase the performance of the classifiers,
that is, it helps to correctly classify more minority
class examples. Future work include several tasks,
such as characterizing the potential benefits of over-
sampling methods and developing heuristics to deter-
mine, given a data set, the amount of over-sampling
that is likely to produce the best results; testing the
method in other real-world applications, for example,
biological structures, and morphological galaxy clas-
sification, where the imbalanced class problem is very
common.
ACKNOWLEDGEMENTS
First author wants to thank PROMEP for supporting
this research work under grant UPPUE-PTC-023.
REFERENCES
Akbani, R., Kwek, S., and Japkowicz, N. (2004). Applying
support vector machines to imbalanced datasets. In
Proceedings of the European Conference on Machine
Learning (ECML), pages 39–50.
Burges, C. (1998). A tutorial on support vector machines
for pattern recognition. Data Mining and Knowledge
Discovery, 2(2):121–167.
Chawla, N., Bowyer, K., Hall, L., and Kegelmeyer, P.
(2002). Smote: Synthetic minority over-sampling
technique. Journal of Artificial Intelligence Research,
16:321–357.
Chawla, N., Lazarevik, A., Hall, L., and Bowyer, K. (2003).
Smoteboost: Improving prediction of the minority
class in boosting. In Proceedings of the seventh
European Conference on Principles and Practice of
Knowledge Discovery in Databases (PKDD), pages
107–119.
de-la Calleja, J. and Fuentes, O. (2007). Automated
star/galaxy discrimination in multispectral wide-field
images. In Proceedings of the Second International
Conference on Computer Vision and Applications
(VISAPP), pages 155–160, Barcelona, Spain.
Domingos, P. (1999). Metacost: A general method for mak-
ing classifiers cost-sensitive. In Knowledge Discovery
and Data Mining, pages 155–164.
Fawcett, T. and Provost, F. (1996). Combining data mining
and machine learning for effective user profile. In Pro-
ceedings of the 2nd International Conference Knowl-
edge Discovery and Data Mining (PKDD), pages 8–
13.
Han, H., Wang, W., and Mao, B. (2005). Borderline-smote:
A new over-sampling method in imbalanced data sets
learning. In Proceedings of ICIC, pages 878–887.
Japkowicz, N. (2000). The class imbalance problem: Sig-
nificance and strategies. In Proceedings of the 2000
International Conference on Artificial Intelligence
(IC-AI’2000): Special Track on Inductive Learning,
pages 111–117.
Japkowicz, N., Myers, C., and Gluck, M. (1995). A nov-
elty detection approach to classification. In Proceed-
ings of the Fourteen Joint Conference on Artificial In-
teligence, pages 518–523.
Kubat, M., Holte, R., and Matwin, S. (1998). Machine
learning for the detection of oil spills in satellite radar
images. Machine Learning, 30:195–215.
Kubat, M. and Matwin, S. (1997). Addressing the curse of
imbalanced training sets: One sided selection. In Pro-
ceedings of the Fourteenth International Conference
on Machine Learning (ICML), pages 179–186.
Liu, Y., An, A., and Huang, X. (2006). Boosting predicion
accuracy on imbalanced datasets with svm ensembles.
In Proceedings of PAKDD, LNAI, number 3918, pages
107–118.
Mitchell, T. (1997). Machine Learning. Prentice Hall.
Pazzani, M., Merz, C., Murphy, P., Ali, K., Hume, T., and
Brunk, C. (1994). Reducing misclassification costs. In
Proceedings of the Eleventh International Conference
on Machine Learning (ICML), pages 217–225.
Riddle, P., Secal, R., and Etzioni, O. (1994). Representation
design and bruteforce induction in a boeing manufac-
turing domain. Applied Artificial Intelligence, 8:125–
147.
Zheng, Z., Wu, X., and Srihari, R. (2004). Feature selection
for text categorization on imbalanced data. In Pro-
ceedings of the SIGKDD Explorations, pages 80–89.
KDIR 2009 - International Conference on Knowledge Discovery and Information Retrieval
310
