
A Risk Assessment Application of a Real Time Decision
Support System Model for HAZMAT Transportation in
a Sustainable Oriented Motorway Environment
Giampaolo Centrone
1
, Maria Pia Fanti
2
Gabriella Stecco
1
and Walter Ukovich
1
1
Dipartimento di Elettrotecnica, Elettronica ed Informatica
Universit`a degli Studi di Trieste, Italy
2
Dipartimento di Elettrotecnica ed Elettronica
Politecnico di Bari, Italy
Abstract. The transportation of hazardous material on congested motorways is
an area of increasing concern for public safety and environmental awareness. This
paper aims at developing a methodology with an original approach in making an
attempt to encompass both professional experience and theoretical knowledge
with application oriented studies from disparate areas related to the commercial
transportation of HAZMAT on motorway, intimately linked with the “sustainable
transportation” paradigm. The main objective is to assess quantitatively the ac-
ceptability of the Individual and Societal Risks connected with the transportation
of HAZMATs. In addition, we propose a real time model of a Decision Support
System for HAZMAT transportation on a sustainable oriented motorway envi-
ronment. Finally, we offer an application of the proposed model. The case study
involves a stretch of A4 motorway in the North-East of Italy.
1 Introduction
Economic globalization favors the increase of geographic mobility involving the ex-
pansion of transportation systems that is joined with the rise in land prices and the
increase of air and noise pollution. In this world development [13], dangerous goods
are used in many processes in industry all over the world and this has been justified
by the economic revenue generated by their use. A dangerous good (named hazardous
material or HAZMAT almost exclusively in the United States) is any solid, liquid, or
gas that can harm people, other living organisms, property, or the environment. Due
to its nature, every production, storage and transportation activity related to the use of
HAZMAT have many risks for both society and environment and are often subject to
chemical regulations. In this scenario, a new factor has acquired more and more impor-
tance: sustainability. Sustainability [5] is a systemic concept that relates to the continu-
ity of economic, social, institutional and environmental aspects of human society. As
HAZMATs are transported throughout the world in a great number of road shipments,
their commercial transportation could be catastrophic and poses risks to life, health,
Centrone G., Pia Fanti M., Stecco G. and Ukovich W. (2009).
A Risk Assessment Application of a Real Time Decision Support System Model for HAZMAT Transportation in a Sustainable Or iented Motorway
Environment.
In Proceedings of the 3rd International Workshop on Intelligent Vehicle Controls & Intelligent Transportation Systems, pages 37-46
Copyright
c
SciTePress

property, and the environment due to the possibility of an unintentional release. Trans-
portation of HAZMATs on road actually represents a potentially high risk in regard to
the nature of the HAZMAT carried by trucks and the physiochemical events associated
with these materials (radioactivity, explosion, toxicity, corrosion etc.), the localization
and the density of the concerned (population, economic activities, buildings, networks,
infrastructures, natural areas etc.), the characteristics and state of the roads (topogra-
phy, layout, tunnels etc.), the density of the traffic, and the environmental conditions
(weather, natural events etc.). While HAZMAT accidents are rare events, in a sustain-
able vision of development it is necessary to integrate risk mitigation and prevention
measures into the transportation management in order to avoid the risks turning into
real events. In spite of this issue, HAZMAT type, quantity, itinerary and delivery time
are not precisely known by the public authorities, the highway and motorway compa-
nies, and the population. As a consequence, one of the main objectives of research in
this field is to provide appropriate answers to the safety management of HAZMAT ship-
ments, in collaboration with the principal parties involved in the goods transportation
process. Researches in this area [6], focuses on two main issues: i) to assess the risk
induced on the population by HAZMAT vehicles traveling on the road network; ii) to
involve the selection of the safest routes to take.
1.1 Problem Definition
In Italy about 80% of road traffic is represented by the delivery of goods, and the overall
trend in Europe seems to predict an increase of 30% within 2010. About 18% of this
freight traffic is currently represented by HAZMAT transportation, but a clear aware-
ness of HAZMAT transportation world flows on road and on the other transportation
modes - as well as of the related security and safety aspects - is not present yet, at least
from a social and economic point of view. Intelligent Transportation System technolo-
gies havealso made possible the gradual reduction in journey times and thus opening up
new economic horizons, with the conquest of wider markets. The freedom gained by the
ease of movement, however, has a cost in terms of environmental impact, quality of life
and safety. The risk is that the increasing demand for current and especially future can
make that the cost is no longer sustainable. However, the actual accident risk and impact
is not calculated. In addition, when, due to unforeseen events (traffic jams, accidents,
etc.), they need to change route, they do not have any particular guidance on the safest
alternative route. Motorways are one of the most important supporting infrastructures
of transportation networks: they assure efficient and safe mobility of persons and goods
in the world and represent the largest part of the built environment. Motorway is a term
for both a type of road and a classification or designation. Motorways are high capacity
roads designed to carry fast motor traffic safely. In the E.U. they are predominantly
dual-carriageway roads with a minimum of two lanes in each direction and all have
grade-separated access. Motorways are comparable with North American freeways as
road type, and interstates as classification. In Italy, according to [3], HAZMATs trans-
portation by road should require constant monitoring (tracking and tracing) of vehicles
and cargo handled. This requirement involves a series of obligations to which must
meet companies under the European Agreement concerning the International Carriage
of Dangerous Goods by Road (ADR). As a consequence, motorway concessionaires
must adopt real time systems to monitor HAZMATs carried and support the decisions
on the transportation (MAS Monitoring - Alarm - Alerts).
2 Problem Solution
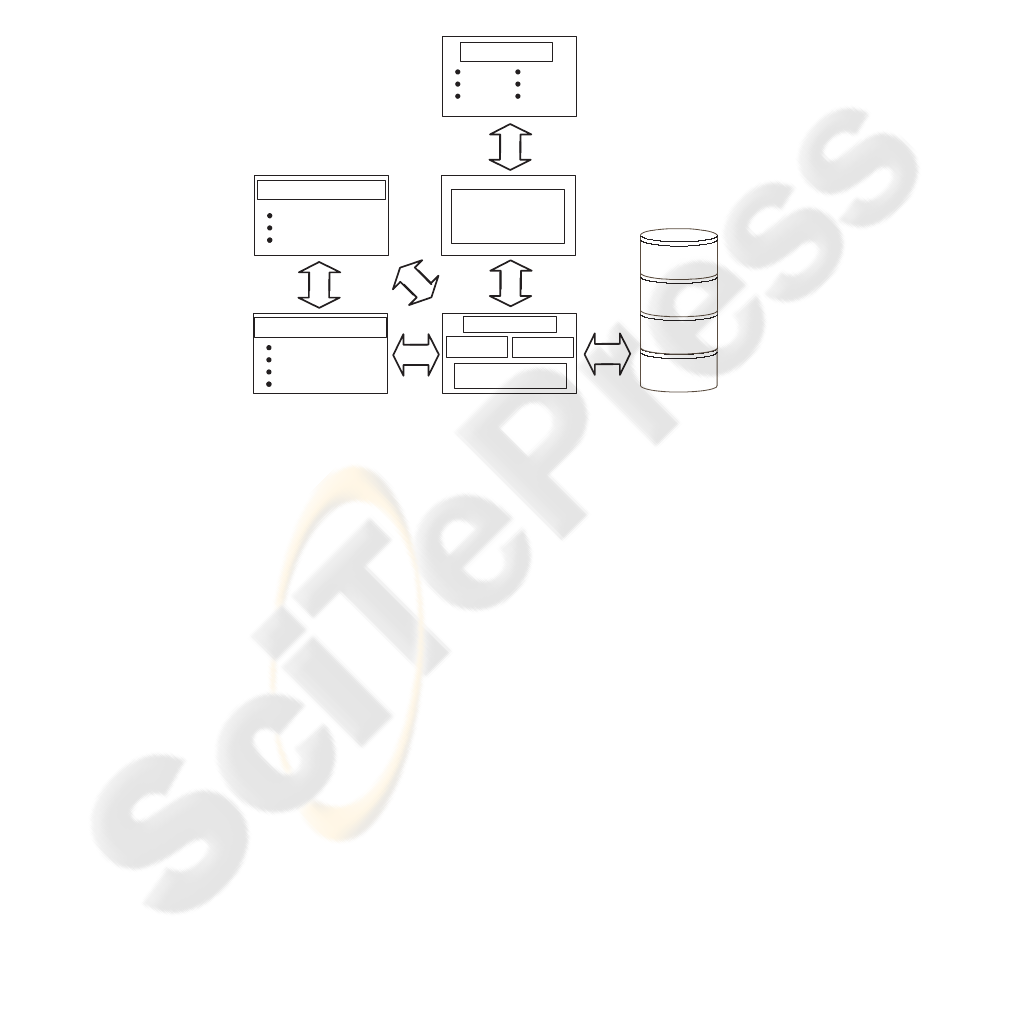
In Fig. 1 we propose a real time decision support system (DSS) model for monitoring
of HAZMAT vehicles, aiming at solving the above stated problems.
ALERTSISTEM
PMV
SMS
Radio
VVFF
PS
PC
INTERVENTION
PLANNING CRISIS
MANAGEMENT
RISK ASSESSMENT
INDIVIDUAL
SOCIAL
ALARP
thresholds
REAL-TIME MONITORING
Traffic situations
Weather conditions
Hazmat carried
SENSORS
Optical recognition
Meteorological-Station
Asim
GIS-distributed sensors
Historical
Incident Data
Hazmat
Data
Census and
population
Data
Operation
Procedures
Fig.1. The proposed System Architecture.
Such system should aim at calculating and evaluating in real time the individual
and societal risk related to the transit of HAZMAT on the motorway network. Then,
it should allow a monitoring in real time of the means transporting HAZMAT, a risk
assessment derived from the carriage, the alert and notification of emergencies, and an
anomalies reporting for a subsequent planned intervention. The model derives from the
application of the quantitative risk assessment (QRA) methodology presented in Fig.
2(a).
We must take into consideration the following cause-effect chain which can be associ-
ated to a vehicle transporting one or more HAZMATs: the vehicle may be subject to
a road accident (accident); the accident may cause the release of material transported
(release); the release may cause a series of events (incident); the incident has an effect
in the area surrounding the point accident. The model refers to damage to persons and
in particular to death. The model of risk assessment derived from road transportation of
HAZMAT is presented by a schematic representation in Fig. 2(b).
Risk assessment is typically structured as a process resulting from the interaction among
the transportation network (in this case motorway), the vehicle (or better the traveling
risk source), and the impact area. The model evaluates simultaneously the consequences
and the frequencies of occurrence of possible scenarios. This makes it possible to assess

Transportation Risk Analysis
Network
characterization
Utilization of risk
estimation
Risk estimation
Consequence
estimation
Likelihood
estimation
Release/scenario
analysis
(a) The Transport Risk Assessment
Methodology.
Impact on area
accident
Potential social
damage
Social Risk
Individual
damage
Individual Risk
Dangerous
substance release
Accident
Hazmat
Incident
(explosion,
expanding
vapor, jet fire,
etc.)
Parameters:
transportation network
mobile source of risk
geographical area
(b) The Risk Assessment Model.
Fig.2.
quantitatively the individual risk and the societal risk (if the distribution of the people
liable to be exposed is at hand). A complete assessment of the risks due to HAZMAT
by road would require to consider all the possible weather situations, all the kinds of
accidents, with all the types of vehicle partially or fully loaded. Such an evaluation
is completely impossible and some simplifications have to be introduced. The QRA
model is based on the following steps: choice of a restricted number of HAZMATs,
choice of some representative accidental scenarios implying those HAZMAT with their
usual packagings, identification of physical effects of those scenarios for an open air
or a tunnel section, evaluation of their physiological effects on road users and local
population, taking into account the possibilities of escape/sheltering, determination of
the yearly frequency of occurrence for each scenario.
F (N) curves and their expected values are the major outputs of the QRA model. Ac-
cording to [7], Frequencies / Gravity curves (F (N) curves) stand for the annual fre-
quency of occurrence F to have a scenario likely to cause an effect (generally, the
number of fatalities) greater than or equal to N and Expected value (EV) is the number
of fatalities per year, obtained by integration of a F (N) curve.
3 How to Characterize the Risk in Transporting of HAZMAT on
Motorway Environment: A Case Study
In this section we present an application of the real time model for the calculation of
the Individual and Societal Risks in a motorway environment.
The Transportation Network. We consider the motorway network of an Italian con-
cessionaire, in the North-East of Italy, S.p.A. Autovie Venete. In particular we refer to
the sections summarized in Tab. 1. The network under consideration has been modeled
as a network with nodes and links where nodes represent exits / junctions of the motor-
way and links the stretches (sections) of motorway between two exits / junctions. Let
N
link
be the set of links of the motorway network and l a generic link. For each link,

Table 1. Link length, average population density, HAZMAT and number of vehicles carrying
them on tested links.
Link Length Average Population Substance type Num. of
(Km) Density (inhab/Km
2
) Vehicles
S.Stino di Livenza - Portogruaro 12.8 214.35 Chlorine 2
Portogruaro - Latisana 13.5 166.05 Ammonia 2
Latisana - S. Giorgio di Nogaro 17.6 112.66 Hydrochloric Acid 2
Nitric Acid 2
the following data have been obtained: length [Km], and average population density [in-
habitants / Km], around the link. According to [18], the average population density has
been calculated using a GIS (Geographical Information System) overlapping the geo-
graphical map of the municipalities on the motorway network of S.p.A. Autovie Venete
in order to identify common cross on each link. Then, for each link, we have identi-
fied the municipalities involved and measured the kilometers of infrastructure that pass
through each town in order to identify the weights for calculating the average density
on the link. These weights have been derived by dividing the kilometers of infrastruc-
ture that affect each municipality with the total length of the link. Note the density of
population in each Italian municipality, using data on the census of 2001 [9], we shall
calculate the weighted average with weights determined in the previous step. Tab. 1
illustrates the links in discussion with the relevant data.
The Accident Probability. We use the Truck Accident Rate of Harwood [8] in order
to calculate the accident probability (λ
inc
(l)) in terms of e vents/(vehicle ∗ km). We
can also calculate the rate of accidents on a single stretch of length unit road by using
the number of accidents in a time period of ten years and the total distance traveled
by heavy vehicles during the same period, data provided by AISCAT (Associazione
Italiana Societ´a Concessionarie Autostrade e Trafori) [1].
T AR
y
r
=
A
y
r
V KT
y
r
(1)
where T AR
y
r
is the average accident rate for trucks events/(vehic le∗ km) on the Ital-
ian motorway network for year y
r
; A
y
r
is the number of accidents involving trucks on
the Italian motorway network; V KT
y
r
is the total distance traveled(vehicle-kilometers)
by trucks on the network under consideration. Tab. 2 shows the number of accidents in-
volving heavy vehicles, the total distance traveled and the Truck accident rate year by
year from 1997 to 2007 and the summary data (extension, routes) for the years under
consideration. The last row presents the data that we use in the model.
The HAZMAT. in the next step, we select the HAZMATs that will be considered in
calculating the risk. In particular, according to [16], we have considered substances that
are more frequent or significant on the network under consideration. For each of these
goods we obtained the following data (summarized in Tab. 3):
– the probability of release due to the accident (p
rel
(ν)) depending in general on the
characteristics of the vehicle transporting the HAZMAT and on the type of accident
where the vehicle is involved. This probability is taken from [2].

Table 2. Accidents and summary data year by year from 1997 to 2007.
ROUTES ACCIDENTS TAR
YEAR EXTENSION (veh. − km)
KM Heavy Heavy Heavy
1997 5371 1.4428∗10
7
7825 5.42∗10
−7
1998 5380 1.5161∗10
7
8854 5.84∗10
−7
1999 5380 1.5974∗10
7
10024 6.28∗10
−7
2000 5380 1.6790∗10
7
9681 5.77∗10
−7
2001 5388 1.7254∗10
7
9647 5.59∗10
−7
2002 5388 1.7836∗10
7
9691 5.43∗10
−7
2003 5388 1.8359∗10
7
9198 5.01∗10
−7
2004 5391 1.9059∗10
7
8841 4.64∗10
−7
2005 5432 1.9184∗10
7
9005 4.69∗10
−7
2006 5441 1.9764∗10
7
9000 4.55∗10
−7
2007 5446 2.0229∗10
7
8613 4.26∗10
−7
1.9403∗10
8
100379 5.17∗10
−7
– the types of possible releases classified in relation to the size of the leakage hole
(N
rel,t
(ν)) and the rate of release or the amount of material spilled (p
rel,t
).
– the types of consequences of incident caused by different types of release of HAZ-
MAT given the accident for a given type of substance (N
out
(ν, r)).
– the likelihood of occurrence of a final result given the incident (p
out
(i)). This prob-
ability is derived for each triplet [substance - leakage - type of final outcome] from
the information relating to incidents involving HAZMAT from 1997 to 2008 re-
ported in the HMIS database [14]. This database contains detailed information on
accidents involving HAZMAT in the U.S..
– the frequency of occurrence of a given scenario: f
scen
ν,t
(i, r) = λ
inc
· p
rel
(ν) ·
p
rel,t
(r) · p
out
(i)
– the lethal area radius of each pair [type of release - final outcome] calculated using
the free software RMPComp distributed by U.S. EPA (Environmental Protection
Agency) [15].
Assumptions. In the application we have considered the following assumptions.
1. λ
inc
(l) uniform throughout the link and constant for all links taken into considera-
tion: λ
inc
;
2. exposure area of danger circle type [7] centered at the point of the incident with a
radius depending on the type of substance, release and final outcome;
3. any person within the exposure area suffers from the same injury (death) in the same
way regardless of the position, while people outside that area are not affected;
4. the seasons (j), the weather conditions on link C
t
met
(l) and the wind direction ϑ
t
(l)
are not taken into account;
5. the simulation is performed on a single moment in time;
6. risk neutral model (α = 1) [17].
Individual Risk Calculation. The simulation was carried out on three adjacent links.
As individual risk is the annual probability of an individual placed in a designated point

Table 3. Frequency scenarios.
HAZMAT p
rel
Release
Type
(Spillage)
p
relt
Incident
Type
(Cloud)
p
out
Incident
Prob.
Scenario
Frequency
Lethal
area
radius
(Km)
Chlorine 0.010 Small 0.94 Toxic 1 9.40∗10
−3
4.86∗10
−9
1.0
0.010 Medium 0.04 Toxic 1 4.00∗10
−4
2.07∗10
−10
2.8
0.010 Large 0.02 Toxic 1 2.00∗10
−4
1.03∗10
−10
5.6
Ammonia 0.025 Small 0.93 Toxic 1 2.31∗10
−2
1.20∗10
−8
0.2
0.025 Medium 0.05 Toxic 1 1.33∗10
−3
6.88∗10
−10
1.0
0.025 Large 0.02 Toxic 1 5.32∗10
−4
2.75∗10
−10
2.1
Nitric Acid 0.015 Small 0.93 Toxic 1 1.39∗10
−2
7.19∗10
−9
0.3
0.015 Medium 0.06 Toxic 1 8.82∗10
−4
4.56∗10
−10
0.5
0.015 Large 0.01 Toxic 1 2.21∗10
−4
1.14∗10
−10
1.9
Hydrochloric Acid 0.015 Small 0.92 Toxic 1 1.38∗10
−2
7.13∗10
−9
0.3
0.015 Medium 0.05 Toxic 1 7.37∗10
−4
3.81∗10
−10
0.8
0.015 Large 0.03 Toxic 1 4.81∗10
−4
2.49∗10
−10
2.6
Table 4. Geographical coordinates of the points chosen for Individual Risk calculation.
Point Location Latitude Longitude
Portogruaro Centro 45.78 12.83
Area di Servizio Fratta Nord 45.80 12.88
Latisana Ospedale 45.77 13.00
Muzzana del Turgnano Centro 45.82 13.13
of interest is affected by some degree of damage as a result of a specific incident [10],
four points were chosen as “hot spots” at which to calculate the individual risk. Tab.
1 and 4 show respectively the links with the relevant substances circulating and the
geographical coordinates of the points chosen for the calculation of individual risk. The
network portion and the points under consideration are represented in Fig. 3.
For the calculations we have used the formula presented in [11] and [12] suitably mod-
ified to take into account the previous assumptions, the motorway environment and the
real time events. More details can be found in [4]. Consequently, we made explicit that
each event i belongs to the N
(out)
(ν) of the general model may consist of a pair [type
of release - final outcome] as in this case.
IRP =
N
links
X
i=1
N
veh
(l)
X
v=1
N
rel
(ν)
X
r=1
N
type
(l, ν)f
rel
(ν, r)·
·
Z
L
l
N
out
(ν,r)
X
i=1
p
out
(i) · V
Q(x)v→S
(i)dL
l
(2)
f
rel
(ν, r) = λ
inc
· p
rel
(ν) · p
rel,t
(r) (3)
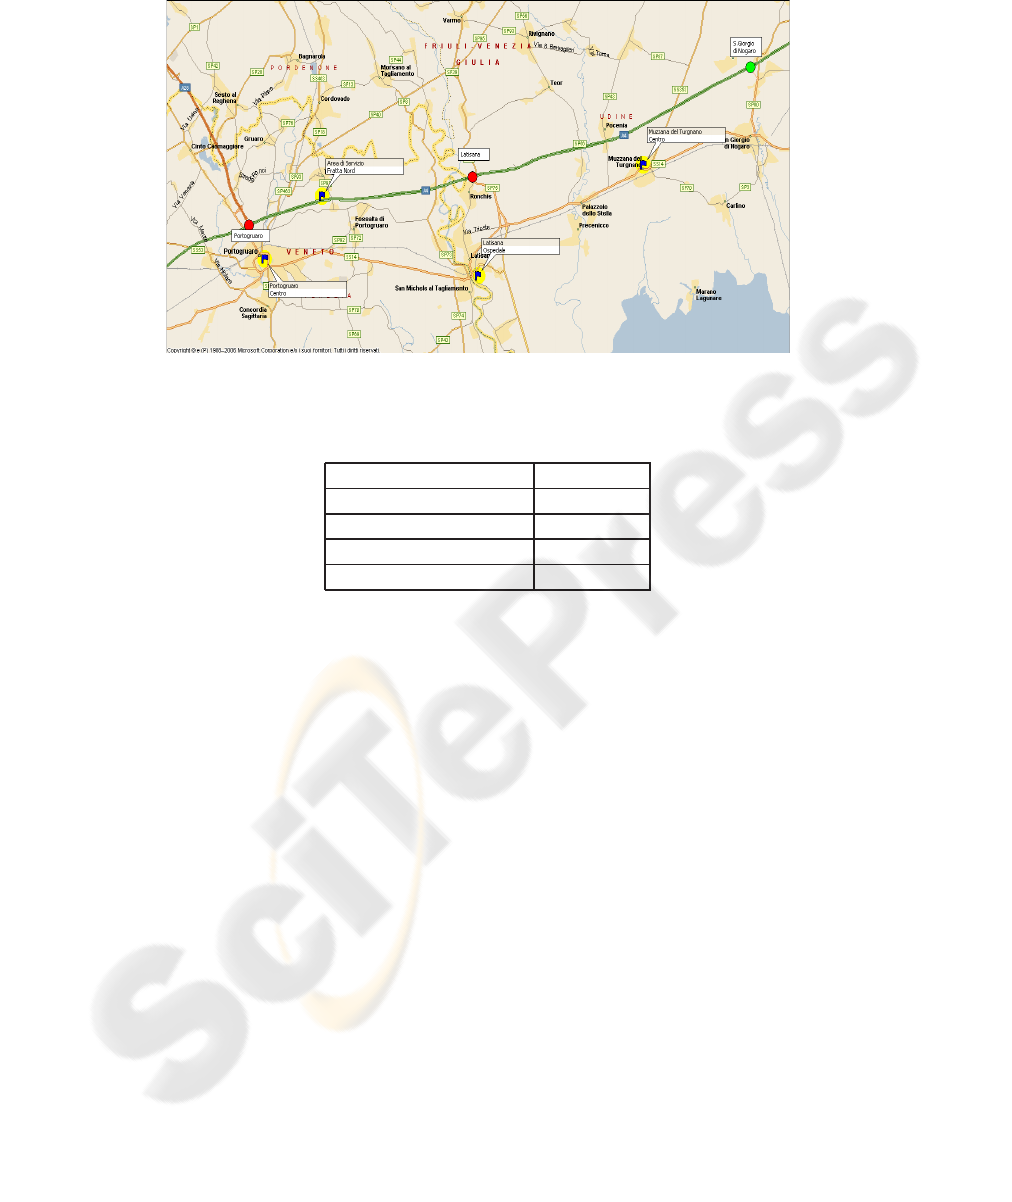
Fig.3. Representation of points and the network portion under consideration.
Table 5. Simulation results - Individual Risk.
Point Location Individual Risk
Portogruaro Centro 2.28∗10
−9
Area di Servizio Fratta Nord 5.78∗10
−9
Latisana Ospedale 0
Muzzana del Turgnano Centro 1.75∗10
−9
where N
veh
(l) is the number of different vehicle topologies on link l, N
type
(l, ν) is
the number of vehicles carrying the dangerous substance ν currently in transit on the
link l, N
rel
(ν) is the number of release cases of the dangerous substance ν, L
l
is the
route of link l and V
Q(x)
ν
→S
(i) is equal to 1 if the point S is inside the danger circle
centered at the point of possible accident Q related the triplet [substance - release type
- final outcome]; 0 if the point S is external the same danger circle. Line integral was
calculated using the method of Cavalieri-Simpson, dividing each of the three links in
10 intervals of equal length. Tab. 5 shows the results of the simulation.
From the evidence we can establish that the individual risk in the four points is accept-
able according to the British ALARP threshold as the value is much lower than the limit
value of 1 0
−6
[10].
Societal Risk Calculation. In order to calculate the societal risk, we refer again to [11]
and [12] suitably modified. For each link knowing the vehicles that are going through,
we use (4) to obtain the F (N) curves representation (for details see [4]).
F (N) =
N
link
X
i=1
N
veh
(l)
X
v=1
N
type
(l, ν) ·
N
out
(ν)
X
i=1
Z
L
l
δ
N
scen
(i, C
met
(l))dL
l
(4)
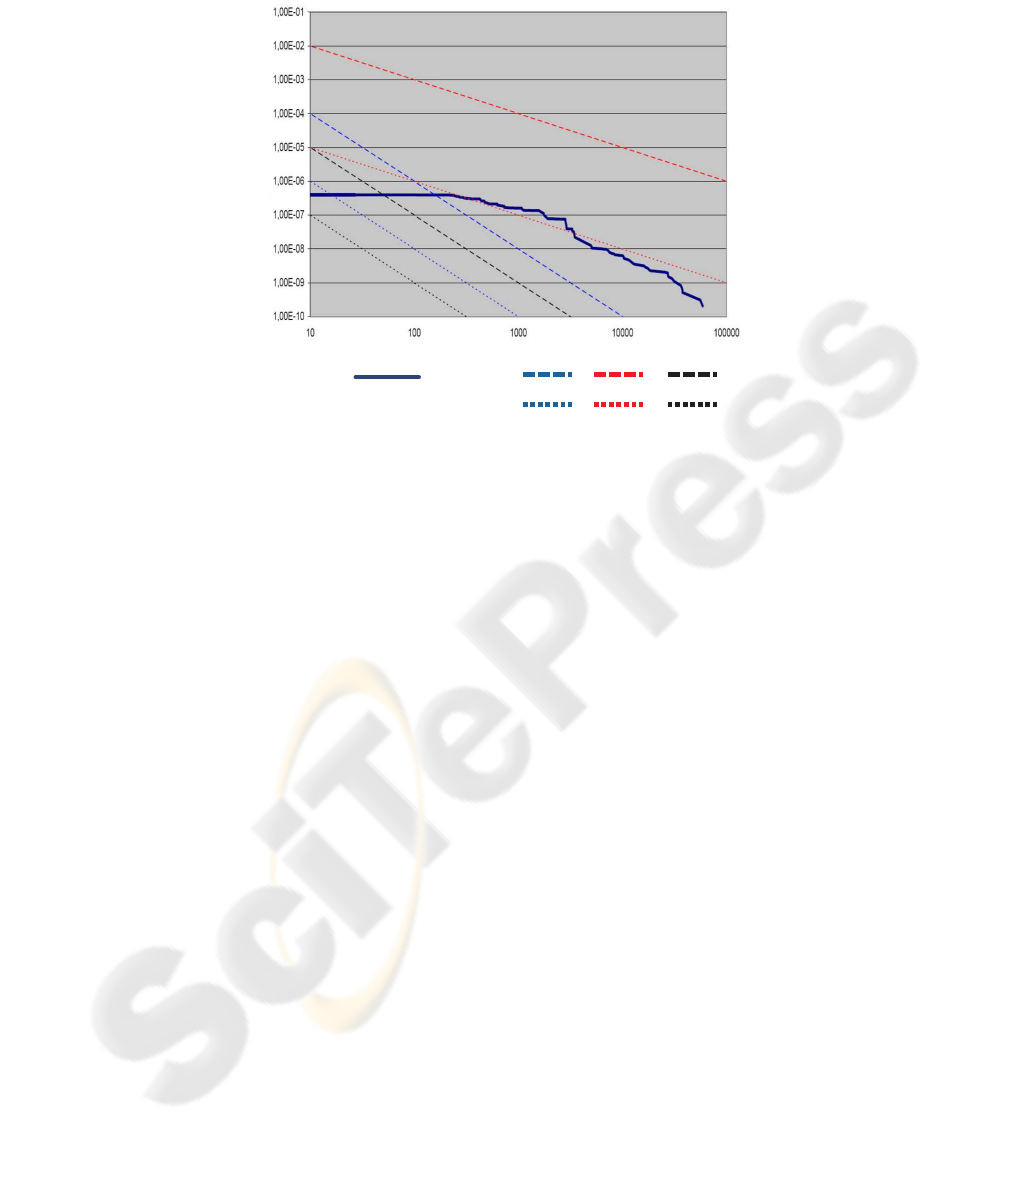
Number of deaths
C
u
m
u
l
a
t
i
v
e
F
r
e
q
u
e
n
c
y
F(N) curve Upper limit
Lower limit
Denmark U.K. Holland
Fig.4. Simulation results - Societal Risk.
The curve F (N ) is drawn in Fig. 4, referred to the simulation with different thresholds
of acceptability [12].
It can be seen that at the moment of the simulation the societal risk, according to
the British acceptability thresholds, is in the ALARP zone, whereas according to Dutch
and Danish thresholds it is not acceptable.
4 Conclusions
The transportation of HAZMAT on congested motorways is becoming an area of in-
creasing concern for public safety and environmental awareness. The risk to population
and damage to environment is a major concern to the general public and government
policy makers. Against these problems we present a methodology to perform the indi-
vidual and societal risk assessment related to HAZMAT transportation in a sustainable
oriented motorway environment. It constitutes an approach based on the GIS. The as-
sessment criteria, based on the “sustainable transportation” paradigm, are structured
into efficiency, cohesion and environmental criteria. The aim is assessing whether these
risks are acceptable and possibly, if they were not, notify the situation through alert
messages in order to take appropriate actions. We offered an application of the pro-
posed real time model for the calculation of the Individual and Societal Risks involving
in the case study a stretch of A4 motorway in the North-East of Italy. In spite of a
limited number of trucks transporting HAZMAT on the motorway, the results of the
application point out the concrete possibility to exceed the thresholds of the ALARP
limits for the societal risk.
With regard to possible developments, the QRA methodology could be to extend, in

particular the model for calculating the individual and societal risk, to other situations
of HAZMAT transportation by other transportation modes.
References
1. AISCAT: Rapporto incidentalit´a rete autostradale italiana 1997-2007. Statistiche Aiscat, As-
sociazione Italiana Societ´a Concessionarie Autostrade e Trafori, (2008)
2. Brown, D.F., Dunn, W.E.: Application of a Quantitative Risk Assessment Method to Emer-
gency Response Planning. Computers & Operations Research, 34 (2007) 1243–1265
3. CEI: Road traffic and transport telematics Standards framework. Review of the applications
and technological trends, normative references Annex to CEI UNI 70031 (2001) 1–18
4. Centrone, G.: Modeling a real time decision support system for HAZMAT transportation in
a sustainable oriented motorway environment. Ph.D. Thesis, Universit´a di Trieste (2009)
5. Centrone, G., Coslovich, L., Pesenti, R., Ukovich, W.: Social responsibility and sustainability
in motorway Corporate Governance. International Journal of Environment and Sustainable
Development 7 (2008) 94–113
6. Centrone, G., Pesenti, R., Ukovich, W.: Hazardous Materials Transportation: a Literature
Review and an Annotated Bibliography. In: Bersani, C., Boulmakoul, A., Garbolino, E.,
Sacile, R. (eds.): Advanced Technologies and Methodologies for Risk Management in the
Global Transport of Dangerous Good. NATO Science for Peace and Security Series, Vol. 45.
IOS Press, Amsterdam (2008) 33–62
7. Erkut, E., Tjandra, S.A., Verter, V.: Hazardous materials transportation. In: Barnhart, C.,
Laporte, G. (eds.): Transportation, Handbook in OR & MS, Vol 14. Elsevier (2007) 539–621
8. Harwood, D.W., Russell, E.R., Viner, J.G.: Procedure for developing truck accident and re-
lease rates for hazmat routing. Journal of Transportation Engineering 119 (1993) 189–199
9. ISTAT: Quattordicesimo censimento generale della popolazione italiana (2001).
http://cartema2.istat.it/home cartema/iisstart.htmh
10. Jonkman, S.N., van Gelder, P.H.A.J.M., Vrijling, J.K.: An overview of quantitative risk mea-
sures for loss of life and economic damage. Journal of Hazardous Materials 99 (2003) 1–30
11. Leonelli, P., G. Spadoni, G.: A new numerical procedure for calculating societal risk from
road transport of dangerous substances. In Proceedings SRAEurope Annual Meeting (1996)
243–246
12. Leonelli, P., Bonvicini, S., Spadoni, G.: Hazardous materials transportation: a Risk-analysis-
based routing methodology. Journal of Hazardous Materials 71 (2000) 283–300
13. Nederveen, A.A.J., Konings, J.W., Stoop, J.A.: Globalization, International Transport And
The Global Environment: Technological Innovation, Policy Making And The Reduction Of
Transportation Emissions. Transportation Planning and Technology 26 (2003) 41–62
14. PHMSA - U.S. Department of Transport: HMIS database. (2006)
https://hazmatonline.phmsa.dot.gov/IncidentReportsSearch/Search.aspx
15. RMP*Comp 1.07 http://www.epa.gov/OEM/content/rmp/rmp comp.htm
16. Rossetto, A.: Sviluppo di un sistema DSS per il monitoraggio e l’analisi quantitativa del
rischio nel trasporto di merci pericolose in autostrada. MSc. Thesis, Universit´a di Trieste
(2008)
17. Slovic, P.: Perception of risk. Science (1987) 280–285
18. Zhang, J.J., Hodgson, J., Erkut, E.: Using GIS to assess the risks of hazardous materials
transport in networks European Journal of Operational Research 121 (2000) 316–329
