
HYBRID OPTIMIZATION TECHNIQUE FOR ARTIFICIAL NEURAL
NETWORKS DESIGN
Cleber Zanchettin and Teresa B. Ludermir
Center for Informatics, Federal University of Pernambuco
Recife, PE - P.O.Box 7851, 50.732-970, Brazil
Keywords:
Global optimization, Artificial neural networks, Relevant feature selection, Experimental design.
Abstract:
In this paper a global and local optimization method is presented. This method is based on the integration
of the heuristic Simulated Annealing, Tabu Search, Genetic Algorithms and Backpropagation. The perfor-
mance of the method is investigated in the optimization of Multi-layer Perceptron artificial neural network
architecture and weights. The heuristics perform the search in a constructive way and based on the pruning of
irrelevant connections among the network nodes. Experiments demonstrated that the method can also be used
for relevant feature selection. Experiments are performed with four classification and one prediction datasets.
1 INTRODUCTION
This paper presents a global and local optimization
method. This method is based on the integration of
the heuristic Simulated Annealing (SA), Tabu Search
(TS), Genetic Algorithms (GA) and Backpropagation.
The performance of the method is investigated in the
simultaneous optimization of MLP architecture and
weights. The aim is to achieve topologies with few
connections and high performance in any dataset.
The proposed method present some interesting
characteristics: (1) search optimization for generating
new solutions; (2) pruning to eliminate connections
and optimize network size; and (3) the constructive
approach for finding the best network topology.
We investigate yet different cost functions for neu-
ral network training. Five cost functions will be in-
vestigated: (1) average method; (2) weighted aver-
age method; (3) weight-decay mechanism; (4) multi-
objective optimization strategy; and (5) a combination
of the weight-decay and multi-objective strategy.
Experiments demonstrated that the method can
also be used for relevant feature selection. During
the network topology optimization, input units may
be eliminated in accordance with the method perfor-
mance. Thus, a feature selection is obtained that is
inherent to the ANN optimization process.
The main configuration parameters of the method
also have their influence estimated by factorial exper-
imental design, through which it is possible to deter-
mine the influence, interaction and inter-relationship
among these parameters. These analyses are impor-
tant in identifying the influence of each parameter and
possibly reduce the number of adjusts in the project of
the method.
2 THE PROPOSED METHOD
The proposed method (GaTSa) is based on the inte-
gration of the heuristic SA, TA, GA and Backprop-
agation. The pseudo-code of the proposed method
and more implementation details are presented in
(Zanchettin and Ludermir, 2006). The next subsec-
tions presenting some important method implementa-
tion details for the paper.
2.1 Cost Function
Different from the constructive algorithms, which
generate a solution only at the end of the process, the
iterative algorithms derive possible solutions in each
iteration. The cost function is used to evaluate the per-
formance of successive iterations and select a solution
that minimize (or maximize) an objective function.
Different cost functions can be used to evaluate
the quality of a solution. In this work five ways of
performing cost evaluation were investigated:
Average Method. The technique uses the arith-
metic mean between the objectives to be optimized
in the problem. For classification problems, the cost
f (s) of the solution s is:
f (s) =
1
2
(E(P
t
) + ψ(C)) (1)
242
Zanchettin C. and B. Ludermir T. (2009).
HYBRID OPTIMIZATION TECHNIQUE FOR ARTIFICIAL NEURAL NETWORKS DESIGN.
In Proceedings of the 11th International Conference on Enterprise Information Systems - Artificial Intelligence and Decision Support Systems, pages
242-247
DOI: 10.5220/0002012102420247
Copyright
c
SciTePress

For prediction problems, the cost f (s) of the
solution s is given by the mean of the squared error
percentage (SEP) for the training set and the percent-
age of connections (ψ(C)) used by the network:
f (s) =
1
2
(SEP(P
t
) + ψ(C)) (2)
SEP = 100
o
max
− o
min
N
c
#P
t
#P
t
∑
p=1
N
c
∑
i=1
(φ(x)
pi
− γ(x)
pi
)
2
(3)
where o
min
and o
max
are the minimum and maximum
values of output coefficients in the problem repre-
sentation (assuming these are the same for all output
nodes).
Weighted Average Method. In experiments the
network parameters, network performance, network
connection percentage and percentage of hidden
nodes are weighted by the parameters α, β and κ,
respectively. For classification problems:
f (s) =
(E(P
t
) ∗ α) + (ψ(C) ∗ β) + (pN ∗ κ)
(α + β + κ)
(4)
For prediction problems:
f (s) =
(SEP(P
t
) ∗ α) + (ψ(C) ∗ β) + (pN ∗ κ)
(α + β + κ)
(5)
where pN is the percentage of used hidden node
connections, α = 1, β = 0.5 and κ = 0.25.
Weight Decay. Weight decay was initially proposed
as an implementation to improve the backpropagation
algorithm (BP) for the preference bias of a robust neu-
ral network that is insensitive to noise.
The weight decay mechanism is used in the
GaTSa cost function to eliminate solutions with small
weights that can be used by the artificial neural net-
work to code noise patterns and is implemented by:
f (s) =
1
2
∑
i
E(P
t
)+
1
2
ψ(C)+
1
2
µ
∑
i j
W
2
i j
/1 +W
2
i j
(6)
where µ is the parameter for the importance of the bias
term.
Multi-objective Optimization. Most problems
usually has no unique, global solution, but has a set of
equally efficient or non-inferior alternative solutions,
known as the Pareto-optimal set. Pareto-optimal
solutions consist of all solutions for which the
corresponding objective cannot be improved in any
dimension without degradation in another.
In the present work, the multi-objective strategy is
used in genetic operators to evolve the population of
solutions, considering two goals to be minimized - the
MLP size and generalization.
2.2 Feature Subset Selection
In the training and improving network weights and
connections, the method is able to eliminate input
connections of the neural network architecture. The
input processing node represents a feature of the
dataset. The input connections with the highest usage
frequency have the highest importance in the classi-
fication or prediction task and possibly inputs with
minor statistical relevance will be the first to be re-
moved. If the method eliminate all input connections
of one input processing node, this input is eliminated
of the network architecture.
In this way, the proposed method can be used to
feature subset selection, reducing the problem dimen-
sionality and consequently the complexity of the gen-
erated artificial neural network. We use the classical
feature selection methods Hill-Climbing, Random Bit
Climber, Best-First and Las Vegas, in a wrapper way,
to evaluate the performance of the proposed method
in optimal feature subset selection.
3 METHODOLOGY
Summary of the Used Data Sets. In experiments,
four classification simulations are performed: (1) The
odor recognition problem in artificial noses data set
(de Souza et al., 1999); (2) Diabetes diagnoses in
Pima indians data set (Blake and Merz, 1998); (3)
Fisher’s Iris data set (Anderson, 1953); (4) Thy-
roid dysfunction data set (Quinlan, 1987); and one
prediction simulation: (1) Mackey-Glass time series
(Mackey and Glass, 1977).
In Table 1 is presented a summary of the used
databases. In this table are shown: the number of ex-
amples; the number of binary (b), continuous (c) and
total (t) features; the number of binary (b) classes; and
the class entropy in bits per example.
Table 1: Characteristics of the used datasets.
Database Examples Features Class Entropy
b c t b c
Artificial Nose 5.400 0 6 6 3 0 1.5849
Iris 150 0 4 4 3 0 1.5849
Diabetes 768 0 8 8 2 0 0.9332
Thyroid 7.200 9 6 21 3 0 0.4468
MGlass 1.000 0 4 4 0 1 2.000
Training Methodology. The local training al-
gorithm used is the backpropagation method. The
learning rate was set at 0.001 and the momentum term
at 0.7. Each simulation contains 30 runs performed
with different random weight initializations. Training
HYBRID OPTIMIZATION TECHNIQUE FOR ARTIFICIAL NEURAL NETWORKS DESIGN
243

was stopped if: (i) the GL
5
criterion was satisfied
twice (to avoid initial oscillations in validation
errors); (ii) the training progress criterion was met,
with P
5
(t) < 0.1; or (iii) a maximum number of
iterations is reached.
Subset Selection - Classical Methods. In ex-
periments, we use different search strategies (For-
ward, Backward and Random), considering the char-
acteristics of the search technique. The Forward strat-
egy starts with the empty set and adds features. The
Backward strategy starts with the full set and deletes
features. The Random approach starts from a ran-
dom set and randomly performs the addition and re-
motion of features. Unlike the others, the Random
Bit Climber method has attributes removed and added
during the search process. Thus, in order to carry out
the the search in different directions, we used different
initial states - initial solution without features, with all
features and randomly selected features. The Las Ve-
gas and the proposed GaTSa methods implement their
own search strategies.
To determine the classification accuracy for the
classical methods (Hill-Climbing, Best-first, Random
Bit Climber and Las Vegas), a K-Nearest Neighbor
(k-NN) classification algorithm is used. In the k-NN
algorithm, the number of k is 7 defined empirically.
4 RESULTS AND DISCUSSION
For SA, TS and GA the maximal topology in the Ar-
tificial Nose data set (A) contains six input units, ten
hidden units and three output units (N1 = 6, N2 = 10
and N3 = 3, the maximum number of connections
(N
max
) is equal to 90). In the Iris data set (B) N1 = 4,
N2 = 5, N3 = 3 and N
max
= 32. For the Thyroid data
set (C) N1 = 21, N2 = 10, N3 = 3 and N
max
= 240.
In the Diabetes data set (D) N1 = 8, N2 = 10, N3 = 2
and N
max
= 100. In the Mackey-Glass (E) experi-
ments N1 = 4, N2 = 4, N3 = 1 and N
max
= 50. In
all neural network topologies, N1 and N3 values are
problem-dependent and N2 was obtained in experi-
ments from (Zanchettin and Ludermir, 2006). For
GaTSa, the same values for N1 and N3 are used, but
the value of N2 is optimized, together with the net-
work weights and connections, in a constructive man-
ner.
Figure 1 displays the average performance of each
optimization technique investigated. These results
were obtained for each technique in the optimization
of the number of connections and weight connection
values of an MLP artificial neural network. The pa-
rameters evaluated were: (1) Squared Error Percent-
age (SEP) and the classification error (Class) of the
test set; and (2) Percentage of network connections.
This figure displays the average results of 10 simula-
tions. Each simulation contains 30 different runs of
the algorithms.
Genetic algorithms, tabu search and simulated an-
nealing methods incorporate domain specific knowl-
edge in their search heuristics. They also tolerate
some elements of non-determinism, which helps the
search escape from local minima. The proposed in-
tegration combines these advantages in order to use a
larger amount of information in the problem domain
and apply this information to practically all search
phases. The initial solution is coded with a minimum
valid network topology and hidden nodes are inserted
in the network topology during algorithm execution.
This process is similar to constructive neural network
training and allows better topology selection. More-
over, the proposed methodology has two well-defined
stages: a global search phase, which makes use of the
capacity for generating new solutions from the ge-
netic algorithms, the cooling process and cost func-
tion of the simulated annealing as well as the memory
characteristics of the tabu search technique; and a lo-
cal search phase, which makes use of characteristics
such as gradient descending for a more precise solu-
tion adjustment.
For all data sets, the optimized neural network
obtain a lower classification error than those ob-
tained by MLP networks without topology optimiza-
tion (Zanchettin and Ludermir, 2006) and the mean
number of connections is much lower than the maxi-
mum number allowed. Greater number of simulations
the best performance to optimize MLP architecture
was obtained by the method GaTSa.
It is important to note that in experiments with
GaTSa the average of connections number was com-
puted in relation to the maximum network topology
generated, rather than being calculated with the max-
imum fixed topology (as in the other models). This
seemed to be the fairest approach, however, in some
ways its harmed the model, because most of the time
the proposed method has generated topology with less
connections than the maximum allowed.
Statistically, the GaTSa method achieves better
optimization of the architecture input nodes. The
MLP performance obtained from the optimized
neural networks was statistically equivalent for the
Thyroid, Diabetes and Mackey Glass data sets. The
GaTSa method obtained better results in the Artificial
Nose data set, whereas GA had the best performance
in the Iris data set.
GaTSa - The Cost Function Influence. Table 2
displays the experiment results, these values are the
average performance from 10 simulations. Each
ICEIS 2009 - International Conference on Enterprise Information Systems
244

Figure 1: Optimization technique performance.
simulation contains 30 different runs of the algo-
rithms. In this table, the evaluated cost functions are:
the Average method (Average), Weighted Average
(WA), Weight-Decay (WD), Multi-Objective (MO)
and the combination of Multi-Objective and Weight-
Decay (MO+WD). The parameters evaluated were:
(1) Squared Error Percentage (SEP) and the classifi-
cation error (Class) of the test set; and (2) Percentage
of network connections.
Table 2: Experiment Results.
Average WA WD MO MO+WD
A Class. (%) 11.86 11.08 7.55 7.04 12.62
Connec. 50.24 53.38 33.24 49.65 42.05
B Class. (%) 6.12 5.46 6.93 4.27 3.98
Connec. 13.38 16.13 18.11 15.86 9.80
C Class. (%) 7.10 7.17 6.81 6.92 6.86
Connec. 83.88 99.32 91.67 114.66 115.09
D Class. (%) 28.45 28.43 25.75 28.26 25.85
Connec. 31.84 38.18 31.74 43.27 42.03
E SEP Test 0.62 0.80 0.27 0.57 0.62
Connec. 2.15 2.54 2.08 3.63 3.32
In the Artificial Nose data set, the best classifi-
cation results were obtained by the multi-objective
approach and the best architecture optimization was
found by the weight-decay method. In the Iris data
set, the combination of weight-decay and genetic op-
erators using multi-objective optimization presented
the best performance. The weight-decay cost func-
tion presented the best optimization performance in
the Thyroid, Diabetes and Mackey-Glass data sets.
In some analyses, the Artificial Nose, Diabetes
and Thyroid data sets presented absolute determin-
istic and absolute random noise. The sources of ab-
solute deterministic noise are computational errors
and systematic measurement errors. Absolute ran-
dom noise is typical in optimization problems such
as adaptation, learning and pattern recognition. This
noise probably influenced the experiments, but the
average performance of the cost functions was con-
firmed.
The better performance of weight-decay demon-
strates the capacity of this method for restricting the
type of functionality that the network can produce by
favoring networks that produce smoother functions.
Smooth output functions are generally more likely to
represent the underlying functions of real-world data.
Moreover, the use of weight-decay can modify the er-
ror surface of a given problem in such a way as to
reduce the growth of large update values.
The use of multi-objective optimization in ge-
netic operators presented interesting results in some
data sets, but exhibited poor performance in most.
The problem was to choose the best solution when
there were several solutions with same position in
the Pareto ranking. In this case the solution with the
lesser classification error was chosen. However, there
is no guarantee that this solution has a small number
of connections. Possibly the best solution would be to
choose the best solution with the average of classifi-
cation error and the connections number.
The best problem search space exploration
was obtained with the use of the weight-decay
cost function in the experiment analysis. This
method generated solutions with low complexity
topology and low number of errors. The superior-
ity of the method was statistically verified in the
Mackey-Glass, Diabetes and Artificial Nose data sets.
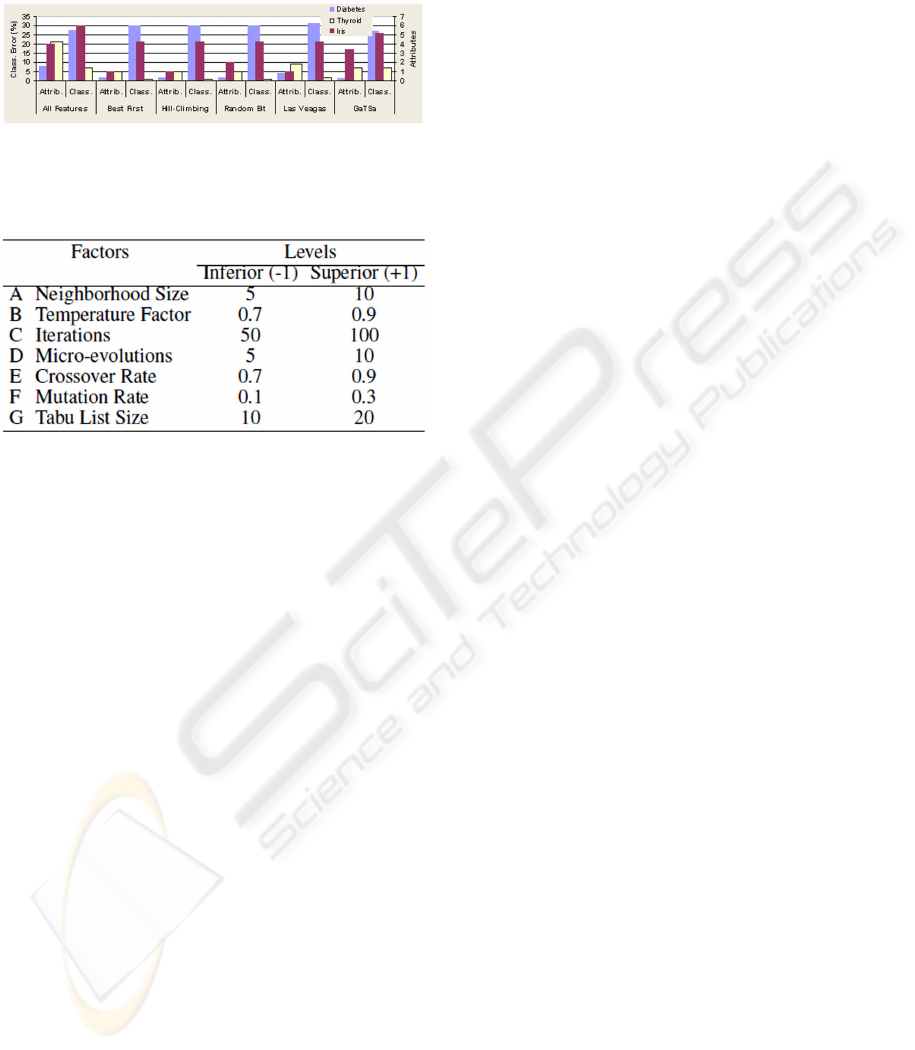
GaTSa - Feature Subset Selection. Figure 2
diplays the results of the k-NN classifier (for classical
methods) and MLP (for GaTSa method) in datasets
with all attributes. The labels Attrib. and Class.
means the number of features selected by the tech-
nique and classification performance, respectively.
The figure displays the best results of the average
performance - number of attributes following feature
selection and performance classification - of the meth-
ods, considering the results of the feature selection
technique with the Forward, Backward and Random
search strategies.
In experiments, the performance of the algorithms
was obtained in a 10-fold cross-validation process,
the same method used to evaluate the precision of the
HYBRID OPTIMIZATION TECHNIQUE FOR ARTIFICIAL NEURAL NETWORKS DESIGN
245
classifier with all features. The results of the random
strategy correspond to the average of 10 runs, due to
the random characteristics of this model.
Figure 2: Feature selection performance.
Table 3: GaTSa experiment configuration.
The Best-First method obtained interesting results
regarding feature selection. The k-NN classifier also
exhibited a good performance. In the Thyroid data
set, k-NN obtained better results than MLP fully con-
nected with all attributes (MLP obtained a 7.38%
classification error). The characteristics of the dataset
can explain these results. This database has a non-
balanced data distribution; the class probability dis-
tribution are 5.1%, 96.2% and 2.3%, respectively.
Different from the previous experiments, the Hill-
Climbing Forward variant obtained worse results than
the Backward and Random variants. The characteris-
tic of Forward strategy is the evaluation of a small
number of subsets. This tendency suggests a defi-
ciency of the method to escape from the local mini-
mum.
The superiority of Random Bit Climber over Hill-
Climbing method may demonstrate its lessor ten-
dency to become trapped in local minimums. The
Las Vegas algorithm uses brute force, creating ran-
dom subset solutions without any heuristics to opti-
mize the process. With this search strategy, the num-
ber of evaluations is high, even when the search space
is small. Nevertheless, random algorithms have found
interesting and relatively simple solutions to search
problems.
The simulations carried out with the Las Vegas
and Best-First algorithms (Random) obtained the best
results in Fisher Iris data set - where only one attribute
was selected. In the Thyroid and Diabetes data sets,
the best algorithms were Hill-Climbing and Random
Bit Climber (Random) - with two and five attributes
selected, respectively. The method classification per-
formance was similar in practically all experiments.
The classification degradation regarding the simula-
tions with all attributes was low.
The proposed GaTSa method obtained interesting
results in relevant feature selection. The method ob-
tained results very close to classical feature selection
methods in the investigated problems. Despite not
being specifically developed for relevant feature se-
lection, the GaTSa method, even though in a indi-
rect way, is able to eliminate non-relevant features to
learning algorithms.
Although the method shown promising results,
it was observed a difficulty of the model in getting
good performance when missing information in the
database is present and classification task is not per-
formed with low errors. This characteristic was ob-
served in some runs of the algorithm, in which the
network had not obtained a good performance of clas-
sification. This occurs because the elimination of con-
nections is not taking into consideration each input
node of the network. The elimination of an input node
only happens if all connections that connect this node
are eliminated. The unselection of a feature occurs
as a consequence of the process of connection reduc-
tion. The proposed method does not verify the con-
tribution of each input feature during the optimiza-
tion, because the emphasis is on the contribution of
each network connection. If the focus of the optimiza-
tion is the selection of relevant features the designer
could possibly consider other characteristics in terms
of cost function evaluation beyond the error classifi-
cation and the number of connections.
Design of Experiments. Design of experiments
(Montgomery, 2001) was applied in order to deter-
mine the factors with the greatest influence on the
systems performance. When analyzing the influence
of each of these parameters, the designer should pay
most attention to the ones presenting the values that
are statistically most significant. Thus, it should be
possible to avoid the necessity for a detailed analy-
sis of different configurations that might, in fact, lead
to the design of various models with very similar be-
havior patterns. We expect that a small amount of
parameters have great influence on the model average
performance.
In the study performed with GaTSa, we opted to
accomplish a factorial experiment with two levels (2
k
factorial experiment), seeking to reduce the amount
of experiments done. Table 3 presents the controlled
factors.
The analyses were accomplished in aleatory man-
ICEIS 2009 - International Conference on Enterprise Information Systems
246

ner. Seven control factors (variables) were consid-
ered, each one of them with two levels, resulting in
128 combinations. Each one of the levels combi-
nations of the control factors was accomplished five
times, totalizing 640 analyses. Due to random charac-
teristics of the model, each of the 640 analyses means
the average of 30 algorithm runs, so that 19.200 sim-
ulations were performed with the proposed method.
Through the variance analysis of the factorial ex-
periment, considering the statistical significance level
of 5% in the F distribution, 2 factors were identified
with larger influence on performance of the MLP op-
timize by the proposed model.
The more relevant factors are: Number of micro-
evolution in the genetic operators (D), corresponding
to ≈ 32.64% of the system variance; Genetic oper-
ators crossover rate (E), corresponding to ≈ 24.04%
of the variance. It was also identified the interaction
(variation among the differences between means for
different levels of one factor over different levels of
the other factor) among the factors: Number of micro-
evolution in the genetic operators (D) and Genetic op-
erators crossover rate (E), corresponding to ≈ 10.39%
of the system variance; and Neighborhood size (A)
and List tabu size (G), corresponding to ≈ 1.82% of
the total data variance.
It is interesting to note that despite the large
amount of configurable parameters of the method, just
few have significant influence on the performance of
the optimized artificial neural networks. This is an
interesting characteristic because even inexperienced
designers can achieve success in it use. The param-
eters most influent in the method performance were
the variables that control the solutions evolution in the
search space. The method is robust to other settings
because it did not significant changes in the networks
generated performance.
5 FINAL REMARKS
The proposed method has been developed as an gen-
eral iterative algorithm. Thus, it can easily be engi-
neered to implement any combinatorial optimization
problem. The performance of the proposed technique
is evaluated in the simultaneous optimization of the
number of connections and weight connection values
among processing units of the MLP. It is important
to remember that the problem investigated involves a
critical subject, the stability versus plasticity relation
in the training of artificial neural networks.
It was also evaluated the performance of different
cost functions in MLP training. Five cost functions
were evaluated, the best performance was obtained by
the weight-decay approach in the benchmarks inves-
tigated, which were composed of four classification
problems and one prediction problem.
Experiments also demonstrated that the method
can be used for relevant feature selection. During
the topology network optimization, input processing
units may be eliminated in accordance with the per-
formance of the method. Thus, a feature selection is
obtained that is inherent to the artificial neural net-
work optimization process. In simulations, we com-
pared the proposed method with the Hill-Climbing,
Random Bit Climber, Best-First and Las Vegas meth-
ods in three classification problems.
It was yet presented a study of the different
parameters involved in the design of the proposed
model. The design of experiments was used to an-
alyze and compare experiments by describing the
statistically interactions and interrelations between
proposed work parameters. The experiments indi-
cate that the most relevant parameters are number of
micro-evolution in the genetic operators and genetic
operators crossover rate.
Considering the data sets used in this work, the
method was able to generate automatically MLP
topologies with much fewer connections than the
maximum number allowed. The results also generate
interesting conclusions about the importance of each
input feature in the classification and prediction task.
1
REFERENCES
Anderson, E. (1953). The irises of the gasp peninsula. Bul-
letin of the American Iris Society, 59:2–5.
Blake, C. L. and Merz, C. J. (1998). Uci repository of ma-
chine learning databases. Technical report, University
of California, Irvine, CA.
de Souza, J., Neto, B., dos Santos, F., C. de Melo, M. S., and
Ludermir, T. (1999). Polypyrrole based aroma sensor.
Synthetic Metals, 102:1296–1299.
Mackey, M. C. and Glass, L. (1977). Oscillation and chaos
in physic. control systems. Science, 197:287–289.
Montgomery, D. C. (2001). Design and Analysis of Exper-
iments (Fifth Edition). John Wiley and Sons.
Quinlan, J. (1987). Simplifying decision trees. Int. Journal
of Man-Machine Studies, 27:221234.
Zanchettin, C. and Ludermir, T. B. (2006). A methodology
to train and improve artificial neural networks weights
and connections. In Int. Joint Conf. on Neural Net-
works, pages 5267–5274. IEEE Computer Society.
1
The authors would like to thank CNPq (Brazilian re-
search agency) for their financial support.
HYBRID OPTIMIZATION TECHNIQUE FOR ARTIFICIAL NEURAL NETWORKS DESIGN
247
