
A COMPUTER-AIDED METHODOLOGY FOR DIRECT AND
INDIRECT MONITORING OF THE LEARNING PROCESS
Erika Pigliapoco and Emanuele Lattanzi
Information Science and Technology Institute, Urbino University, Piazza della Repubblica 13, Urbino, Italy
Keywords: Computer-aided assessment, Learning process, Performance measurement, Assessment methodology.
Abstract: Learning is a complex process that needs to be carefully taken under control by assessing its outcomes
(direct monitoring) and by identifying the factors that might affect them (indirect monitoring). A large
number of well-documented assessment techniques is available, but they are heterogeneous in nature and
they are independently applied even within the same institution, so that they produce results which are not
suitable for comparison and cross-processing. This paper presents an integrated computer-aided
methodology that makes use of a comprehensive set of questionnaires (monitoring tools) administered
within a unified framework (software assessment tool) in order to gather coherent data sets on which
advanced statistical analyses can be performed. The applicability of the approach is demonstrated on a real-
world case study.
1 INTRODUCTION
Educational market is becoming more and more
competitive, thus imposing to universities to keep
pace with recent trends and to improve the services
they provide. As a consequence academic
institutions have to bend their efforts to carry out
direct and indirect monitoring. The former is aimed
at measuring students’ performance both during the
courses (formative evaluation) and at the end of the
courses (summative evaluation) (Gardner, 2005).
The latter is aimed at evaluating the set of factors
which affect students’ performance. This kind of
analysis provides information both to instructors and
staff members for improving courses (classroom
assessment) (Joyce et al., 1996) and to students for
enhancing their cultural and social growth (course-
embedded assessment) (Farmer & Donald, 1993).
Addressing monitoring issues entails the
development and application of suitable assessment
methodologies.
This paper presents an integrated approach to carry
out direct and indirect monitoring of the learning
process under a unified framework. Notice that this
work is not aimed at introducing a new software
tool. Rather, it is aimed at proposing a
comprehensive methodology for computer-aided
monitoring and assessment, pointing out the
distinguishing features that must be provided by any
software platform used to implement the
methodology.
The main objective of the proposed methodology is
to make available to the academic institution a
coherent set of data to be used not only to evaluate
specific indicators, but also to conduct advanced
correlation analysis and to identify causal
relationships to be used for improving the learning
process. The reliability of the data set is guaranteed
both by the scientific validation of the questionnaires
used as monitoring tools (taken from literature), and
by the adoption of a common computer-aided
framework to administer all of them.
The work is organized as follows: in Section 2 we
outline the methodology; in Section 3 we discuss the
application of the proposed approach to a blended
MS degree program used as a case study; in Section
4 we draw conclusions.
2 METHODOLOGY
The proposed methodology is based on three pilars:
using questionnaires taken from literature as a
recognized assessment tool;
performing advanced statistical analyses of all
available data;
33
Pigliapoco E. and Lattanzi E. (2009).
A COMPUTER-AIDED METHODOLOGY FOR DIRECT AND INDIRECT MONITORING OF THE LEARNING PROCESS.
In Proceedings of the First International Conference on Computer Supported Education, pages 33-40
DOI: 10.5220/0001949700330040
Copyright
c
SciTePress

adopting a common software platform for
addressing all computer-aided assessment
needs.
2.1 Direct Monitoring
Questionnaires are often used for direct monitoring
in higher education to verify student achievements in
learning: written exams are made of different types
of questions to assess the level of students’ final
knowledge on specific topics of the courses
(summative evaluation); self-evaluation tests are
delivered througthout an academic program to
make students aware of their progress in learning
(formative evaluation).
LCQ. Learning curve monitoring (LCM) has been
recently proposed as an advanced form of direct
monitoring based on a questionnaire (called LCQ)
covering all the topics of the degree program and
administered periodically (Pigliapoco & Bogliolo,
2008). The LCQ is composed of questions prepared
with the contribution of all the instructors, and it
provides two main direct indicators: the learning
value, which is the score obtained in a particular
administration, and the learning rate, which is the
slope of the learning curve between two subsequent
administrations. Each student becomes acquainted
with his/her own learning values and with the
average learning values of the population (i.e., the
cohort) he/she belongs to. The comparison between
individual and average values provides both
summative and formative self-evaluation
opportunities. Since LCQ is periodically
administered over the study program, each result
provides a summative feedback if referred to a
single period (e.g., the last academic year), and a
formative feedback if considered as a single
observation of a long-term process (e.g., the degree
program as a whole). Finally, the last point of the
learning curve, taken after completion of the study
program, provides summative information about the
overall achievements.
2.2 Indirect Monitoring
Indirect monitoring identifies the factors impacting
on student performance. In particular, students are
characterized by different attitudes towards teaching
and learning, different responses to the services they
benefit from, and different emotional involvement in
academic context. Literature suggests exploring all
these aspects by means of specific questionnaires
focusing on: learning styles (LSQ), customer
satisfaction (SQ), and psychological sense of
community (PSoC).
LSQ. Learning styles are “characteristic cognitive,
affective, and psychological behaviors that serve as
relatively stable indicators of how learners perceive,
interact with, and respond to the learning
environment” (Keefe, 1979). Several models have
been proposed over the years. A classification can be
suggested according to the different definitions
associated with the phrase “learning style” (Sadler-
Smith, 1997) which can be considered either as a
cognitive personality element (e.g. Witkin et al.
1977; Riding & Rayner, 1998), or as an information-
processing style (e.g. Kolb, 1984; Honey &
Mumford, 1992), or as a set of approaches to
studying (e.g. Entwistle, 1998), or as a set of
instructional preferences (e.g. Riechmann & Grasha,
1974). According to the second definition, Felder &
Soloman (1999) developed a model based on a
psychometric instrument called Index of Learning
Styles (ILS), which consists of a 44-item
questionnaire and a scoring sheet to be used by the
students to self-evaluate their own information
processing styles as active vs reflective, sensing vs
intuitive, visual vs verbal, and sequential vs global.
ILS is widely recognized (Zywno, 2003; Felder &
Spurlin, 2005) and it can be applied to: i) diagnose
and predict probable difficulties experienced by
some learners (Khaled & Baldwin, 2003), ii)
increase the support for learners having different
individual preferences, iii) tailor the teaching
methodology (e-learning, blended learning, face-to-
face learning) to learners’ approaches to study, and
iv) provide support for effective instructional design.
SQ. Customer satisfaction is typically sounded out
by means of questionnaires. Some studies (Wiers-
Jenssen et al., 2002) examine how overall student
satisfaction can be broken down into several
components referring to broader aspects of students'
learning experience. It has been demonstrated that
students who are satisfied with the pedagogic quality
of teaching, with the organizational and
administrative aspects of courses, and with the
physical infrastructures of institutions, not only have
better opinions about the academic program, but
they also have better performance in learning.
PSoC. Psychological sense of community is “a
feeling that members have to belonging, a feeling
that members matter to one another and to the group,
and a shared faith that members’ needs will be met
through their commitment to be together” (Mc
Millan & Chavis, 1986). Several approaches have
been proposed over the years to investigate PSoC by
CSEDU 2009 - International Conference on Computer Supported Education
34

means of questionnaires (Rovai, 2002; Pigliapoco &
Bogliolo, 2007).
Rovai (2002) introduced the so called Classroom
Community Scale (CCS) which uses a 20-item test.
The questionnaire takes into account the four
dimensions of PSoC which are spirit (friendship,
cohesion, bonding among learners), trust
(credibility, benevolence, confidence among
learners), interaction (honesty in feedback, trust, and
safety among learners), and common expectations
(commonality of the same goals, that is learning).
The answers to questions range in a [0-4] interval
corresponding to “strongly agree, agree, neutral,
disagree, and strongly disagree”. CCS distinguishes
between CCS connectedness (which represents the
feelings of the community of students regarding
their cohesion, spirit, trust, interdependence, and
social presence) and CCS learning (which represents
the feelings of community members regarding the
construction of understanding through discussions
and the sharing of values and beliefs) (Rovai, 2002).
Pigliapoco & Bogliolo (2007) elaborated two
alternative indicators: Membership and SCITT
(which stays for the dimensions of Spirit,
Commonality, Interaction, Trust granted and Trust
received) expressed in a [0-10] interval. Membership
corresponds to the score of the following direct
question asked to students: “How much do you feel
a member of a community?”. SCITT is an indicator
obtained from five questions asked to investigate the
dimensions of PSoC summarized in its acronym.
Recent studies have shown that PSoC felt by
students plays a key role in affecting their
performance (Picciano, 2002), satisfaction (Johnston
et al., 2005; Shea et al, 2002), and persistence (Carr,
2000; Frankola, 2001) in academic degree programs.
2.3 Statistical Analysis
The core of the proposed methodology is based on
the statistical analysis of collected data. To this
purpose we define a domain as a set of data gathered
from a sample the members of which share a
common feature. For instance, a domain can be
represented by the data collected from a group of
students belonging to the same cohort where the
academic year of enrollment is the feature shared by
all the members. Similarly, the distinguishing
feature of the data belonging to the same domain
could be the teaching methodology (e.g., e-learning,
face-to-face learning, blended learning). Notice that
the definition of domain given so far is completely
general, in order to be possibly tailored to any
parameter of interest.
Both for direct and indirect monitoring, the collected
data can be processed in three different ways called:
i) intra-domain analysis, ii) inter-domain analysis,
and iii) cross-processing.
Intra-domain analysis makes it possible to evaluate
the average trend and the variations of a particular
phenomenon within a single domain. For example,
given a set of LCQs filled in by students belonging
to the same cohort, it is possible to evaluate the
average learning trend of the cohort (by plotting the
average learning values over time) and its intra-
cohort variations (by computing standard deviations
within the cohort). In the same way, considering a
single topic of a course as the common feature of a
given domain, the intra-domain analysis can be
carried out to evaluate subject-specific learning (by
averaging the scores of all questions referred to the
given topic) or knowledge retention (by comparing
the scores achieved on the same topic over time).
Inter-domain analysis makes it possible to point out
differences/similarities between two or more
domains. For instance, in case of two domains
discriminated on the basis of the teaching
methodology, inter-domain analysis highlights the
differences between face-to-face students and
distance-learning students by comparing the average
values computed over the two different domains.
Finally, cross-processing allows us to capture
correlations between two or more phenomena taken
into consideration either in intra- or in inter-domain
analyses. For example, cross-processing can be used
to cross-validate two different assessment systems
(by computing correlations between LCQ results and
exam grades) or to point out the relationship
between different classes or subjects treated during
the course (by computing correlations between
subject-specific learning values).
2.4 Software Requirements
A software platform supporting the implementation
of the assessment methodology described so far
should provide specific features to enable: the
creation of any type of questions, the administration
of any type of questionnaires, the performance of all
the statistical analyses outlined in Section 2.3, and a
flexible management of access rights and
ownerships.
2.4.1 Questionnaires Creation
The software tool must allow privileged users (i.e.
tutors, instructors, and administrators) to create their
own sets of questions (such as open-text,
A COMPUTER-AIDED METHODOLOGY FOR DIRECT AND INDIRECT MONITORING OF THE LEARNING
PROCESS
35

single/multiple choice, true/false, cloze, Likert-scale,
…) possibly organized in MxN matrices in order to
capture multi-dimensional phenomena. Questions
must be stored in a relational database organized
into hierarchical sub-sets. Each set of questions
could be arbitrarily associated to an entire course, to
a single didactic module, or to a particular lesson.
Once question sets have been created, it should be
possible to define meta-questionnaires made up of
questions randomly or deterministically taken from
different sets.
2.4.2 Questionnaire Administration
Privileged users should be able to administer a
questionnaire by setting up a call which is
characterized by the meta-questionnaire to be
administered (a new instance of the questionnaire
will be generated whenever a new user opens it), and
by the following administration options:
supervised/unsupervised administration;
anonymous/personal filling-in;
evaluated/self-evaluated/not-to-be-evaluated
result.
In case of supervised administration, the tool should
provide a mechanism to ensure that the filling in of
the questionnaire can be made only upon explicit
authorization given by privileged users. Moreover,
in case of anonymous filling in (such as for customer
satisfaction questionnaires and LCQ) the software
must guarantee that all the users, included privileged
users, can not explicitly reveal students’ identities
even if encrypted IDs are managed by the database
in order to provide support for correlation analysis,
as outlined in the following subsection.
2.4.3 Statistical Processing
A set of statistical tools should be provided by the
assessment software in order to conduct data
analysis. First of all, the processing tool should be
able to calculate the score obtained on each question
both automatically and manually (i.e., with or
without instructor’s involvement). Moreover, the
processing tool should be flexible enough to allow
intra-domain, inter-domain, and cross-processing
analyses. For this reason, the data structure used to
represent question answers should contain a
reference to the corresponding question, to the set
the question belongs to, and to the user who gave the
answer (such a reference will be kept blind in case
of anonymous filling in).
2.4.4 Rights and Ownership Management
The management of data ownership and access
rights should enable the system administrator to
carefully decide who can: create questions, use
questions to create meta-questionnaires, set-up
administration calls, fill in a questionnaire instance,
evaluate a questionnaire report, access the results,
and perform statistical analysis.
3 CASE STUDY
The proposed methodolody was applied to a
European MS degree program in Urban
Comparative Studies, (hereafter denoted by E-Urbs)
organized by the University of Urbino, Italy,
together with 7 European academic institutions. E-
Urbs was delivered in a blended way which included
a face-to-face (F2F) summer school (lasting 3 ½
weeks, corresponding to 15 credits); 9 online (OnL)
courses (lasting 26 weeks, corresponding to 27
credits); an internship and a thesis preparation
(lasting 10 weeks, corresponding to 18 credits). The
24 students who enrolled in the program came from
14 countries with different cultural backgrounds.
A Feedback Management Tool (FMT) was
purposely developed by the University of Urbino to
meet all the requirements outlined in Section 2.4.
The FMT was implemented in Java and added as a
plugin to the e-learning management system adopted
in E-Urbs, in order to be used for the case study.
The application of the proposed methodology
entailed: i) the identification of well-known
questionnaires taken from literature to be used as
monitoring tools; ii) the implementation of the
monitoring tools of choice within the FMT; iii) the
data processing in terms of intra- and inter-domain
analysis; iv) the cross-processing of all the available
data. The four phases are detailed in the following
subsections, while some conclusions are drawn from
the case study in Subsection 3.5.
3.1 Implementation
Direct monitoring was carried out by means of
exams, self-evaluation tests and learning curve
questionnaire (LCQ); indirect monitoring was
performed by means of a learning styles
questionnaire (LSQ), a satisfaction questionnaire
(SQ), and a psychological sense of community
questionnaire (PSoC).
Exams were prepared by tutors and instructors as
online tests made up of multiple-choice and open-
CSEDU 2009 - International Conference on Computer Supported Education
36
text questions. The tests were administered at the
end of each teaching activity to evaluate students’
preparation.
Self-evaluation tests were prepared by tutors and
instructors and made available to students among the
resources associated with each lecture of each
course. All self-evaluation tests were compliant with
the same format adopted for final exams.
LCQ was made up of questions covering all the
topics of the master, prepared with the contribution
of all the instructors. Each instructor was asked to
prepare a thematic set of questions on the topics
covered by his/her own lectures. The questionnaire
was made up of questions randomly taken from each
set. The learning-curve questionnaire was
administered 3 times during the master (at the
beginning, at the end of the summer school, at the
end of the online courses) in order to build a
learning curve by plotting the average results as a
function of time/credits (ECTS).
LSQ was used to infer the learning style of the
students in order to make them aware of their
learning attitudes and to give them advise on how to
take advantage of the teaching activities of the
master. The Felder-Soloman’s model was applied to
the case study.
SQs were administered three times to monitor the
satisfaction of the students and the suitability of the
proposed teaching methodology at the end of the
summer school, at the end of the on-line courses,
and at the end of the master. Customer satisfaction
questionnaires were administered anonymously,
although students were requested to authenticate in
order to make sure they submitted the questionnaire
only once.
PSoC was sounded out according the CCS (both
CCS Connectedness and CCS Learning) and
SCITT/Membership. The questionnaires were
administered twice, at the end of summer school and
at the end of the on-line courses.
3.2 Organizational Aspects
From an organizational point of view, the
application of the methodology required:
the administration of all questionnaires to be
scheduled in advance, according to the timing
diagram reported in Figure 1;
StagesOnline coursesSummer school
LCQ
LSQ
PSoC
Satisfaction
PSoC
Satisfaction
Satisfaction
Exams
LCQ
Exams
LCQ
Self-evaluation tests
Direct
monitoring
Indirect
monitoring
StagesOnline coursesSummer school
LCQ
LSQ
PSoC
Satisfaction
PSoC
Satisfaction
Satisfaction
Exams
LCQ
Exams
LCQ
Self-evaluation tests
Direct
monitoring
Indirect
monitoring
Figure 1: Administration planning.
a common template to be developed and
adopted for all questionnaires;
a tutor to be appointed to provide guidelines and
assistance during question/questionnaire
preparation and management;
all instructors and tutors to be involved in
question preparation by means of constant
online interactions;
all questions to be gathered and organized in
thematic sets before the beginning of teaching
activities;
a face-to-face meeting to be organized in order
to make students, instructors and tutors aware of
the purposes of the methodology.
3.3 Intra and Inter Domain Analysis
For space limitations, in this subsection we present
only the most relevant results provided by the direct
and indirect monitoring tools applied to the case
study.
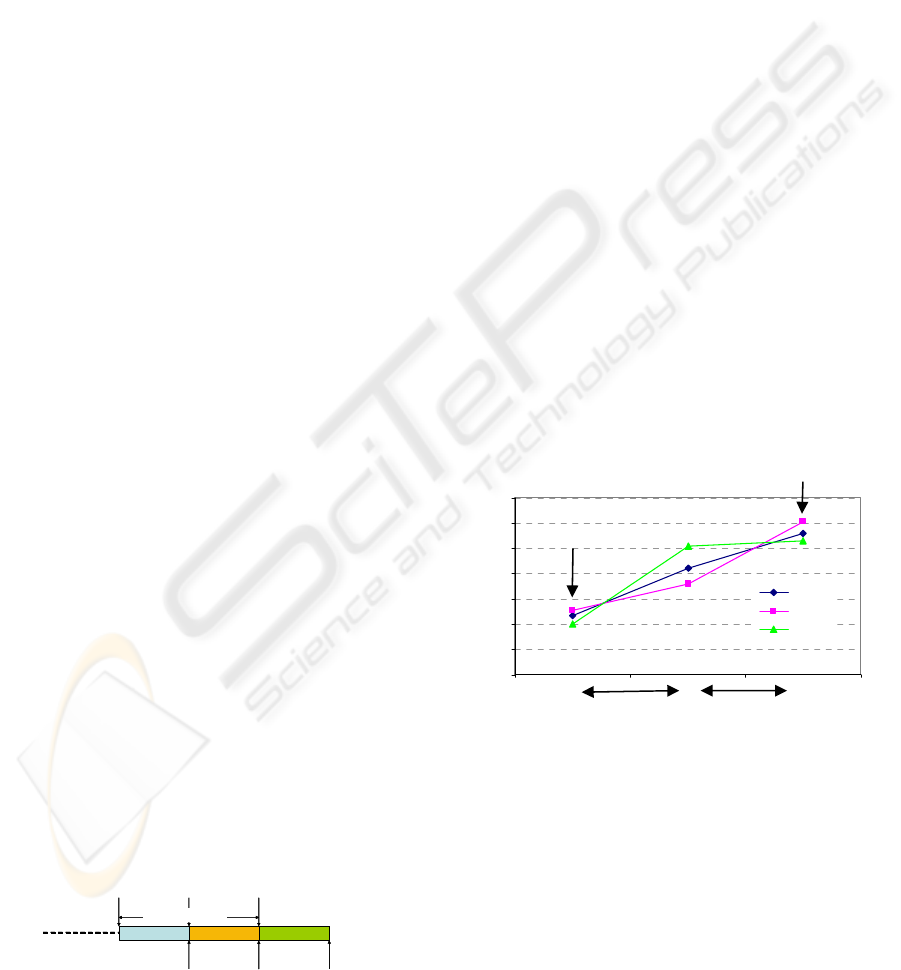
Direct Monitoring. The graph of Figure 2 shows
the average scores obtained by students in the LCQ
at the beginning of the master (LC1), after the face-
to-face summer school (LC2), and at the end of the
master (LC3). Both the overall added value of the
learning process and the individual contributions of
face-to-face and online activities can be easily
evaluated from the graph.
Figure 2: Learning Curve – Phases.
The blue diamonds refer to the results of the overall
questionnaire, while green triangles and pink squares
refer only to the scores of the questions covering the
topics of the face-to-face and online courses,
respectively.
As expected, the green curve grows much faster in
the first part, while the pink curve grows faster in the
second one. Notice, however, that there was a non-
negligible “crosstalk” effect between online and
face-to-face courses, so that face-to-face learning
activities provided a sizeable increase of the
Learning curve (phases)
0
0.1
0.2
0.3
0.4
0.5
0.6
0.7
LC1 LC2 LC3
"Learning value"
overall
OnL
F2F
F2F
OnL
initial background
outcomes
A COMPUTER-AIDED METHODOLOGY FOR DIRECT AND INDIRECT MONITORING OF THE LEARNING
PROCESS
37
knowledge on the topics covered by the online
courses, and vice versa. This can be explained both
in terms of induced learning and in terms of
correlation between the topics of the courses.
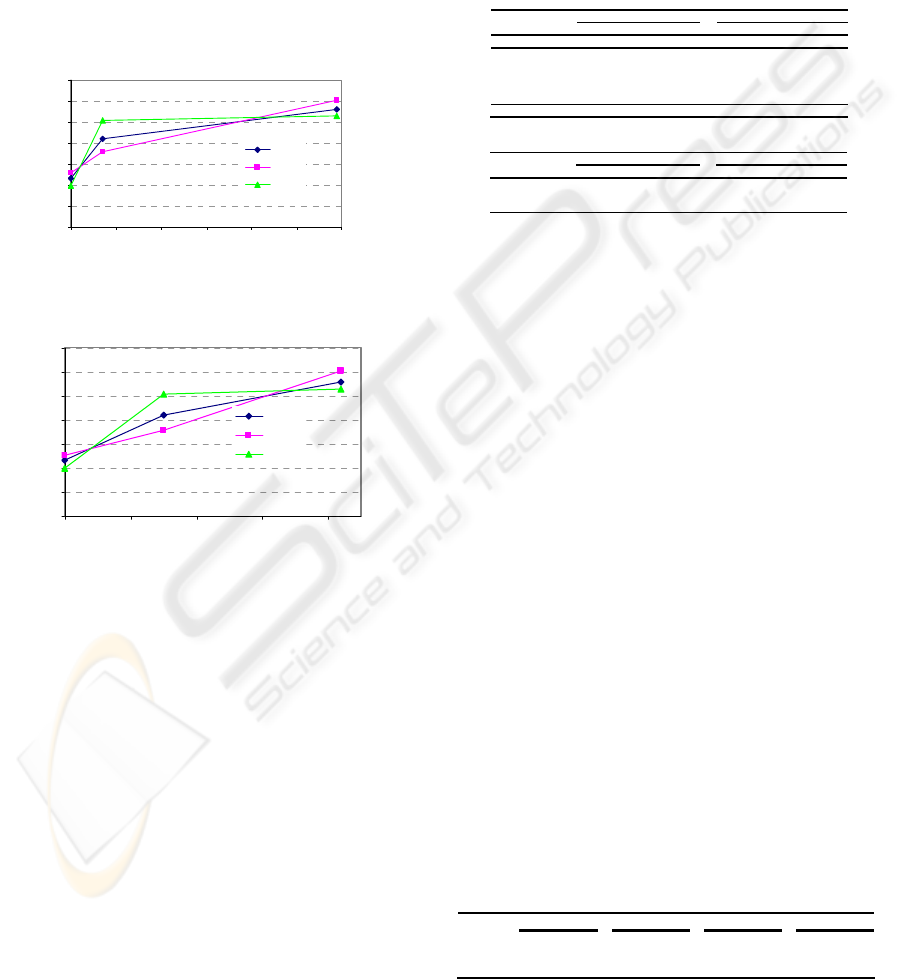
Figures 3 and 4 show the same learning curves,
plotted as functions of time (expressed in weeks)
and of credits (expressed in ECTs). Looking at curve
derivatives we observe that face-to-face activities
are more efficient than online activities in terms of
added knowledge per time unit, but the efficiency of
the two phases is similar if evaluated in terms of
credits.
Learning curve (time)
0
0.1
0.2
0.3
0.4
0.5
0.6
0.7
0 5 10 15 20 25 30
Weeks
"Learning value"
overall
OnL
F2F
Figure 3: Learning Curve – Weeks.
Learning curve (ECTs)
0
0.1
0.2
0.3
0.4
0.5
0.6
0.7
0 10203040
EC T s
"Learning value"
overall
OnL
F2F
Figure 4: Learning Curve – ECTs.
Indirect Monitoring. The results of the LSQ were
self-evaluated by each student by means of a scoring
sheet that allowed the user to determine his/her own
position in a 4-dimensional space. The axis of the
learning-style space are active/reflective
(ACT/RLF), visual/verbal (VIS/VRB),
sensitive/intuitive (SNS/INT), and sequential/global
(SEQ/GLO). According to the position in the space,
the model suggests how to take maximum advantage
of the learning activities. The sample under study
was not characterized by a common dominant LS,
since students revealed heterogeneous tendencies to
different styles. All the students were provided with
the scoring sheet reporting the suggested activities to
be carried out in order to compensate their personal
lack of balance among the 4 dimensions.
SQs allowed each student to express his/her own
opinion on several aspects of the master program,
and to assign a score to each course based on
interest, usefulness, difficulty, objectives,
instructor’s accessibility, instructor’s competence,
instructor’s clearness, readings, exams, study effort
and overall satisfaction. All the average scores were
above 2 in a 0-4 Likert scale.
Figure 5 shows two tables that report the values of
the PSoC indicators computed after the summer
school and at the end of the online activities.
PSoC indicators
Variables After Summer School After OnL courses
Mean St. Dev. Mean St.Dev.
Membership (1)
7,40
2,64
6,15
2,95
Spirit 7,45 2,21 7,42 2,1
Interaction 7,19 2,27 7,05 2,42
Trust granted 7,73 3,47 7,15 3,29
Trust received 7,73 1,56 6,42 3,05
Commonality 6,85 2,81 5,63 3,24
SCITT 7,39 6,73
CCS indicators
Variables After Summer School After OnL courses
Mean St. Dev. Mean St.Dev.
CCS
2,64
0,49
2,45
0,56
CCS Conn 2,80 0,87 2,55 0,93
CCS Learn 2,48 0,46 2,35 0,67
Figure 5: Psychological Sense of Community indicators.
We can observe that the Summer School was very
useful for the development of a strong sense of
community among students. Most students pointed
out this aspect also in the free-comment field of the
SQ:
“The building of community between people of
different backgrounds is very good”;
“Main strength is the opportunity to discuss,
interact, and meet the other students”;
“Strength: multidimensional group, age, origin,
educational background”.
“Opportunity to create a lively network with many
brilliant people of similar interests and goals”.
PSoC slightly decreased during online courses since
geographical distance affected transactional distance
(Moore, 1993).
Standard deviation is quite small if compared with
sample averages, meaning that students experienced
quite uniform feelings.
3.4 Cross Processing
The correlations between learning styles and
learning curves were computed in order to find out
the learning styles providing the best performance in
face-to-face and online courses.
Correlation LCQ vs LSQ types
RFL ACT SNS I NT VIS VRB SEQ GLO
LC F2F 0,31
-0,32 -0,17
0,29
0, 38
-0,35 -0,01 -0,06
LC OnL
-0,12
0,34
0, 22
-0,13 -0,14
0,12
-0,36
0,31
LC Overall
0,01 -0,03
0, 38
-0,41 0,17 -0, 27 0,16 -0,08
Figure 6: Correlation between LSQ and LCQ.
CSEDU 2009 - International Conference on Computer Supported Education
38

Figure 6 reports the correlation coefficients
computed for each learning style against three
different learning rates obtained from LCQs: F2F
(computed only on questions related to the summer
school), OnL (computed only on questions related to
the online courses) and Overall (computed on the
average of all questions).
Interestingly enough, the most effective learning
styles in OnL courses are the opposites of the most
effective ones in F2F courses: RLF, INT and VIS for
face to face activities, ACT, SNS, VRB and GLO
for online activities. Finally, SNS resulted to be the
most effective style for learning persistence. The
correlation between PSoC indicators and learning
styles was studied in order to understand if the
learning style might have affected the psychological
sense of community. The only significant result
obtained from the available data was a positive
correlation between CCS and RFL, SNS, VIS, SEQ.
Interestingly, such correlation was independent of
the teaching method (F2F and OnL). Psychological
sense of community is considered to play an
important role in students’ performance. This
general statement was confirmed by the positive
correlation (0.26) between CCS and learning rates.
3.5 Discussion on the Case Study
The most critical aspects of the proposed
methodology that emerged from the case study were
the adoption of a common template for the questions
prepared by all tutors and instructors for exams and
self-evaluation tests, and the need for having all
question sets prepared before the beginning of the
courses. Facing these criticalities required a huge
coordination effort at the very beginning of the
activities and imposed to the instructors to think
about the evaluation criteria for their courses much
earlier than they expected.
On the other hand, this kind of methodology
provided the key advantage of enabling a uniform
and comprehensive monitoring of the learning
process and induced a better planning of the
teaching activities.
Another issue was the statistical significance of the
results provided by the feedback tools. In fact, the
sample composed of the 24 students of the master
was sufficient to guarantee the significance of intra-
and inter-domain first-order statistics, while it was
too small to guarantee the significance of cross-
processing second-order statistics.
Nevertheless, the case study demonstrates the
applicability of the proposed approach, its
adaptability to specific assessment needs, the added
value of the integration of all monitoring tools
within a unique framework, and the possibility, for
the academic institution, to take advantage of the
overall methodology. For instance, in a future
edition of the Master, ad hoc activities could be
organized to encourage socialization among students
and enhance PSoC, additional support could be
provided to students according to their LSs, didactic
periods could be rescheduled according to the results
of LC and SQ.
In conclusion, not only student perfomance could be
increased by taking under control both the outcomes
and the factors impacting on them, but a generalized
improvement of the educational process could be
pursued by academic institutions.
4 CONCLUSIONS
In this paper we have presented a comprehensive
assessment methodology that makes use of
questionnaires to address both the direct and indirect
monitoring needs of a learning process, in order to
make available to the educational institution a
coherent set of data to be used for conducting
advanced statistical analysis.
The proposed methodology is general in nature, in
that it can be applied in any context to address any
monitoring need for which a suitable questionnaire
exists or can be conceived. The generality of the
approach has not to be confused with the generality
of the results it produces. In fact, if the flexibility of
the methodology is fully exploited to address
context-specific monitoring needs, then the results
could not have necessarily a universal validity, in
spite of their significance within the targeted
application field.
The proposed methodology has been described in
detail by pointing out its distinguishing features, by
outlining the requirements of the software tools to be
used to implement it, and by underlying the
scientific value of questionnaires used as monitoring
tools in education. The applicability of the approach
has been demonstrated by means of a real world case
study.
REFERENCES
Carr, S., 2000. As distance education comes of age, the
challenge is keeping the students. The Chronicle of
Higher Education, 46(23), A39-A41.
Entwistle, N.J., 1998. Improving teaching through
research on student learning. In JJF Forrest (ed.)
A COMPUTER-AIDED METHODOLOGY FOR DIRECT AND INDIRECT MONITORING OF THE LEARNING
PROCESS
39

University teaching: international perspectives. New
York: Garland.
Felder, R.M. and Soloman, B.A., 1999. Index of Learning
Styles. Retried on November 15, 2008:
http://www2.ncsu.edu/unity/lockers/users/f7felder/pub
lic/
Felder, R.M and Spurlin, J.E, 2005. Applications,
Reliability and Validity of the Index of Leaning
Styles, International Journal of Engineering
Education, 21(1), 103-112.
Frankola, K., 2001. The E-learning taboo–high dropout
rates: Best practices for increasing online course
completion rates. Syllabus, June 2001, 14-16.
Gardner, J. (Ed.), 2005. Assessment and Learning, SAGE.
Honey, P. and Mumford, A., 1992. The manual of
learning styles. Maidenhead: Peter Honey
Publications.
Johnston, J., Killion, J., and Oomen, J., 2005. Student
Satisfaction in the Virtual Classroom. The Internet
Journal of Allied Health Sciences and Practice, 3(2).
Joyce, A. et al 1996. Art: Activities and Standards.
Handbook of Classroom Assessment: Learning,
Achievement, and Adjustment. Ed. Gary Phye. San
Diego: Academic Press.
Keefe, J.W., 1979. Learning style: An Overview, in Keefe,
J.W., ed., Student Learning Styles: Diagnosing and
Prescribing Programs. National Association of
Secondary School Principals.
Khaled, S. and Baldwin, L., 2003. Web-based learning
interaction and learning styles, British Journal of
Educational Technology, 34(4), 443-454.
Kolb, D.A., 1984. Experiential learning: experience as the
source of learning and development. Englewood
Cliffs, New Jersey: Prentice Hall.
McMillan, D.W. and Chavis, D.M., 1986. Sense of
Community: A definition and theory. Journal of
Community Psychology, 14(1), 6-23.
Moore, M.G., 1993. Theory of transactional distance. In
D. Keegan (Ed.), Theoretical principles of instance
education, New York: Routledge, 22-38.
Picciano, A.G., 2002. Beyond student perceptions: issues
of interaction, presence, and performance in an online
course. Journal of Asynchronous Learning Networks,
6(1).
Pigliapoco, E. and Bogliolo A., 2007. The effects of the
Psychological Sense of Community in on-line and
face-to-face academic courses, Conference on
Interactive Computer Aided Learning.
Pigliapoco, E. and Bogliolo A., 2008. Learning Curve
Monitoring, Conference on Interactive Computer
Aided Learning.
Riding, R. and Rayner, S., 1998. Cognitive Styles and
Learning Strategies: Understanding Style Differences
in Learning and Behaviour, David Fulton, London.
Riechmann, S.W. and Grasha, A.F., 1974. A rational
approach to developing and assessing the constructive
validity of a student learning style scales instrument.
The Journal of Psychology, 87
, 213-223.
Rovai, A.P. 2002. Development of an Instrument to
Measure Classroom Community. The Internet and
Higher Education, 5, 197-211.
Sadler-Smith, E., 1997. Learning Style: frameworks and
Instruments, Educational Psychology 17, 51-63.
Shea, P., Swan, K., Fredericksen, E., and Pickett, A.,
2002. Student Satisfaction and Reported Learning in
the SUNY Learning Network. Elements of Quality
Online Education, Needham, MA: SCOLE.
Wiers-Jenssen J., Stensaker B., and Grøgaard J. B., 2002.
Student Satisfaction: towards an empirical
deconstruction of the concept. Quality in Higher
Education, 8(2), 183-195.
Witkin, H., Moore C., Goodenough D., and Cox P., 1977.
Field-dependent and Field–independent cognitive
styles and their educational implication, Review of
Educational Research, 47, 1-64.
Zywno, M.S., 2003. A Contribution of Score Meaning for
Felder-Soloman’s Index of Learning Styles, the 2003
American Society for Engineering Education Annual
Conference and Exposition.
CSEDU 2009 - International Conference on Computer Supported Education
40
