
RELATIONSHIP BETWEEN FRACTAL DIMENSION
AND SENSITIVITY INDEX OF PRODUCT PACKAGING
Mayumi Oyama-Higa
1
and Tiejun Miao
2
1
Department of Integrated Psychological Science, Kwansei Gakuin University
1-1-155, Ichibancho, Uegahara, Nishinomiya-City, 662-8501, Japan
2
CCI Corporation, Kitashinagawa, Shinagawa, Tokyo 141-0001, Japan
Keywords: Fractal dimension, Sensitivity index, Product packaging.
Abstract: Until now, the evaluation of product packaging has been performed subjectively since no other way existed.
Previous research has also shown that people tend to prefer images with high fractal dimension. If so, then
the fractal dimension of product package images should enable a determination of how preferable product
packages would be, or function as an index to estimate whether product packages would attract attention. In
this study, we calculated the fractal dimension for packages of 45 types of canned beer. We performed a
comparative analysis using the standard deviation method to determine the degree to which the product
packages influenced the potential customer’s impression of the product. The results showed that the fractal
dimension is highly important to an objective evaluation.
1 INTRODUCTION
Product packaging is an extremely important factor
that affects the sales of a product. Product packaging
serves several roles including protecting and
wrapping the product, facilitating transport and
storage, conveying product information to the
consumer, giving an impression about the product,
and motivating consumers to want to buy the
product. Furthermore, product package design is a
factor that even determines the image of the product
contained in the package.
Until now, package evaluations were performed
subjectively and obtaining objective evaluations
based on numerical values was not possible.
However, if people tend to prefer images with a high
fractal dimension, then an examination of the fractal
dimension of product package images could help
determine how preferable a product package would
be, or serve as one index for evaluating whether a
product package would attract attention.
Previous research related to product packages
have focused on aspects related to the buyer’s
motives in purchasing food or daily use items
(Nagamachi, 1995). We investigated whether
university students considered color, package
design, product design, quality, advertising, style,
brand, manufacturer, price, form, safety, and
functionality in their purchase decisions, and
concluded that package design was the most
important factor. In addition, in research regarding
the affect of visual sensory information on taste,
Sakai & Morikawa (2006) showed that evaluation
scores differed if the visual sensory information was
changed, even when assessing the same food
product(Sakai, Morikawa, 2006).
Fractal dimension research related to the
agreeability of human faces (Oyama-Higa, Miao, &
Ito 2007) showed a tendency for photographs of
smiling faces to have a higher fractal dimension than
photographs of expressionless faces (Oyama-Higa,
Miao & Itoh, 2007). Furthermore, research
investigating the relationship between eye
movement while viewing pictures and the fractal
dimension of those pictures (Nagai, Oyama-Higa, &
Miao 2007) has shown that the gaze tends to be
concentrated on areas of pictures with high fractal
dimension.
In this study, we calculated the fractal dimension
for canned beer packaging to determine the
relationship between the package and the buyer’s
impression of the product. The experiment overview
and method are described in section 2. Section 3
describes the fractal dimension calculation and the
relationship with the standard deviation (SD)
349
Oyama-Higa M. and Miao T. (2008).
RELATIONSHIP BETWEEN FRACTAL DIMENSION AND SENSITIVITY INDEX OF PRODUCT PACKAGING.
In Proceedings of the Third International Conference on Software and Data Technologies - PL/DPS/KE, pages 349-355
DOI: 10.5220/0001878803490355
Copyright
c
SciTePress
method of evaluation. The calculation results and
perspectives for the future are discussed in section 4.
2 EXPERIMENT OVERVIEW
AND EXPERIMENT METHOD
The experiment was performed in a laboratory from
September 25 through October 3, 2007. Eighteen
subjects (11 men and 7 women) ranging in age from
19 to 26 years (mean 22 years) participated. None of
the subjects had ever previously consumed the
various canned beers shown in the photographs. All
subjects had normal vision.
2.1 Fractal Dimension Calculation
and Grouping
First, the photograph of each of the 45 types of
canned beer was assigned a number from 1 to 45,
and the fractal dimension was calculated for each
photograph using the planar and cubic methods. See
the Appendix for details of calculating the fractal
dimension.
The photographs were ranked in descending order
by fractal dimension according to the results of the
planar and cubic methods. The five photographs
with the lowest total based on the two methods
(hereafter referred to as the high fractal group), and
the five photographs having the highest total
(hereafter referred to as the low fractal group) were
extracted and selected for further evaluation using
the SD method.
Figure 1: Selection of targets for the SD method of
assessment.
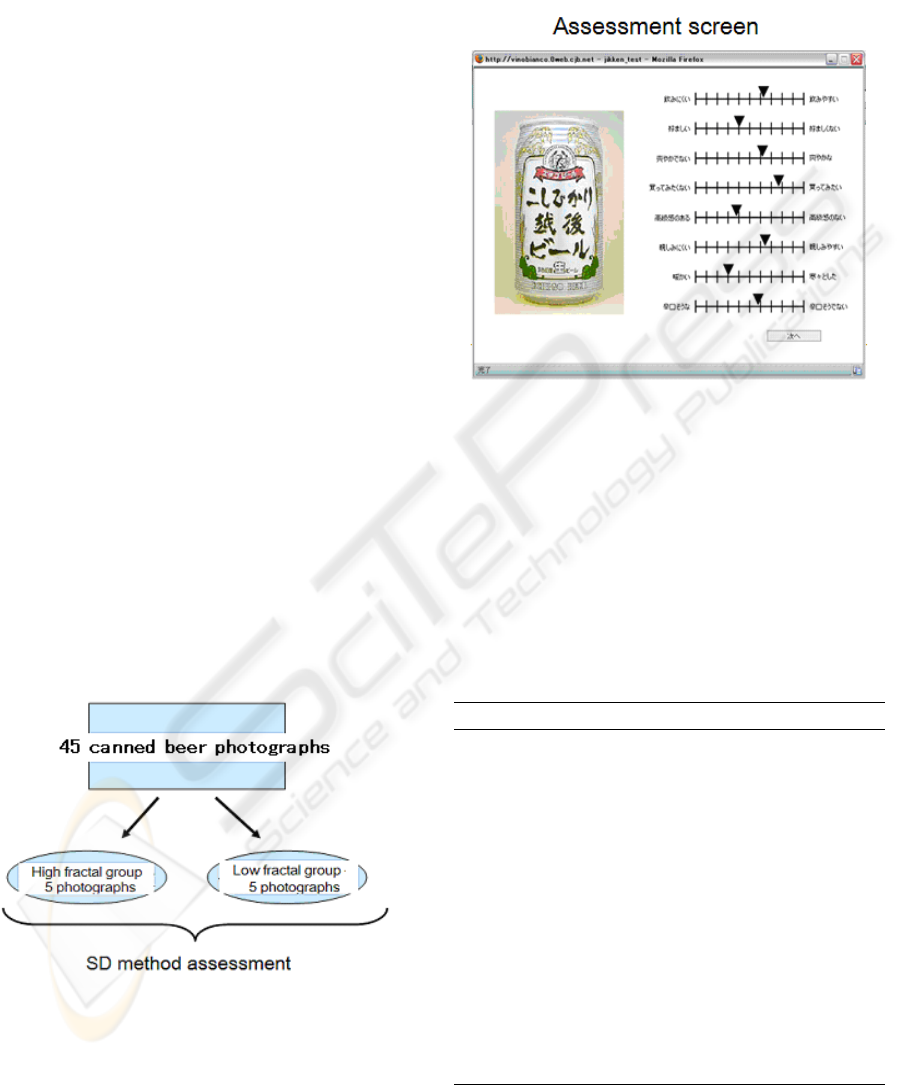
2.2 Assessment by the SD Method
A chair was placed so that the eye level of a subject
sitting in it would be at the same height as the center
of a computer display 57 cm away. Five photographs
from the high fractal group and five photographs
from the low fractal group were randomly displayed,
and subjects were asked to assess each photograph
one at a time on the computer display (Figure. 2).
Figure 2: Assessment screen based on the SD method.
The 16 descriptive terms used in the SD method, the
order of presentation, and positive or negative
orientation are shown in Table 1. The order of
presentation and positive or negative orientation
were determined randomly.
The 16 terms were randomly selected from a list of
sensitivity words created by Nagamachi, (1995) that
were thought to be relevant to impressions of canned
beer [2].
Table 1: Descriptive terms used in the SD method.
Adjective number Descriptive terms
1 Difficult to drink Easy to drink
2 Preferable Not preferable
3 Not refreshing Refreshing
4 Would not like to buy Would like to buy
5 Expensive-looking Not expensive-looking
6 Not friendly Friendly
7 Warm Chilling
8 Seems dry Does not seem dry
9 Seems cool and fresh Does not seem cool and fresh
10 Not soft Soft
11 Not fashionable Fashionable
12 Eye-catching Subdued
13 Not cute Cute
14 Delicious-looking Not delicious-looking
15 Not premium Premium
16 Nice Not nice
The estimation screen was 500 × 700 pixels centered
in the display. A photograph of the canned beer was
ICSOFT 2008 - International Conference on Software and Data Technologies
350
presented on the left half of the screen at a size of
239 × 358 pixels, and eight sliders paired with
opposing adjectives were presented on the right half
of the screen.
The sliders could be moved by dragging the mouse,
and subjects were instructed to move the slider to the
position they felt appropriate for that product.
Assessment values were designed to record a
maximum value of 100 and a minimum value of –
100.
3 RELATIONSHIP BETWEEN
THE FRACTAL DIMENSION
CALCULATION
AND SD METHOD
ASSESSMENT VALUES
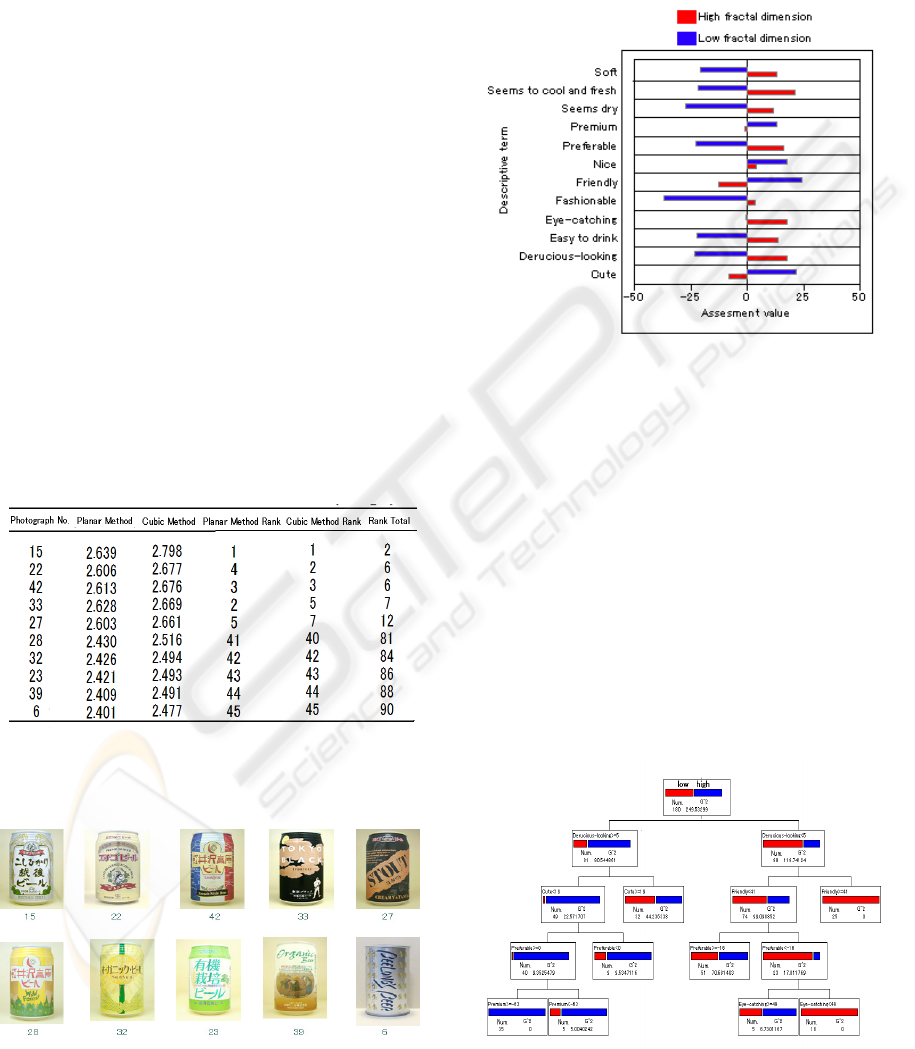
3.1 Fractal Dimension Calculation
The fractal dimensions of the beer photographs in
the high and low fractal groups used in the SD
estimation method (Figure. 3) are shown in Table 2.
Table 2: Fractal dimension and rank of assesd canned beer
photographs.
3.2 Relationship between Fractal
Dimension and Assessment Values
Figure 3: High fractal group (upper row) and low fractal
group (lower row) of canned beer photographs and
photograph numbers.
We divided fractal dimension into two groups (high
value/low value) and performed Student t-test
(Alpha 0.05) of 16 term of SD using all subject data.
As a result, we found twelve terms that were
significantly different relations. Fig. 4 shows the
results.
Figure 4: Bar graph of descriptive terms which are
significantly different with high/low of the fractal
dimension.
We performed partition analysis of 12 items where
significant difference was seen in. Fig 5.
As a result, three remarkable rules were found.
A. The rule of the high fractal dimension.
Rule 1. 35 cases in 90 (38.9%)
Premium ≧ -63、Preferable ≧ 0,
Cute <16, and Delicious-looking ≧ 5
B. The rule of the low fractal dimension.
Rule 2. 25 cases in 90 (27.8%)
Friendly ≧ 41 and Delicious-looking < 5
Rule 3. 19 cases in 90 (21.1%)
Eye-catching < 49, Preferable < -16,
Friendly < 41 and Delicious-looking < 5
Figure 5: Partition analysis of twelve items.
RELATIONSHIP BETWEEN FRACTAL DIMENSION AND SENSITIVITY INDEX OF PRODUCT PACKAGING
351
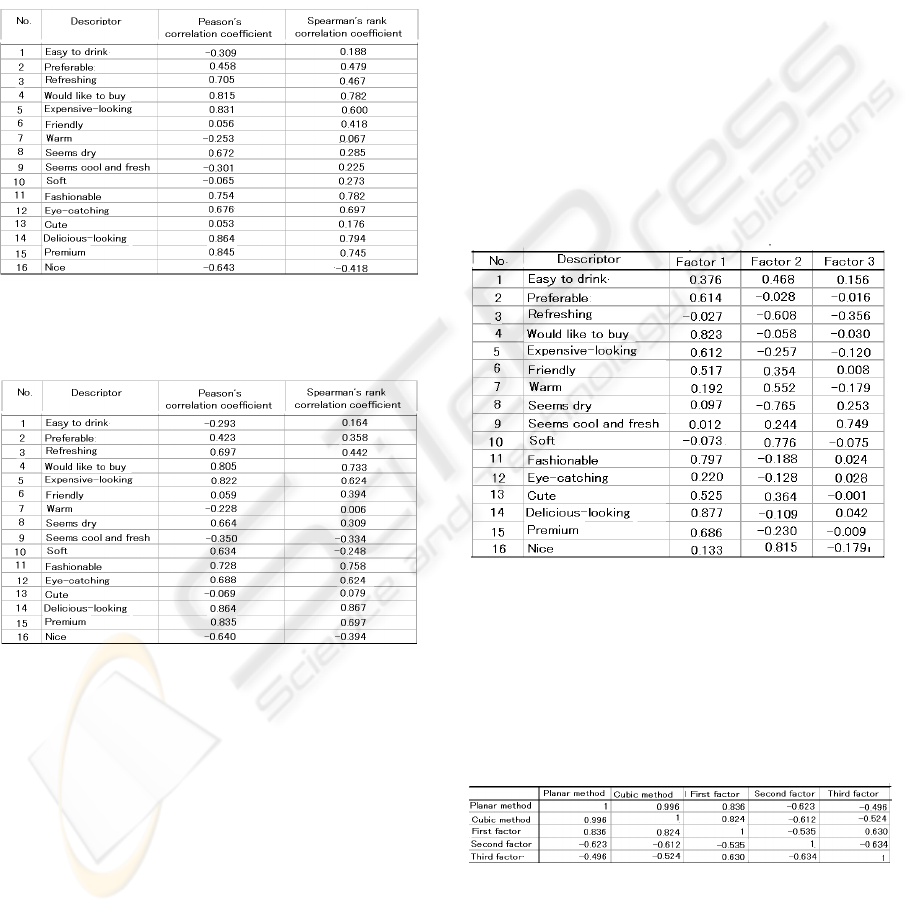
The correlation coefficients between the fractal
dimensions calculated by the planar method and the
assessment values are shown in Table 3.
Furthermore, the correlation coefficients between
the fractal dimensions calculated by the cubic
method and assessment values are given in Table 4.
Table 3: Correlation coefficient between the planar
method fractal dimension and the assessment value of
each descriptor.
Table 4: Correlation coefficient between the cubic method
fractal dimension and the assessment value of each
descriptor.
For Pearson’s correlation coefficient, when using a
non-correlated test of each adjective assessment
value and the fractal dimension of the planar
method, significant correlations were found for
“would like to buy” (t = 3.98, df = 8, p < .01),
“expensive-looking” (t = 4.23, df = 8, p < .01),
“delicious-looking” (t = 4.85, df = 8, p < .01), and
“premium” (t = 4.47, df = 8, p < .01). A similar
tendency was observed in the results of the cubic
method.
3.3 Discovering Latent Factors using
the Assessment Value Factor
Analysis
A factor analysis based on the principal factor
method was performed to reveal latent adjective
factors. Rotation was performed using the promax
rotation method, and three factors were extracted.
The factor matrix for each adjective is shown in
Table 5.
The first factor was set to “desire to purchase quality
products” because all of the following terms were
included: “would like to buy,” “delicious looking,”
“expensive looking,” “cool,” and “premium.” The
second factor was set to “soft feeling” because the
adjectives such as “soft” and “warm” were included.
The third factor was set to “light feeling” because
the adjectives “refreshing” and “dry” were included.
Table 5: Factor matrix of each descriptor.
3.4 Relationship between Fractal
Dimension and Latent Factors
The correlation coefficients between extracted
factors and fractal dimension are shown in Table 6.
Table 6: Pearson’s correlation coefficient of the fractal
dimension and each factor.
For Pearson's correlation coefficient, when
performing a non-correlated test, a significant
correlation was found between the fractal dimension
of planar method and the first factor, “desire to
purchase quality products” (t = 4.31, df = 8, p < .01).
A significant correlation was also found between the
ICSOFT 2008 - International Conference on Software and Data Technologies
352

fractal dimension of cubic method and the factor
“desire to purchase quality products” (t = 4.11, df =
8, p < .01).
Table 6 shows a high correlation between the first
factor (desire to purchase quality products) and both
the planar and cubic fractal dimensions, indicating a
negative correlation between the second factor (soft
feeling) and the fractal dimension.
3.5 Evaluation of the Result
The canned beer used to compare labels omits the
one of a famous beer company in Japan. Therefore,
this investigation was done by using the local beer
not notorious.
Result of examining hot seller of beer by the Internet
later. The 33rd canned beers with high fractal
dimension of Fig. 3 were a local beer hot selling
rankings and 1st place.
(http://www.rakuten.co.jp/yonayona/111011/718975/#
tp24)
The 42nd was popular ability No.1.
(http://store.shopping.yahoo.co.jp/yoho-
yonayona/b7dab0e6c2.html)
Moreover, popularity was high, and the 15th and
22nd canned beers had been won the championship
in the contest of the beer.
(http://www.rakuten.co.jp/yagishoten/425762/448054/)
The canned beer with low fractal dimension was not
displayed in sales information in the Internet.
The beer is drunk all over the world. The SD
evaluation that we used is thought to be different in
the culture and the climate. This testee is a young
person in Japan. 45 kinds of canned beers used to
experiment are not brands known well in Japan.
Therefore, the testee had not seen the label of
local beer. In a word, the testee who did not have the
experience of drinking each beer was chosen.
It can be thought that the fractal dimension is related
to the buying intention from the above-mentioned
result.
4 DISCUSSION
Biological information exhibits a chaotic behavior,
and until now, it has been difficult to explain human
information processing using subjective methods
(Miao, Shimoyama, Shimizu, Oyama-Higa,2006),
(Barnsley, M. B., 1988) . In other words, delicate
human information processing, in particular, cannot
be analyzed in detail by traditional linear analytical
methods. By using nonlinear and complexity
methods of facial fractal analysis, our findings
suggest that information processing in human
recognition might be explained and characterized by
fractal dimensions.
We demonstrated that higher fractal dimensions
of canned beer packaging led to an increased
impression of high quality and a greater desire to
purchase. Moreover, the analysis showed that low
fractal dimensions of canned beer packages
contributed to a soft feel. The analysis results
indicated a tendency for the third factor, “light feel,”
to be perceived for low fractal dimensions.
From the calculations of fractal dimensions for
canned beer package photographs and the results of
the SD method, a high correlation was found based
on Pearson's correlation coefficients for the
descriptors “would like to buy,” “delicious-looking,”
and “premium.” Since a significant difference was
detected between the high fractal group and the low
fractal group for the terms “would like to buy,”
“delicious-looking,” and “premium," canned beer
photographs with high fractal dimensions should be
perceived as being more desirable to buy, more
delicious-looking, and of higher premium quality.
Although traditionally, resorting to subjective
assessments such as the SD method used in this
experiment would have been necessary to measure
the good or bad aspects of product packaging, these
results showed the feasibility of calculating the
fractal dimension of such product packaging to
obtain an objective index of such aspects.
Further research is required to gather data on a
variety of product types and a broader range of ages
and subjects most appropriately suited to the
products being examined.
ACKNOWLEDGEMENTS
We thank Mr. Yu Toishi of the Oyama laboratories,
Kwansei Gakuin University which cooperated with
making of experimental data of packaging.
REFERENCES
Barnsley, M. B., 1988. The book, Fractals Everywhere.
Academic Press Inc., London.
Nagamachi, M., 1995. The story of sensitive engineering,
Tokyo, Japan Standards Association.
Jun, S., & Kamahori, F. 2003. Study about food and a
purchase action of life armamentarium of a university
student. Design Studies, 50(5), pp. 31–39.
Mandelbrot, B. 1977. The book, Fractals: Form, Chance
and Dimension. W. H. Freeman & Co., San Francisco.
RELATIONSHIP BETWEEN FRACTAL DIMENSION AND SENSITIVITY INDEX OF PRODUCT PACKAGING
353
Miao, T., Shimoyama, O., Shimizu, T., & Oyama-Higa,
M. 2006. Fractal analysis of facial skin thermogram
due to mental tasks. IEEE International Conference on
Systems, Man and Cybernetics, Oct. 8–11, 2006,
Taiwan, pp. 1671–1675.
Nagai, M., Oyama-Higa, M., & Miao, T. 2007.
Relationship between image gaze location and fractal
dimension. IEEE International Conference on
Systems, Man and Cybernetics, Oct. 7–10, 2007,
Montreal, pp. 4014–4018.
Oyama-Higa, M., Miao, T., & Itoh, T. 2007. Relationship
between fractal dimension and agreeability of facial
imagery. Computational Models for Life Sciences–
CMLS '07: 2007 International Symposium on
Computational Models of Life Sciences. AIP
Conference Proceedings, 952, pp. 104–113.
Pentland, A. P. 1984 Fractal-based description of sciences.
IEEE Trans. Pattern Analysis and Machine
Intelligence, PAMI-6, pp. 661–674.
Sakai, N., & Morikawa, N.,2006. A role of an eye-sight
image in alimentary taste rating. Japanese Journal of
Taste and Smell (in Japanese), 13(3), pp. 463–466.
Shimada, S et al. 2000. The evaluation method of arousal
level by local fractal analysis of fractal skin
temperance. T. IEE Japan, 120-C, pp. 1429–1432.
APPENDIX
Fractal Dimension Estimations
The word fractal, introduced by Mandelbrot was
used to describe the irregular structure of many
natural objects and phenomena (Mandelbrot, 1977).
Fractal geometry shows that nature exhibits a
fundamental character generally known as self-
similarity. This means, that however complex the
shape and/or dynamic behavior of a system, by
observing it carefully and imaginatively, one can
find features in one scale which resemble those in
other scales.
The fractal model of an imaged 3-D surface,
including that of a digital photograph image,
provides a natural description of most textured and
shaded images. A defining characteristic of a fractal
is that it has a fractal dimension. The fractal
dimension of an image gray-level intensity surface
corresponds quite closely to our intuitive notion of
roughness. To infer the fractal dimension of a 3-D
surface from the image data, one method is to
assume the gray level I(x) at pixel x changes
according to a fractal Brownian function (Pentland,
1994). After some simplification operations, the
following relationship is given for any displacement
of
xΔ
(pixel) within an image
[]
CxxIxxIE
H
=Δ⋅−Δ+
−
)()(
, (1)
where E[ ] is the mean value when keeping
x
Δ
(
pixel ) fixed, and H and C are constants. By
conducting logarithm operations on equation (1), we
obtain the value of H as the slope of the regression
line fit to log–log data. The fractal dimension D of
the image surface is derived from
D = 3 – H. (2)
To simplify the calculation, two methods have been
developed to easily and quantitatively deal with the
imagery (Shimada et al., 2000). One of these
methods, called the cubic method, infers the fractal
dimension of the 3-D intensity surface from image
data concerning covering processes at increased
resolutions (2). Considering a cube, each edge of
which is a pixel of size r, the number of cubes
required to cover the surface of an image is N(r).
Furthermore, if the relationship
exists with a constant C, then H gives an estimation
of the fractal dimension of the image surface.
()
H
Nr r C
⋅
=
(3)
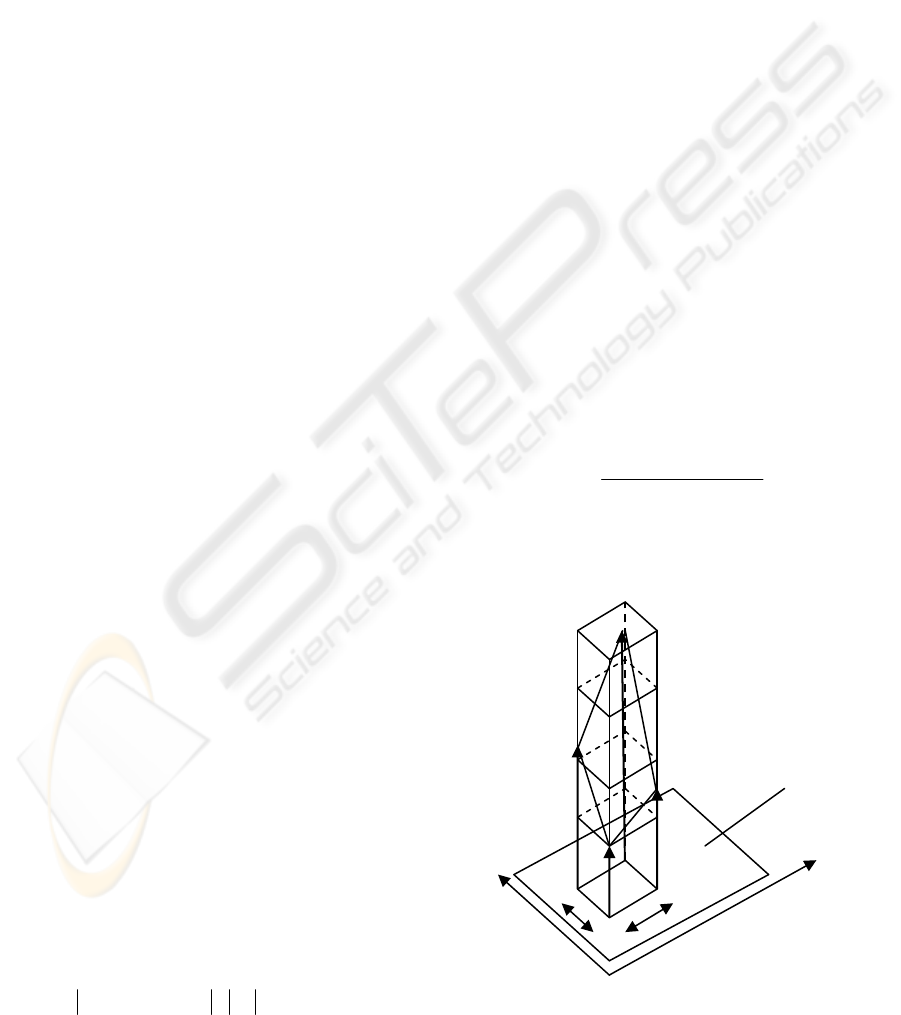
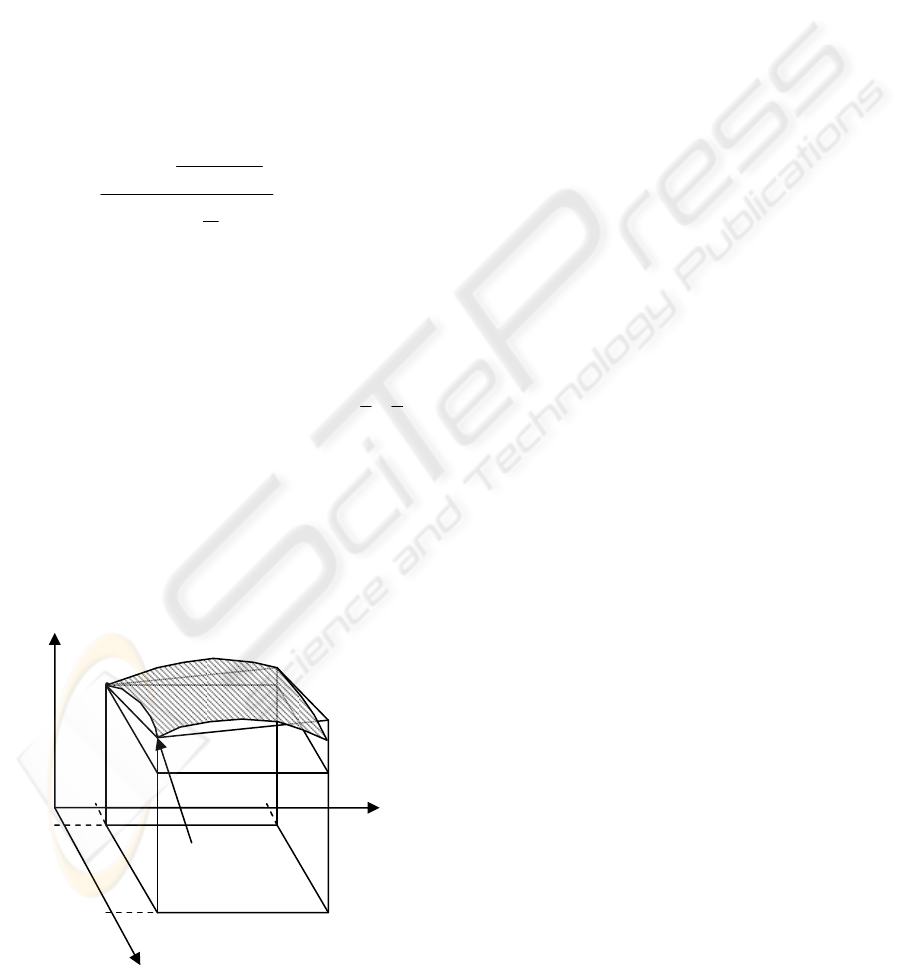
Fig 5 shows an area A on which an image surface
is assumed. Considering the volume unit of a cube
of size
rrr
×
×
and an area unit of
r
r
×
on A, if
the surface portion above the area of
r
r
×
is
completely covered by the cubes, the required
number n(r) is
max( ) min( )
() { } 1
ii
ff
n r floor
r
−
=
+
. (4)
In equation (4), the “floor” is the integer, and fi (I =
1, 2, 3, 4) are respective gray levels of the image
intensity.
Figure 5: Estimation of the fractal dimension over image
area A.
Area A
f
1
f
2
f
3
f
4
r
r
x
y
ICSOFT 2008 - International Conference on Software and Data Technologies
354
2
() () (area of )/Nr nr A r=< > ⋅
.
(5)
When the average value of n(r) over all of A is
denoted as <n(r)>, the total number required to
cover the image surface above A.
Finally, fractal dimension D is estimated by the
regression fit to successive log–log data points of
log10(r) vs. log10N(r), with increased sizes of r.
Another approach, called the area method,
involves counting the number of area units covering
an area, instead of the cubic units. This method
calculates the fractal dimension representing the
undulating complexity of the picture density by
using a method to change the degree of coarse
graining and a parameter-based model method:
[
]
[]
)
1
(log
)
)(
)(
(log
10
10
a
tFE
atFE
H
−
=
.
(6)
In equation (6), setting t to a fixed value and
calculating the number of partitions by calculating
the length unit of
[]
)(aFE
as 1/a, or calculating
the number of surface partitions of the image density
curved surface as the minimum area unit of
aa
11
×
,
the above equation can be represented as
(
)
aN /1
.
By setting
ra =/1
, equation (1) can be rewritten
as
)1(loglog)(log
101010
NrHrN +−=
(7)
Figure 6: Area approach to computing fractal dimensions.
For images, the calculated value on the left side of
equation (2) is dependent on r; thus, variability is
normal. However, if the image is fractal in nature,
linearity should be largely preserved.
In this way, fractal dimension
H
can be calculated
by determining the slope of the regression line by
the least-squares method for multiple sample values
))(log,(log
1010
rNr
,
),2,1( "=r
; the obtained
value can be used as an estimate for -
H
.
For two-dimensional objects such as images,
setting the image density curved surface area,
calculated using units with small areas such as
r
r
×
, to
)(rS
, we obtain
)()(
2
rNrrS ⋅=
(8)
Therefore, equation (7) can be rewritten as
)1(loglog)2()(log
101010
SrHrS +
−
=
(9)
Here, the surface area of an
r
r
×
small area density
curve is a triangular area with twice the surface area
shown in Figure 3 of
)),(,,()),,(,,()),,(,,( rjifrjijrifjrijifji
+
+
+
+
By deriving the regression line slope by the least-
squares method from multiple sample values of
))(log,(log
1010
rSr
,
),2,1( "=r
, the estimated
value
H
−
2
can be used to calculate the fractal
dimension
H
.
j+r
j+r
f(I,J)
(i,j, f(i,j)) (i,j+r, f(i,j+r))
( i+r,j, f(i+r,j))
RELATIONSHIP BETWEEN FRACTAL DIMENSION AND SENSITIVITY INDEX OF PRODUCT PACKAGING
355
