
A Comparative Study of Clustering versus Classification
over Reuters Collection
1
Leandro Krug Wives
1
, Stanley Loh
2,3
and José Palazzo Moreira de Oliveira
1
1
Instituto de Informática – UFRGS
Caixa Postal 15.064 – CEP 91501-970, Porto Alegre, RS, Brazil
2
Escola de Informática - UCPEL
Rua Felix da Cunha, 412 – CEP 96010-000 – Pelotas, RS, Brazil
3.
Universidade Luterana do Brasil (ULBRA)
Rua Miguel Tostes, 101 – CEP 94420-280 – Canoas, RS, Brazil
Abstract. People have plenty of information at their disposal. The problem is
that, even with the advent of search engines, it is still complex to analyze,
understand and select relevant information. In this sense, clustering techniques
sound very promising, grouping related information in an organized way. This
paper address some problems of the existing document clustering techniques
and present the “best star” algorithm, which can be used to group and
understand chunks of information and find the most relevant ones.
1 Introduction
The amount of information available today is as huge as never was it before and it is
increasing every day. Even with the aid of search engines it is common to find users
“lost in the cyber space” [1] because of the “information overload” [4]. An interesting
and confusing point is that each search engine has its own ranking mechanism, which
is usually different from the others. Due to the criteria adopted, the results are not
always organized in a clear and pertinent way from the user’s point of view.
Therefore, to identify relevant information and comprehend the relations and the
content of a large group of documents is a very complex task. In this context,
clustering techniques [3], which are able to identify elements with common content
and create clusters (i.e. groups) of related information, are one possible solution.
On the other hand, there are many clustering algorithms and each of them has
different parameters to be tuned. Each adjustment obtains a different result, and it is
difficult to the user to choose the best values of them for each data. In this paper, we
present a clustering algorithm that minimizes this problem, so the user don’t need to
choose the number of clusters to be found neither the threshold of similarity among
objects. Besides, we find results comparables to the application of classification
techniques over the same data, using Reuter’s collection.
1
This work is supported by the OntoQUALIS project (CNPq, grant number 480437/2007-6) and the
PRONEX-FAPERGS project (grant number 0408933).
Krug Wives L., Loh S. and Palazzo Moreira de Oliveira J. (2008).
A Comparative Study of Clustering versus Classification over Reuters Collection.
In Proceedings of the 8th International Workshop on Pattern Recognition in Information Systems, pages 231-236
Copyright
c
SciTePress

2 Related Work
Clustering is an exploratory technique because it allows the researcher to analyze a
large amount of data that is unknown a priori, and to make suppositions about it. In
the Computer Science field, until recently, it was used to group similar data, allowing
better organization and retrieval efficiency on storage devices. The same idea may be
applied on text mining and information retrieval systems to group items that have
similar content, and also on search engines in order to cluster the results of a query to
help navigation and browsing [13].
K-means [6, 12] is a very known and used clustering algorithm. It consists on
establishing a priori the number of clusters that must be identified (that is why its
name, whose k is the number of clusters to be found). The algorithm then aggregates
the given elements into these k clusters. Another similar algorithm is Buckshot [2], in
which the user also establishes the number of clusters to be found and the objects are
distributed accordingly. The biggest problem of these algorithms is the definition
(imposition) of the number of clusters to be found. The user hardly knows how many
k exist in the set of documents. It is somehow contradictory with the idea of
clustering, which is to explore a set of unknown elements. We designed a variation of
an existing algorithm from the graph theoretic family, which identifies relevant
clusters without the need of a specific k.
3 The Clustering Process
There are different methods and approaches for clustering, usually described as
families of clustering algorithms (see [3, 6] for details). Some of them require that the
user guess how many clusters can better represent the collection of documents (i.e., k-
means family). Others require that the user guess the minimum threshold of similarity
that a document must have to be in some cluster (i.e., graph theoretic family). Most
approaches found in the text-mining field use the k-means algorithm or one of its
variations. Almost all techniques apply the following stages to cluster documents: (i)
feature selection; (ii) similarity identification, (iii) cluster identification and analysis,
and (iv) clustering evaluation.
In the Feature selection stage, the document features that will be employed to
identify the document’s contents are selected. This is based on the discrimination
capability of each term, which is traditionally identified by the Relative Frequency
(RF) of the term in a given document (i.e., frequency of the term divided by the
frequency of all terms in the document). The RF is then considered as the weight of
the term in a document. There are many other weighting schemes, such as TF-IDF,
information gain, and LSI (see [14]), but we have found no concluding study to show
that the use of one is significantly better than the others. Since RF is the most simple
to calculate, it was the scheme used in this paper.
After the terms are weighted, it is possible to filter them in order to minimize the
number of features used to represent each document. In this paper, we only excluded
the stop-words, which are very common terms with no discriminating capabilities,
such as prepositions and conjunctions. We used the stop-word list proposed by [9].
232

The result of this stage is a vector of terms representing each document, all with its
corresponding weight.
Once the discriminating terms for each document are identified, they can be used
to identify similarities among documents. Again, many approaches can be used [14].
We have chosen the grade of similarity (gs), which is based in the fuzzy theory and
was already used by us with promising results [11, 13, 14]. Equation 1 shows its
formula.
(
)
nbagigs(X,Y)
k
h
∑
=
=
1
),(
.
(1)
In this equation, X and Y are the vectors that represent each document; k is the
number of elements they have in common; n is the amount of terms present on X and
Y; and gi is the grate of equality (gi) among the weights of the h
th
element (a in X;
and b in Y). Equation 2 shows gi, stated in fuzzy algebra (according to [10]).
()
(
)
(
)
(
)
[]
abbaabbabagi →∧→+→∧→=
2
1
),(
.
(2)
There, =1- x; a → b = max{c ∈ [0, 1] | a*c <= b}; and ^ = min. It takes in
account that an attribute may have different degrees of importance in different vectors
(documents). In this sense, instead of calculating the average or the product between
two degrees, the function determines the degree of equality between them. Then we
perform the identification of the similarity among all documents and generate a
matrix of similarity that allows us to apply different clustering algorithms or test
different parameters without calculating similarity again.
The next step consists on the clustering identification and analysis. In this paper
we use clustering algorithms that falls in the graph-theoretic family [7]. In this family
of clustering, each object is a node and nodes that belong to the same cluster are
linked. The following algorithms were employed: Stars, Cliques, Best-star and Full-
stars. Cliques and Stars were used as defined in [8]. Best-star and Full-stars are two
variations of the Stars algorithm, created by us (details in [11]).
Stars is creates clusters where the resulting format is like a star of correlated
objects. It selects one element to be the center of the star and tries to find other
unprocessed elements that are similar to it, according to a predefined threshold. The
quality of the cluster depends on this threshold, and the greater it is, the more coherent
are its elements. Once all elements are compared to the center, another un-clustered
element is selected as star and the process continues until all elements are analyzed.
Cliques is very similar, but the elements are added only if they satisfy the threshold
of similarity among all elements already in the cluster. In this case, the elements are
more tightly coupled and the quality of the resulting clusters is better.
The main problem with the previous algorithms is that the user has to set the
threshold of similarity. This is similar to the problem of the k in the k-means
approach. Besides, the order in which the elements are selected as star centers also
influences the clustering result. The Best-star algorithm intends to solve these
problems, analyzing the elements already allocated each time a new center is selected,
re-allocating elements to the nearest star as necessary, even if they are already
clustered. The side effect is that the user does not need to set the threshold.
The previous algorithms do not create overlapped clusters (i.e., clusters with
elements in common) but sometimes elements may fall to more than one cluster and
233

the user wants to know this information. The Full-Stars algorithm solves this problem
allocating elements on all clusters that its similarity is greater than the threshold.
The last stage consists on the clustering evaluation. Some methods can be used to
evaluate the clustering process. In this paper we use what [5] calls external criteria. In
this case, the clustering result is compared to a pre-existing structure. We used the
experiment of [9] as base-line.
Recall and precision are traditional metrics in information retrieval systems, and
are used to measure their ability to recover correct and accurate results. In our
context, recall is the number of documents attributed in a cluster (or category) divided
by the number of documents that should be attributed on it; precision is calculated by
taking the number of documents correctly attributed to one cluster or category and
dividing it by the number of documents attributed to it. As we have multiple clusters,
it is necessary to analyze them together to have a clue about the overall result. Macro
and micro-averaging are techniques used in the evaluation of categorization systems
to give a unique index of recall or precision for all categories (or clusters) as a whole.
According to the concept given by [9], macro-average recall (MAR) can be
obtained by Equation 3. In this equation, n is the number of categories or clusters and
R
i
is the Recall of the i
th
category or cluster. The macro-average precision (MAP) is
very similar, and R
i
is changed by P
i
(the precision of each group or category).
(
)
nRMAR
n
i
i
/
1
∑
=
=
.
(3)
Micro-average does not consider individual results (groups), and takes in account
the whole result. Micro-average recall, for example, can be found by dividing the
number of classified documents by the number of unclassified documents. In our
case, the unclassified documents are those not allocated in a cluster. Micro-average
precision is obtained when the number of documents correctly classified is divided by
the number of documents classified. In the approach here described, documents are
correctly attributed when they can be found is in a cluster in which the majority of its
elements are in the same subject. Clusters with just one document are considered
incorrect in our approach.
4 Experimental Analysis and Evaluation
The first experiment was performed in a group of email messages containing four
different subjects. Macro-average was used to evaluate the results of each algorithm.
These algorithms do not need the number of clusters to be found, but require a
minimum threshold of similarity among the elements that will fall in the same cluster.
We have tested different threshold levels: 0.0, 0.05, 0.1, 0.15, 0.2, 0.5 and 1.0.
Fig. 1 shows the macro-average recall achieved by each algorithm on each level.
The best algorithm is the one that achieves the best macro-average among all levels.
We can perceive that, as the similarity degree grows, it is more difficult to find
relationship among documents (in fact, when the threshold is greater than 0.2, no
relationship can be found among documents and each cluster contains one single
element). We can also notice that Best-stars present the highest scores among all
points. Fig. 2 shows the general performance of each algorithm, i.e., the macro-
234
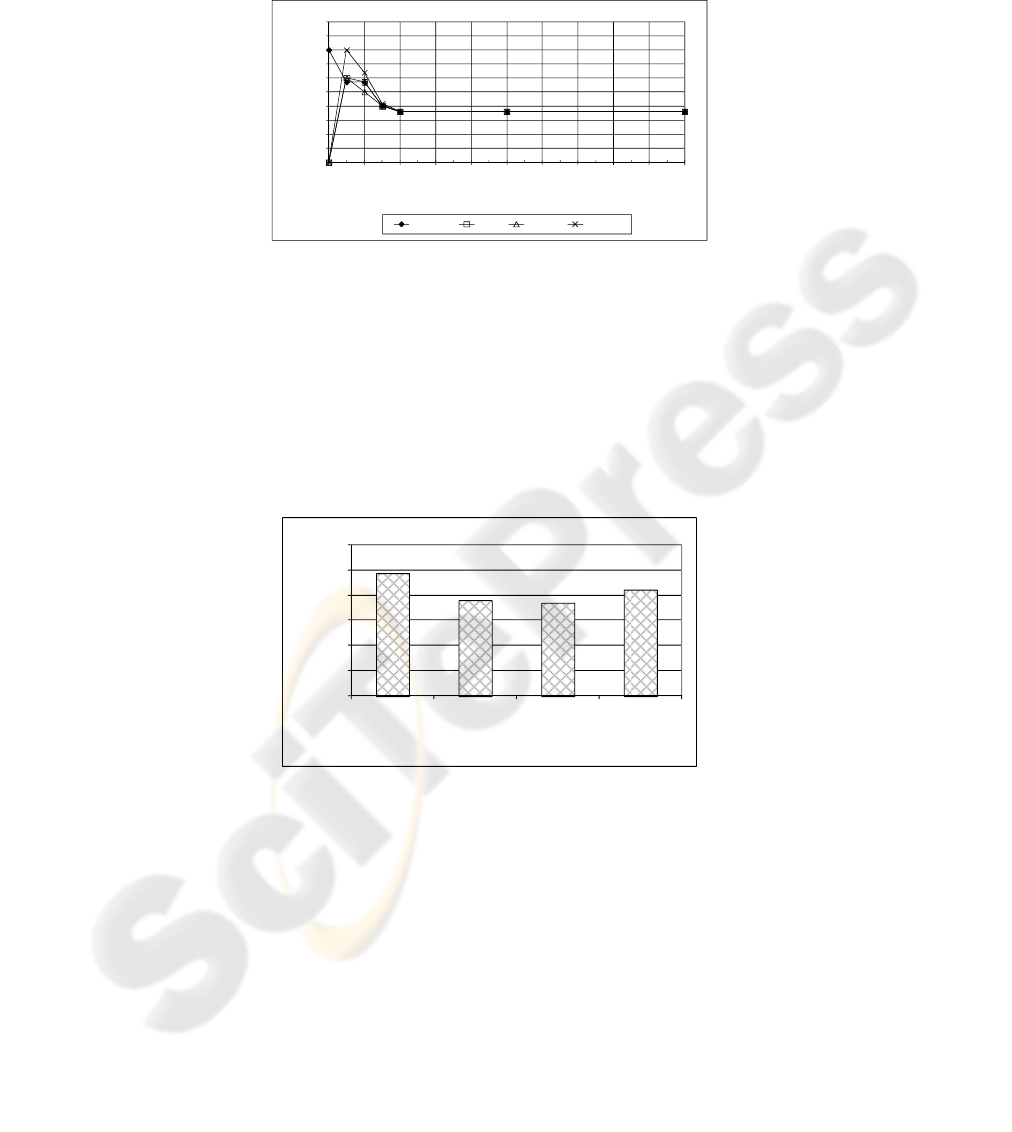
average recall for each algorithm on all points. It is clear that the Best-Stars algorithm
presents the best performance, followed by the Full-stars. The Cliques algorithm
presents the worst performance, since it is the most restrictive of them.
-
0.1
0.2
0.3
0.4
0.5
0.6
0.7
0.8
0.9
1.0
- 0.1 0.2 0.3 0.4 0.5 0.6 0.7 0.8 0.9 1.0
macroaverage recall
Similarity degree
Best-star Stars Cliques Full-stars
Fig. 1. Comparison of clustering algorithms using macro-average recall for each threshold.
In order to evaluate our approach with traditional classification techniques we
selected the Reuters-21579 collection, distribution 1.0, which is a corpus of 21579
English news documents prepared to be used in document understanding systems,
classification and information retrieval or extraction tasks. In this collection,
documents are pre-classified, which makes them easier to analyze and compare. Many
experiments use this collection [9, 15], but none focus on clustering. This collection
has five categories, and documents were manually indexed on these categories. In our
experiment we adopted the 722 documents of the HAYES SPLIT sub-collection test-
set, which was used in the CONSTRUE system evaluation [9].
-
0.1
0.2
0.3
0.4
0.5
0.6
Best-star Stars Cliques Full-stars
Performance
Clustering algorithm
Fig. 2. Comparison of clustering algorithms using their average macro-average recall.
Using the Best-Star algorithm without setting a threshold, we have found 266
documents. The MAR obtained was of 0.95 and the MAP was 0.43. The CONSTRUE
system achieved 0.89 MAR points and 0.92 MAP points. It is important to state that
on classification it is easy to identify if a document was correctly classified or not. On
clustering, we must define rules to identify each cluster subject and to identify if each
of its documents is or not on this subject. We defined that the most appropriate cluster
for a document was that in which all the other documents of the same cluster were
under the same subject. Another important point was that many a priori
235

“uncategorized” documents (about 139) were clustered among other categories, and
then considered incorrect according to our rules.
5 Conclusions
In this paper, we presented and compared some clustering algorithms (stars, cliques,
best-star and full-stars) that can be applied over text collections to organize texts of
the same subject. We have found that the Best-Stars is the most interesting among
them to perform this task without needing much information and adjustments from
the user. Our experiments showed that clustering achieves similar or better micro-
average recover than the CONSTRUE system, but lacks precision. However, it can be
used to suggest appropriated categories for documents that the category is unknown.
References
1. Brake, D.: Lost in cyberspace. New Scientist, 154(2088):12-13, (1997)
2. Cutting, D., Karger, D.R., Pedersen, J.O. and Tukey, J.W.: Scatter/Gather: a cluster-based
approach to browsing large document collections. In Proc. of the ACM-SIGIR Conference
pp. 318-329. ACM Press, New York (1992)
3. Everitt, B.S., Landau, S. and Leese, M.: Cluster Analysis. Oxford University Press Inc,
New York (2001)
4. Farhoomand, A. F. and Drury, D. H.: Managerial information overload. Communications of
the ACM, 45(10):127-131, (2002)
5. Halkidi, M., Batistakis, Y. and Varzigiannis, M.: Cluster Validity Checking Methods: Part
II. ACM SIGMOD Record, 31(3):19-27, (2002)
6. Jain, A.K. and Dubes, R.C.: Algorithms for Clustering Data. Prentice-Hall, Inc., Upper
Saddle River, NJ (1988)
7. Jain, A.K., Murty, M.N. and Flynn, P.J.: Data clustering: a review. ACM Computing
Surveys, 31(3):264-323, (1999)
8. Kowalski, G.: Information Retrieval Systems: Theory and Implementation. Kluwer
Academic Publishers, Boston (1997)
9. LEWIS, D.D.: Representation and Learning in Information Retrieval. Department of
Computer and Information Science. University of Massachusetts, Amherst (1991)
10. Pedrycz, W.: Fuzzy neural networks and neurocomputations. Fuzzy Sets and Systems,
56(1):1-28, (1993)
11. Prado, H.A.d., de Oliveira, J.P.M., Ferneda, E., Wives, L.K., Silva, E.M. and Loh, S.: Text
Mining in the context of Business Intelligence. In: Khosrow-Pour, M. (ed.): Encyclopedia
of Information Science and Technology. Idea Group Reference, Hershey, PA, USA (2005)
2793-2798
12. Steinbach, M., Karypis, G. and Kumar, V.: A comparison of document clustering
techniques. In Proc. of the Workshop on Textmining. pp. 2, Boston, USA (2000)
13. Clustan, http://www.clustan.com.
14. Wives, L.K., de Oliveira, J.P.M. and Loh, S.: Conceptual Clustering of Textual Documents
and Some Insights for Knowledge Discovery. In: Prado, H.A. do and Ferneda, E. (eds.):
Text Mining: Techniques and Applications. Information Science Reference Hershey, PA,
USA (2008) 223-243
15. YANG, Y. and LIU, X.: An evaluation of statistical approaches to text categorization.
Journal of Information Retrieval, 1(1/2):67-88, (1999)
236
