
Topographic Connectionist Unsupervised Learning for
RFID Behavior Data Mining
Gu
´
ena
¨
el Cabanes
1
, Youn
`
es Bennani
1
, Claire Chartagnat
2
and Dominique Fresneau
2
1
LIPN-CNRS, UMR 7030
2
LEEC-CNRS, UMR 7153
99 Avenue J-B. Cl
´
ement, 93430 Villetaneuse, France
Abstract. Radio Frequency IDentification (RFID) is an advanced tracking tech-
nology that can be used to study the spatial organization of animal societies. The
aim of this work is to build a new RFID-based autonomous system to follow indi-
viduals spatio-temporal activity, which is not currently available, and to develop
new tools for automatic data mining. We study here how to transform these data
to obtain knowledge about the division of labor and intra-colonial cooperation
and conflict in an ant colony by developing a new unsupervised learning data
mining method (DS2L-SOM : Density-based Simultaneous Two-Level - Self Or-
ganizing Map) to find homogeneous clusters (i.e., sets of individual witch share
a distinctive behavior). This method is very fast and efficient and it also allows a
very useful visualization of results.
1 Introduction
Radio Frequency IDentification (RFID) is an advanced tracking technology. The RFID
tags, consisting of a microchip and an antenna, must be used with a reader that can
detect simultaneously a lot of tags in a single scan. A computer is used to store the
data about the positions of each tag for each scan in a database. This allows different
treatments, including to replenish the historical. RFID, thanks to miniaturization, offers
the advantage of automation and overcomes the constraints imposed by video analyzes.
RFID systems can be used to study animal societies. Animal societies are dynamic
systems characterized by many interactions between individuals. Such dynamic struc-
ture stems from the synergy of these interactions, the individual capacities in informa-
tion treatment and the diversity of individual responses [1]. The aim of this work is to
develop a new RFID-based autonomous system to follow the spatio-temporal activity
of groups, which is currently unknown and to develop new tools for automatic data
processing. These objectives make this work an interdisciplinary project combining be-
havioral and complex systems sciences with computer and engineering sciences.
A miniaturized version of RFID can be adapted and used in natural conditions and
it has already been used in the field of ethology. However, experiments with RFID
generate large datasets which need suitable analysis methods to allow a comprehensive
understanding of the link between events and and reveal behavioral patterns. In this
Cabanes G., Bennani Y., Chartagnat C. and Fresneau D. (2008).
Topographic Connectionist Unsupervised Learning for RFID Behavior Data Mining.
In Proceedings of the 2nd International Workshop on RFID Technology - Concepts, Applications, Challenges, pages 63-72
DOI: 10.5220/0001733400630072
Copyright
c
SciTePress

work, we study how to transform these data to obtain knowledge about the division
of labour and intra-colonial cooperation and conflict in an ant colony. A RFID device
has been developed for this biological model. Based on marketed products, it requires
little development. It consists of a network of RFID readers in a constraint space with
compulsory passageways in an artificial nest. These readers are connected to a detector
which sends the information to a computer.
The analysis of the collected data uses modern methods of data mining, based on a
new unsupervised learning algorithm (DS2L-SOM : Density-based Simultaneous Two-
Level - Self Organizing Map [2], [3]). Unsupervised classification, or clustering, is a
very powerful tool for the automatic detection of relevant sub-groups or clusters in un-
labeled data sets, when one does not have prior knowledge about the hidden structure
of these data. These methods are particularly suited for data mining from experimental
studies, for which we have generally little a priori information. The evolution of these
data over time and their spatial position require the exploration of multiple data sets
described in high dimension spaces. DS2L-SOM is an effective connectionist unsuper-
vised clustering tool to find and simply represent a significant amount of information
about the structure of data. We chose to apply this method to data from experimental
research because of its efficiency in the extraction of information in this field and the
discovery of scientific results. This method allows the discovery of a topological space
from a set of behavioral observations.
The remainder of this paper is organized as follows. Section 2 presents the DS2L-SOM
algorithm. Section 3 describes the experimental protocol of the behavioral study. In
section 4 we show some results and their interpretations. Conclusion and future works
are given in section 5.
2 A Topographic Connectionist Unsupervised Learning
In high dimensions data may be sparse (the curse of dimensionality), making it difficult
for a clustering algorithm to find any structure in the data. Indeed, when dimensionality
increases, data become increasingly sparse in the space that it occupies. Definitions of
density and distance between objects, which is critical for clustering and outliers detec-
tion, become less meaningful. To improve this problem, a large number of dimension
reduction approaches have been developed and tested in different application domains
and research communities. The main idea behind these techniques is to map each pat-
tern into a lower dimensional space that preserves the topology of the data. The reduced
data present in the lower dimensional representation can be used to perform clustering
more efficiently. Various approaches have been proposed for the two-level clustering
problem [4], [5], [6], [7], [8], [9].
The key idea of the two-level clustering approach based on a SOM (Self Organizing
Map, [10], [11]) is to first combine the dimensionality reduction and the fast learning
capabilities of SOM to construct a new reduced vector space, then to apply another
clustering method in this new space to produce a final set of clusters in the second level
[6], [7], [8]. Although the two-level methods are more interesting than the traditional
approaches, the data segmentation obtained from the SOM is not optimal, since a part
64

of the information is lost during the first stage (dimensionality reduction). Moreover,
this separation in two stages is not suited for a dynamic (incremental) segmentation of
data which move in time, despite the important needs for such analysis.
We propose here a new unsupervised learning algorithm (DS2L-SOM, [3]) which
learns simultaneously the structure of the data and its segmentation using both distance
and density information.
2.1 Principle of the SOM
The Kohonen SOM can be defined as a competitive unsupervised learning neural net-
work. When an observation is recognized, activation of an output cell competition
layer leads to inhibit the activation of other neurons and to reinforce itself. It is said
that it follows the so called “Winner Takes All” rule. Actually, neurons are specialized
in the recognition of one kind of observations. A SOM consists in a two dimensional
map of neurons which are connected to n inputs according to n weights connections
w
(i)
= (w
(i)
0
, ..., w
(i)
n
) (prototype vectors) and to their neighbors with topological links.
The training set is used to organize this map under topological constraints of the input
space. Thus, a mapping between the input space and the network space is constructed;
two nearby observations in the input space would activate two close units of the SOM.
An optimal spatial organization is determined by the SOM from the input data, and
when the dimension of the input space is lower than three, both position of weights
vectors and direct neighborhood relations between cells can be represented visually.
Thus, a visual inspection of the map provides qualitative information about the map
and the choice of its architecture. The winner neuron updates its prototype vector, mak-
ing it more sensitive for latter presentation of that type of input. This allows different
cells to be trained for different types of data. To achieve a topological mapping, the
neighbors of the winner neuron can adjust their prototype vector towards the input vec-
tor as well, but to a lesser degree, depending on how far away they are from the winner.
Usually a radial symmetric Gaussian neighborhood function is used for this purpose.
2.2 The DS2L-SOM Algorithm
Connectionist learning algorithms are often presented as a minimization of a cost func-
tion. In our case, it will be carried out by the minimization of the distance between the
input samples and the map prototypes, weighted by a neighborhood function K
ij
. To
do that, we use a gradient algorithm.
The DS2L-SOM algorithm is an adaptation of the S2L-SOM algorithm [2]. In S2L-
SOM, each neighborhood connection is associated with a real value v which indicates
the relevance of the connected neurons. The value of this connection is adapted during
the learning process. Given the organization constraint of the SOM, both best closest
prototypes of each data point must be connected by a topological connection. This con-
nection “will be rewarded” by an increase of its value, whereas all other connections
from the winner neuron “are punished” by a reduction of their values. It was proved by
Martinetz [12] that the so generated graph is topology-preserving optimally in a very
general sense. In particular each edge of this graph belongs to the Delaunay triangula-
tion corresponding to the given set of reference vectors. For each data point, both best
65

closest prototypes are connected by a topological connection. The value of this connec-
tion will be increased, whereas the value of all other connections from the best match
unit will be reduced. Thus, at the end of the training, a set of inter-connected proto-
types will be an artificial image of well separated sub-group of the whole data set. In
the DS2L-SOM algorithm, we propose also to associate each unit i to an estimation of
the local data density D
(i)
, so as to detect local fluctuation of density which defines the
borders of touching clusters (undetected in S2L-SOM). For each data point, this den-
sity value will be increased for all units in function of the Euclidean distance between
the related prototype w
(i)
and the data. This method of evaluation is similar to the one
proposed by [13]. One can notice that, in the DS2L-SOM algorithm, the estimation of
the local density data is made during the training of the map, i.e. it is not necessary to
keep the data in memory.
At the end of the learning process, prototypes which are linked together by neigh-
borhood connections such as v > 0 define well separated clusters. Thus, we use a “Wa-
tersheds” method (see [14]) on the density map of each of these clusters to find locally
low density area inside well separated clusters so as to characterize density defined sub-
clusters. We use for each pair of adjacent subgroups a density-dependent index [15] to
determine if an area of low density is a reliable indicator of the data structure, or whether
it should be regarded as a random fluctuation in the density. This process is very fast
because of the reduced number of prototypes. The combined use of these two types of
group definition can achieve good results despite the low number of prototypes of the
map.
3 RFID Monitoring of an Ants Colony
Ants are quite surprising, often caricatured and badly known, yet their ecological impact
is considerable. Among social animals, the Formicidae family (11 000 known species)
certainly shows the greatest diversity of social structures and related behaviors. Its study
is central in evolutionary biology: the kin selection theory [16] say that worker sterility
is transmitted to the next generation through fertile kin. This criterion is fulfilled in some
Ponerines society with simple familial structure (one queen mated with one male). This
familial structure is the basis of the apparent harmony and cohesion of a colony.
The dynamic of task allocation through worker ontogenesis has widely been de-
scribed in anterior studies, but the difficulty in acquiring the data and the lack of auto-
matic tools discouraged this kind of long research. Yet it is essential to find the rules
that govern ant individual behavior and their integration at the colony scale. Under-
standing this phenomenon necessitates to be able to integrate the two levels of analysis.
Thus, the individual monitoring of ant foragers showed the elementary rules that each
ant follows [17], [18]. Undoubtedly, the use of RFID technology will be very useful to
obtain highly interesting results, such as a knowledge database about social agents and
the analysis of its dynamic features.
However, RFID applied to ants shows some feasibility problems because weight
limitations imply a good miniaturization of the tags and good performances for the read-
ers. Yet Streit et al. [19] recently used RFID technology to study bee longevity and time
spent between foraging and nurse behavior. For this study, we chose a big-sized trop-
66
ical ant Pachycondyla tarsata, making subterranean nests distributed in various rooms
interconnected on some about ten metres. Colonies of these species are composed typi-
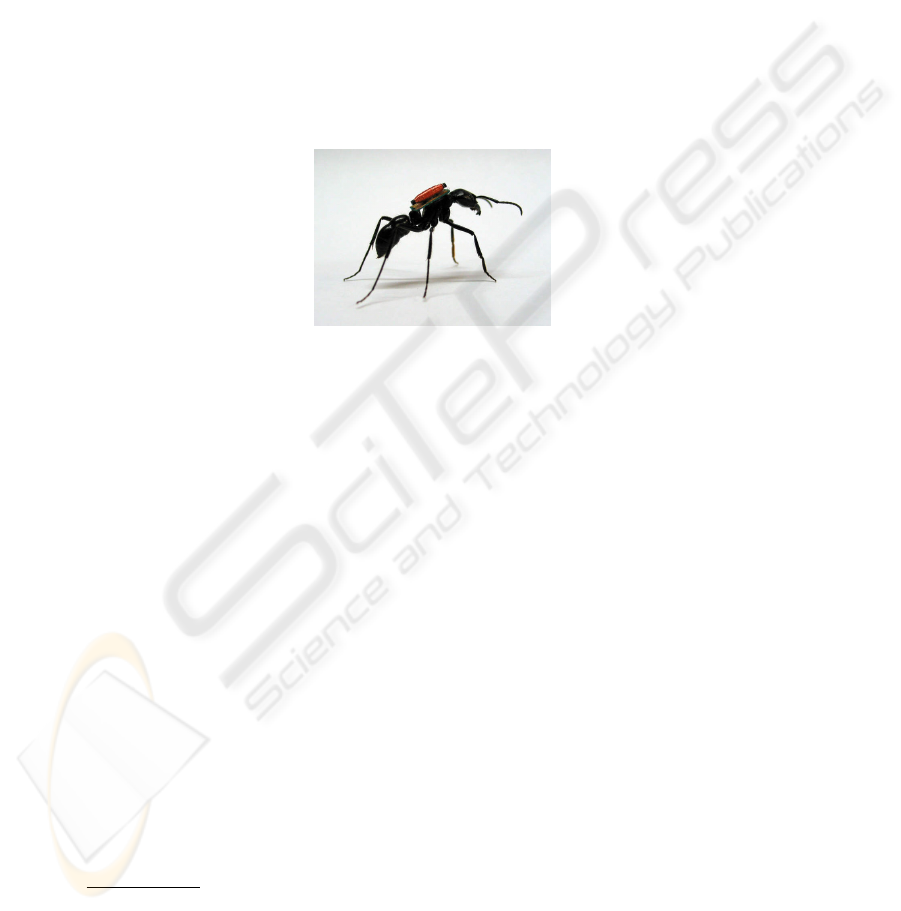
cally from ten to few thousand ants. RFID tag consists of a chip attached to an antenna
weighting under 40 mg (i.e., 25% of an ant weight), glued on the animal thoraces (Fig.
1). Preliminary tests showed that the tags don’t disturb the ant behavior and the colony
dynamic significantly.
3.1 Measurement Device
A colony of Pachycondyla tarsata with a queen and 33 workers was monitored in the
RFID device for 36 hours (about 270 000 scans). Each worker had a tag
1
attached to its
thorax (Fig. 1).
Fig. 1. Ant with RFID tag.
The experimental device is an artificial anthill consisting of three rooms (Room
1, Room 2 and Room 3) and a foraging area (Room 0), linearly connected by three
tunnels (Fig. 2). The queen (not tagged) and its eggs stay permanently in the Room 3,
the farthest from the foraging area. Each tunnel is equipped with two RFID readers
1
that detect the passage and the direction of tagged individuals between rooms. The
position of an individual may be inferred unambiguously by the information provided
by the six readers in the tunnels. The lack of detection implies that the individual is
out of the tunnel and thus in one of the four rooms. The exact location of a tag (i.e., of
an individual) can be deduced from the travel direction. The information recorded by
readers are handled by an electronic RFID, and then sent to a computer which creates
the data files and store them.
3.2 Data
The data files are in text format. They indicate, for each antenna scan (about three scans
per second), the scan number, the date, time, and, for each individual (i.e., for each tag),
which antenna is activated (Fig. 3). If, during a scan, none is detected, nothing appears
in the data file.
1
Made by SpaceCode : http://www.spacecode-rfid.com/
67
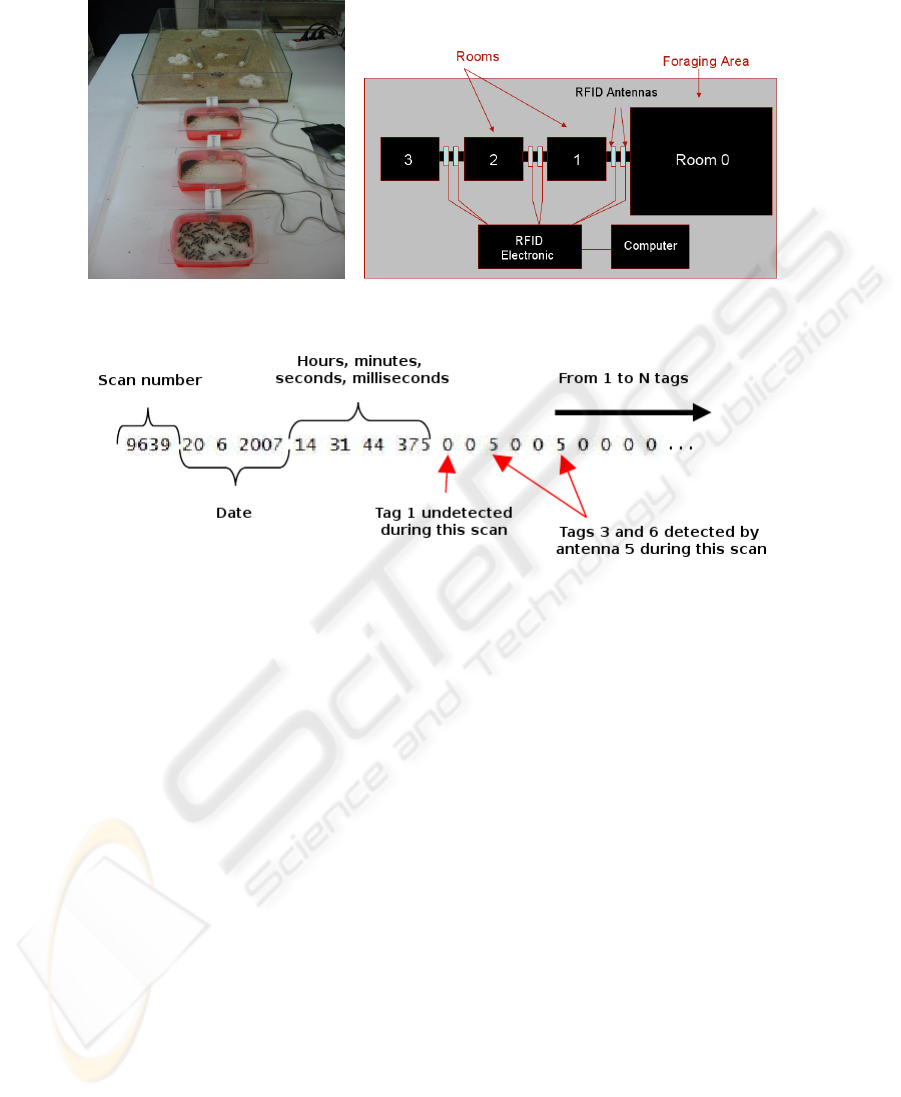
Fig. 2. The RFID experimental device.
Fig. 3. Example of a recorded scan in the data file.
The recording system consists of four rooms (Room 0 to 3) connected to each other
by three tunnels, each containing two RFID readers (antennas 1 to 6), which detect the
passage of ants. If an ant move from room 0 to room 1, it is detected by successive
antennas 1 and 2. This allows us to infer the exact position of each ants at any moment
(it is considered that an ant has changed its room when it is detected by the second an-
tenna). A simple treatment on these files makes it possible to obtain spatial information
for each individual. For this study we take into consideration only the proportion of
time spent in each room (budget time) for each individual.
Therefore each individual was coded in a vectorial form, by the proportion of time
spent in each area (i.e., 4 features in [0, 1]), then we applied the algorithm DS2L-SOM
on these data. The distance measure used by the algorithm for this study is the χ
2
distance, more suited than the Euclidean distance for proportion features.
4 Results
Figure 4(a) represents the map obtained with DS2L-SOM. Indeed, the DS2L-SOM clus-
tering algorithm is a powerful tool for visualization of the obtained segmentation in two
dimensions. Clusters are easily and clearly identifiable, as well as fields without data
(unconnected neurons).
68
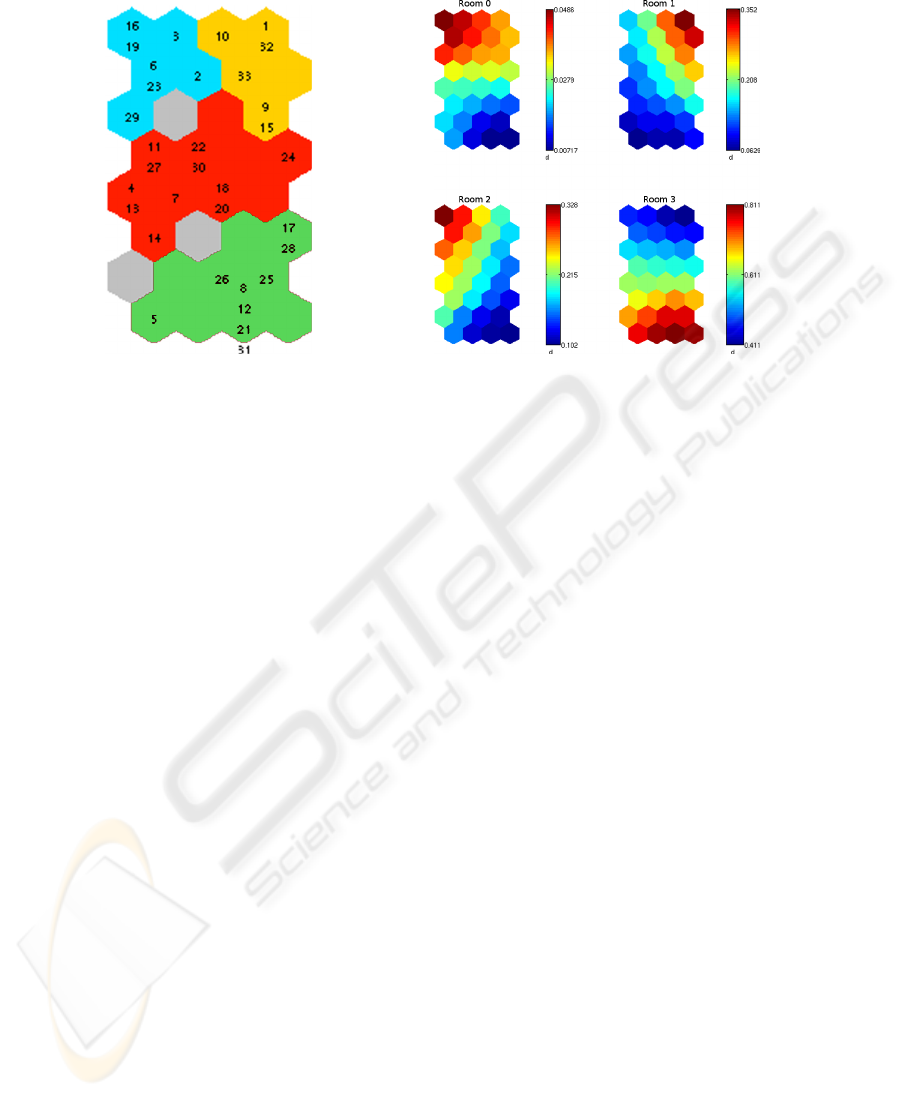
(a) Obtained map. (b) Profiles of prototypes.
Fig. 4. Map obtained from RFID data and profiles of prototypes.
In these figures, each hexagon represents a prototype of the SOM and its associated
tags (i.e., ants). Two neighboring hexagons represent two similar prototypes and thus
two similar behaviors. The numbers inside the hexagons represent the tags associated to
this prototype. Hexagons that share a color in the Fig.4(a) belong to the same cluster, a
cluster represent a set of ants which share a distinct behavior. Grey hexagons are not part
of any cluster. Red hexagons (unlike blue one) in the Fig.4(b) means that individuals
represented by this prototype spend much time in the related Room.
The final segmentation of the map shows four types of behavior with regards to the
occupation of rooms (Fig. 4(a)). We can characterize each type depending on the profile
of their prototypes (Fig. 4(b)).
“Green” individuals are characterized by a significant occupation of the Room 3
(the Queen’s room), to the exclusion of others. On the contrary, the “blue” and “yellow”
ants spend more time than others in the foraging area, while the “yellow” ants spend
a lot of time in Room 1, “blue” ants stay longer in the Room 2. Finally, individuals
from the “orange” group present an intermediate profile, they are not characterized by
a particular room occupancy when compared to other ants.
The representation according to a Sammon mapping of the prototypes (Fig. 5) allows a
more detailed analysis of the structure of each group and their relationships. Indeed, the
clustering is accompanied by a set of information that may be used to expand the data
analysis, such as the matrix of distances between prototypes, the density matrix and also
the values of connections that can be used to determine the relative importance of each
prototype for the representation of the data. Moreover, the map provides information on
the relationship between the groups, two groups close on the map being more similar
than two distant groups. Finally, the presence of some unrepresentative prototypes (with
null connections values between them and their neighbors) gives an idea about the shape
69
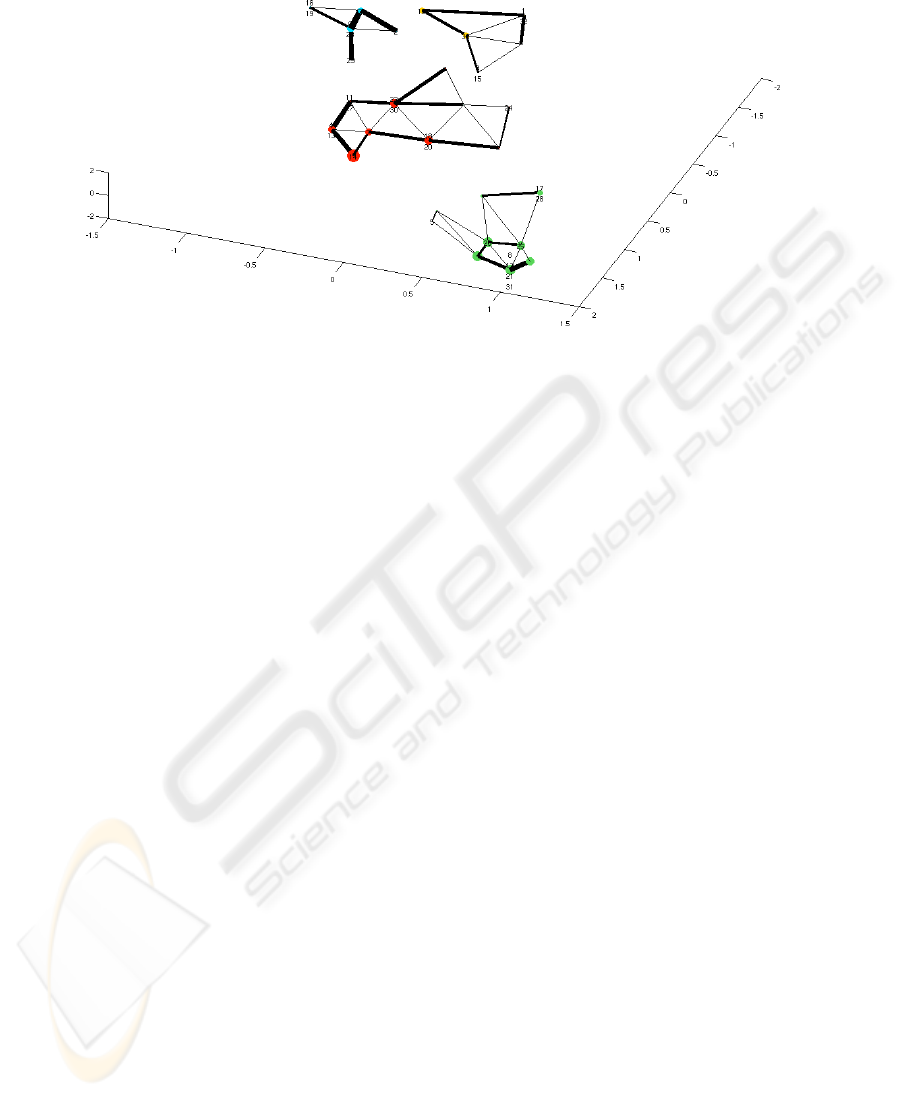
Fig. 5. Sammon mapping of prototypes and their connections, from the RFID data.
of groups in the input space. We can represent all of this information into a single figure
( figure 5).
The balls represent the prototypes shown in a three-dimensional space by a non-linear
Sammon mapping [20] respecting the distances between prototypes. The ball sizes are
proportional to the density associated with each prototype. Colours depend on the as-
sociated cluster and connections thickness is proportional to the value associated with
these connections.
With this additional information, we can see that the “green” group is composed of a
dense nucleus of individuals (i.e., 8, 12, 21, 31, 26 and 25) which are very representative
of their group (i.e., associated with well-connected prototypes) and a set of marginal
individuals (5, 17 and 28) compared to that group (associated with prototypes little
connected to the other). Prototypes of the nucleus are very close to each other and
distant from other groups. This means that individuals represented are similar to each
other and highly specialized in their occupation of space (here the Room 3, the queen’s
room). Marginal individuals show an intermediate behavior compared with the other
groups: they are less specialized than the nucleus members.
Individuals in the “blue” group are also well specialized in their space occupation,
i.e., the Room 2 and the foraging area. Their prototypes are close and well-connected
and, in particular, individuals 6 and 23 are very representative of the group. In contrast,
individuals of the “yellow” group present a less specialized behavior. Their prototypes
are more distant from one another, while properly connected.
Finally, the “orange” group characterizes generalist ants. Most of the prototypes are
well connected to the others and there is no marginal behavior (except for individual
24), but there is also an important distance between these prototypes, indicating a wide
variety of behaviors between individuals in the group.
This segmentation undoubtedly results from the division of labour between individ-
uals in the colony. The ants in the “blue” group must be specialized in foraging and food
70

processing. The “yellow” ants, which spend less time outdoors and have a more diverse
spatial distribution, probably handle maintenance tasks, while ants in the “green” group
take care of the queen and brood. The “orange” group could be composed of low-skilled
individuals which have a more versatile activity (or maybe no particular activity) in the
colony.
This study was replicated on a orphaned colony where queen’s absence is compensated
with several workers eggs laying. The clustering ended strictly in the same conclusions.
5 Conclusions and Future Work
The new unsupervised clustering method (DS2L-SOM) used in this article is a very
efficient data mining and visualization tool for behavioral studies based on RFID tech-
nology. It allows discovering groups defined either by distance or by density, whatever
their form or the difference of densities between groups and within a group. It is quite
fast, suitable for continuous learning and allows very simple and effective visualization
with a non-linear projection of the data structure on a two-dimensional map. Here, we
were able to highlight the characteristics of spatial organization in ants colonies. The in-
dividuals were well included according to their localization. Our approach also allows a
detailed description of the characteristic behaviors of every group of individuals. These
descriptions allowed associating to each of these groups a social task. These deductions
are perfectly compatible with the results of previous works using classic methods [21],
[1]. So DS2L-SOM is a very powerful tool for processing and visualizing RFID data in
experimental studies.
Although we used in this study a few simple parameters of individual space oc-
cupancy, the method is perfectly suited for the study of thousands of individuals, with
behaviors described by a large number of spatio-temporal parameters.So, rather than the
simple individual localization, the dynamic follow-up of the movements of ants would
bring a supplementary dimension to the analysis of the distribution of the social roles.
Also, by continuing the automation of these tracking systems it would be possible to
control experimental devices which allowed modifying the environment according to
the identity and the history of the individuals (controlled accesses to specific sectors or
induction of some stimuli or reinforcement).
Acknowledgements
This work was supported in part by the Sillages project (N
o
ANR - 05 - BLAN -
017701) financed by the ANR (Agence Nationale de la Recherche).
References
1. Fresneau, D., Corbara, B., Lachaud, J.: Organisation Sociale et Structuration Spatiale Autour
du Couvain chez Pachycondyla apicalis. Actes coll. Insectes Sociaux 5 (1989) 83–92
71

2. Cabanes, G., Bennani, Y.: A simultaneous two-level clustering algorithm for automatic
model selection. In: Proceedings of the International Conference on Machine Learning and
Applications (ICMLA’07), Cincinnati, Ohio, USA (2007)
3. Cabanes, G., Bennani, Y.: A Local Density-Based Simultaneous Two-Level Algorithm for
Topographic Clustering. In: Proceeding of the International Joint Conference on Neural
Networks (IJCNN’08), Hong Kong, China (2008)
4. Aupetit, M.: Learning topology with the generative gaussian graph and the em algorithm.
In: NIPS. (2005)
5. Bohez, E.L.J.: Two level cluster analysis based on fractal dimension and iteratedfunction
systems (ifs) for speech signal recognition. IEEE Asia-Pacific Conference on Circuits and
Systems (1998) 291–294
6. Hussin, M.F., Kamel, M.S., Nagi, M.H.: An efficient two-level SOMART document cluster-
ing through dimensionality reduction. In: ICONIP. (2004) 158–165
7. Ultsch, A.: Clustering with SOM: U*C. In: Proceedings of the Workshop on Self-Organizing
Maps. (2005) 75–82
8. Gu
´
erif, S., Bennani, Y.: Selection of clusters number and features subset during a two-levels
clustering task. In: Proceeding of the 10th International Conference Artificial intelligence
and Soft Computing 2006, Palma de Mallorca, Spain (2006) 28–33
9. Korkmaz, E.E.: A two-level clustering method using linear linkage encoding. International
Conference on Parallel Problem Solving From Nature, Lecture Notes in Computer Science
4193 (2006) 681–690
10. Kohonen, T.: Self-Organization and Associative Memory. Springer-Verlag, Berlin (1984)
11. Kohonen, T.: Self-Organizing Maps. Springer-Verlag, Berlin (2001)
12. Martinetz, T.: Competitive hebbian learning rule forms perfectly topology preserving maps.
In Gielen, S., Kappen, B., eds.: Proceedings of the International Conference on Artificial
Neural Networks (ICANN-93), Amsterdam, Heidelberg, Springer (1993) 427–434
13. Pamudurthy, S.R., Chandrakala, S., Sakhar, C.C.: Local density estimation based clustering.
Prodeeding of International Joint Conference on Neural Networks (2007) 1338–1343
14. Vincent, L., Soille, P.: Watersheds in digital spaces: An efficient algorithm based on immer-
sion simulation. IEEE Trans. Pattern Anal. Mach. Intell. 13 (1991) 583–598
15. Yue, S.H., Li, P., Guo, J.D., Zhou, S.G.: Using greedy algorithm: DBSCAN revisited II.
Journal of Zhejiang University SCIENCE 5 (2004) 1405–1412
16. Hamilton, W.: The genetical evolution of social behaviour. Journal of Theoretical Biology 7
(1964) 1–52
17. Fresneau, D.: Individual foraging path fidelity: a novel strategy in a ponerine ant. Ins. Soc.
32 (1985) 109–116
18. Goss, S., Fresneau, D., Deneubourg, J.L., Lachaud, J.P., Valenzuela-Gonzalez, J.: Individual
foraging in the ant Pachycondyla apicalis. Oecologia 80 (1989) 65–69
19. Streit, S., Bock, F., Pirk, C.W.W., Tautz, J.: Automatic life-long monitoring of individual
insect behaviour now possible. Zoology 106 (2003) 169–171
20. Sammon Jr., J.: A nonlinear mapping for data structure analysis. 18 (1969) 401–409
21. Fresneau, D., Dupuy, P.: Behavioural study of the primitive ant Neoponera apicalis. Anim.
Behav. 36 (1988) 1389–1399
72
