
FACILITATION SUPPORT FOR ON-LINE FOCUS GROUP
DISCUSSIONS BY MESSAGE FEATURE MAP
Noriko Imafuji Yasui
1
, Shunsuke Saruwatari
1
, Xavier Llor`a
2
and David E. Goldberg
1
1
IllGAL, University of Illinois at Urbana-Champaign, 104 S.Mathews Ave., Urbana, IL 61801, U.S.A.
2
NCSA, University of Illinois at Urbana-Champaign, 1205 W.Clark St., Urbana, IL 61801, U.S.A.
Keywords:
Focus group discussion, facilitation, message feature map.
Abstract:
Face-to-face focus group discussion has been one of the reliable approaches for collecting variety of ideas and
opinions for building marketing strategy, even though various network-based communication tools have been
available. This is due to complications in facilitation of on-line discussions. The goal of this paper is to maxi-
mize the profit from on-line focus group discussions by supporting facilitators’ task. In this paper, we propose
a message feature map and two metrics for measuring message feature; centrality and novelty. The message
feature map plots discussion messages on centrality-novelty plane, and gives us intuitive understanding of the
discussions in various aspects. Reporting experimental results by using real data collected in on-line focus
group discussions, we discuss how we can utilize the message feature map for the effective facilitation.
1 INTRODUCTION
For these years, network-based communication has
come into wide use. People can easily access various
types of communication tools and use them for ob-
taining information, exchanging opinions and propa-
gating ideas. An objective of the focus group discus-
sions is to collect wide range of opinions and ideas.
Variety of ideas and opinions is highly valued. In case
of the on-line, we can obtain wide variety of many
ideas by having multiple discussions simultaneously
with various groups of diverse people.
The goal of this paper is to maximize the profit
from on-line focus group discussions by supporting
discussion facilitators’ task. We propose a message
feature map, which is a visualization method for intu-
itive understanding of discussion status in various as-
pects. The message feature map plots each message
on the plane of the axes with the two metrics; central-
ity and novelty of each message. Centrality indicates
how much each message is center (or conversely, pe-
ripheral) in the discussion. Novelty tells us how much
each message contains novel (or conversely, conven-
tional) ideas.
2 MESSAGE FEATURE MAP
Success in on-line facilitation highly depends on how
quickly and easily they can analyze the discussions
in various aspects. This section proposes a message
feature map. After we introduce two metrics for mea-
suring message feature, we describe a classification of
message characteristics into four types.
2.1 Measuring Message Feature
Centrality. This centrality metric measures how
much messages are center, conversely peripheral, in
the discussion. Suppose a discussion can be repre-
sented by a sequence of messages (m
1
, m
2
, ··· , m
n
).
By using the KEE algorithm ((Imafuji Y. et al.,
2007)), we calculate the score for each message k
times with different sets of messages. The message
centrality is obtained as the highest score in the k
message scores. Let M be a message score vec-
tor obtained by the KEE algorithm, and M(m
i
) be
the score for the message m
i
. Denote the central-
ity of the message m
i
by c(m
i
), c(m
i
) is defined by
c(m
i
) = max
i≤ j<i+k
M
j
(m
i
), (0 ≤ c(m
i
) < 1), where
M
j
(m
i
) is a score of the message m
i
by the calculation
for a set of k messages {m
j− k+1
, ··· , m
j− 1
, m
j
}.
Novelty. This novelty metric measures how much
messages include something new; ideas, topics, opin-
ions and etc. We assume that the message is novel,
if the messages contains a lot of terms which are not
previously used. Thus, we employ the simplest and
the easiest way for measuring novelty, that is, count-
563
Imafuji Yasui N., Saruwatari S., Llorà X. and E. Goldberg D. (2008).
FACILITATION SUPPORT FOR ON-LINE FOCUS GROUP DISCUSSIONS BY MESSAGE FEATURE MAP.
In Proceedings of the Tenth International Conference on Enterprise Information Systems - AIDSS, pages 563-566
DOI: 10.5220/0001705105630566
Copyright
c
SciTePress

center
peripheral
np
cp
nc
cc
novel
conventional
Figure 1: Sample of the message feature map; plotting
messages on centrality (horizontal axis)- novelty (vertical
axis) plane. Four plotted areas are called np (upper-left), nc
(upper-right), cc (lower-right), and cp (lower-left).
ing the number of new terms in each message. We
define a new term in a message as a term which is not
appeared in some previous messages. If the novelty
of the message (or the message novelty, for short) is
high, the message would contain something new, and
initiate a new topic. Conversely, the low novelty in-
dicates the message would be following the existing
topic, or the message would be of no importance (in
case of the short messages).
Suppose a discussion can be represented by a se-
quence of messages (m
1
, m
2
, ··· , m
n
). Denote the
novelty of the message m
i
by n(m
i
), n(m
i
) is de-
fined by n(m
i
) = N
l
(m
i
), where N
l
(m
i
) is a number
terms which are not existed in a set of the messages
{m
i−l
, ··· , m
i−1
}. The novelty is also transformed so
that the values are in the range of -1 to 1.
2.2 Message Feature Classification
The message feature map plots each message on
centrality-novelty plane. The Figure 1 is a sample
of a message feature map. The horizontal axis indi-
cates the centrality and the vertical axis indicates the
novelty. In this sample, messages are plotted with dif-
ferent colors (and shapes) for each discussant.
As seen in the figure, the message feature map is di-
vided into four areas; np (upper-left), nc (upper-right),
cc (lower-right), and cp (lower-left). The followings
are the plotted areas and the characteristic of the mes-
sages plotted in each area.
np -Potential chances. The messages plotted in this
area have high novelties and low centralities. The
messages of this type have new, but rare ideas, opin-
ions, topics and etc, which any other discussant is not
paying attention, nor talking about those topics any
further. These messages may turn out to be sources of
the ideas for new product or services in enterprises.
nc -Topic triggers. The messages plotted in this area
have high novelties and high centralities. The mes-
sages of this type lead new topics. The messages
bring new ideas or topics to the discussions. Originat-
ing from this message, the current discussion topics
are shifted to the topics of these messages. The leads
to discussion mainstream can be detected by observ-
ing these messages.
cc -Topic followers. The messages plotted in this area
have low novelties and high centralities. The mes-
sages of this type give more ideas or deeper insights
on the current topics. The discussion topics are some-
how converged by these messages. The discussion
mainstream can be detected by observing these mes-
sages.
cp -Trifles. The messages plotted in this area have
low novelties and low centralities. The messages of
this type do not influence on the discussion going.
The message content doesn’t have any specific topic.
Questions by discussion facilitators, yes and no an-
swers, and simply, short messages are plotted in this
area. The discussion is inactive if many messages are
plotted in this area.
3 EMPIRICAL STUDY
In the previous section, we proposed the message fea-
ture map, and described the message classification on
the message feature map. This section studies empir-
ically how the message feature map supports facilita-
tors’ task. The discussion data (78 messages by six
participants) was collected from the focus group dis-
cussions held on March 2005. The goal of the discus-
sions was to identify ”future scenarios for cell phone
usages and the features that will make them popular
among consumers”. The data consists of a sequence
of messages (arranged in time order). A message con-
sists of message id, time, title, author name, replying
message id, and message content.
3.1 Effective Facilitation
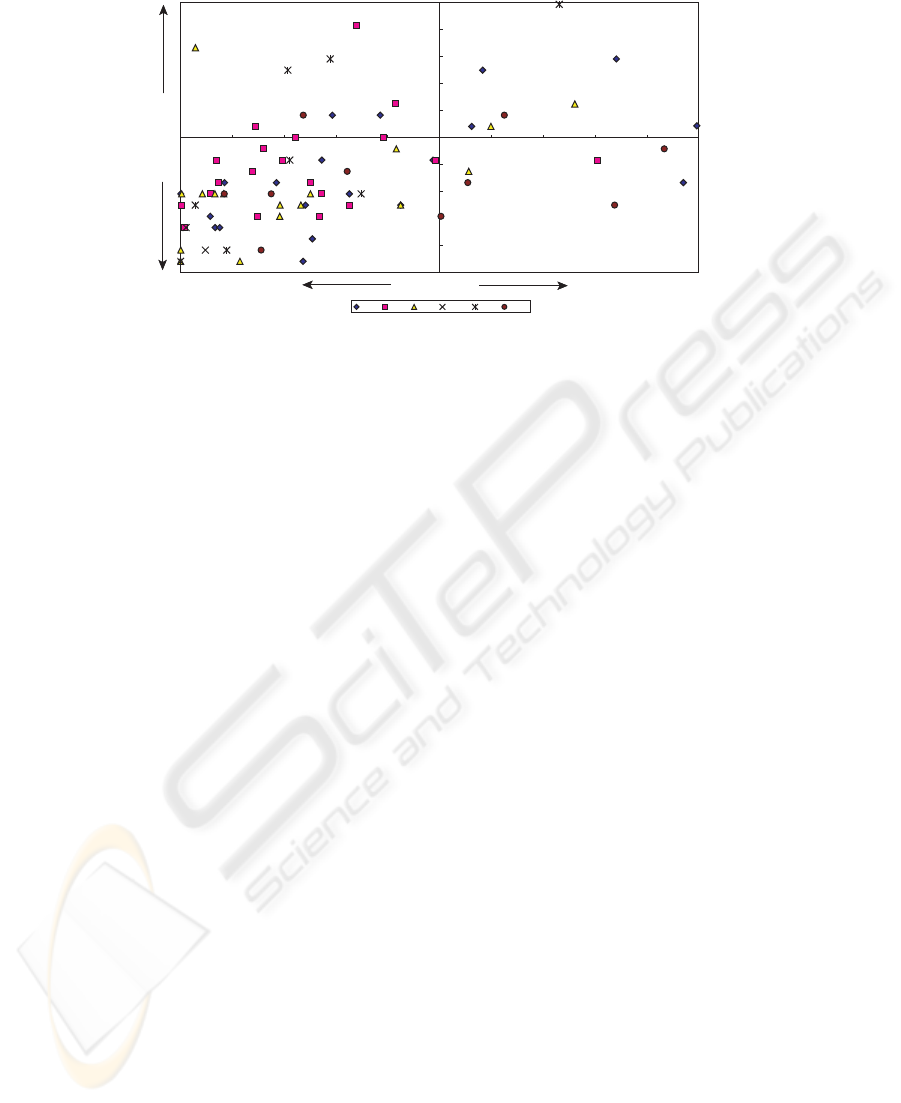
Figure 2 depicts the message feature map using data
derived from one of the discussion group. The hor-
izontal axis and the vertical axis represent message
centrality and novelty, respectively. In this experi-
ment, we used k = 10 for the centrality, and l = 10
for the novelty. Each message is colored (or shaped)
differently for each participant.
The biggest advantage of the message feature map
is its comprehensibility. By looking at the map from
different angles, facilitators’ important work load, es-
pecially, analyzing and controlling, can be relieved.
Here are some effective use examples for the facilita-
tion support.
ICEIS 2008 - International Conference on Enterprise Information Systems
564
㪄㪈
㪄㪇㪅㪏
㪄㪇㪅㪍
㪄㪇㪅㪋
㪄㪇㪅㪉
㪇
㪇㪅㪉
㪇㪅㪋
㪇㪅㪍
㪇㪅㪏
㪈
㪄㪈 㪄㪇㪅㪏 㪄㪇㪅㪍 㪄㪇㪅㪋 㪄㪇㪅㪉 㪇 㪇㪅㪉 㪇㪅㪋 㪇㪅㪍 㪇㪅㪏 㪈
㪥㫆㫍㪼㫃㫋㫐
㪚㪼㫅㫋㫉㪸㫃㫀㫋㫐
㪧㪇㪈 㪧㪇㪉 㪧㪇㪊 㪧㪇㪋 㪧㪇㪌 㪧㪇㪍
Figure 2: Message feature map derived from a real on-line focus group discussion. Each plot indicates a message, and each
plot shape represent each discussion participant.
Screening Messages. The more discussion groups
the facilitators have to take care, the more impractical
they read all the message contents. The message fea-
ture map tells intuitively which messages they should
focus on.
The messages plotted in the np area are contain-
ing many variable minority opinions and ideas. If the
facilitators want to find rare, but creative ideas, they
should take a look at these messages. In the experi-
ment, there was a message ”one of the biggest things I
see for cell phones ... is money withdrawal. By linking
your cell phone and debit card, you could buy stuff
using cell phone and PIN number”. Although any
other participants never mentioned about debit cards
on phones, this idea might have potential into prac-
tice.
The messages plotted in the righter area contain
major topics that many other participants are talking
about. If the facilitators want to find mainstream ideas
which are supported by many people, they should take
a look at these messages. In the experiment, one of the
messages plotted in nc area was about camera func-
tion on cell phone, which had not been popular in US
yet at the time of the discussion, and actually became
popular a while after the discussion.
Monitoring Participants. One of the biggest advan-
tages of the on-line focus group discussions is the par-
ticipants’ accessibility. We can have a series of dis-
cussions with various groups of participants by strate-
gically changing or grouping together some partic-
ipants. The message feature map gives us a quick
grasp behavior tendency of each participant.
For the example of Figure 2, four messages out
of eight in the nc area were by participant P01. We
could have an assumption that P01 was good at gen-
erating new topics. P02 wrote as many messages as
P01 wrote, but the messages by P01 are mostly plot-
ted in the cc area. This observation indicates that P01
has more potential of idea generation than P02 does.
The messages by P05 are not as many as P01 and P02,
but some of the messages are plotted in upper. P05
might display his creativity when his interests match
the discussion topics.
Controlling Discussion. One of the most critical
essences for success in discussions is to keep the dis-
cussions excited and the participants active. To do
so, the facilitators have to pay attentions to discus-
sion activeness and make sure that all the participants
actively enjoy the discussions. The message feature
map tells clearly when the discussion is getting stag-
nant.
Figure 3 shows the three message feature maps
(extracted from Figure 2); from 18th to 27th messages
(left), from 28th to 37th message (center) and from
38th to 47th (right). The messages in both left and
right maps are plotted over four areas, which mean
the discussion was very active during the periods. Es-
pecially, some messages in the right map are plot-
ted quite upper, which means the discussion was very
productive during the period. On the other hand, most
of the messages from 28th to 37th are plotted in the
area cc, which indicates that the discussion was con-
tracting and getting stagnant. If many messages come
to be plotted in the area cc, the facilitators have to
swing into action by asking something or talking to
the participants, whose messages are plotted in upper
area, for instance.
FACILITATION SUPPORT FOR ON-LINE FOCUS GROUP DISCUSSIONS BY MESSAGE FEATURE MAP
565

㪧㪇㪈 㪧㪇㪉 㪧㪇㪊 㪧㪇㪋 㪧㪇㪌 㪧㪇㪍
㪄㪈
㪇
㪈
㪄㪈 㪄㪇㪅㪌 㪇 㪇㪅㪌 㪈
㪄㪈
㪇
㪈
㪄㪈 㪄㪇㪅㪌 㪇 㪇㪅㪌 㪈
㪄㪈
㪇
㪈
㪄㪈 㪄㪇㪅㪌 㪇 㪇㪅㪌 㪈
㪤㪼㫊㫊㪸㪾㪼㩷㪈㪏㪄㪉㪎
㪤㪼㫊㫊㪸㪾㪼㩷㪉㪏㪄㪊㪎
㪤㪼㫊㫊㪸㪾㪼㩷㪊㪏㪄㪋㪎
Figure 3: Message feature maps for the messages 18th-27th (left), 28th-37th (middle), and 38th-47th (right).
4 CONCLUSIONS
In this paper, we proposed a message feature map,
which was a visualization for plotting discussion mes-
sages on a plane with two axes. We also introduced
two metrics; centrality and novelty. This map gave us
an intuitive understanding and quick grasp of discus-
sion status. We showed the experimental results with
using the data collected in a real on-line focus group
discussion, and presented some scenarios for facilita-
tion support usages by the message feature maps.
Our future works include to build a message tran-
sition model which tells how message status transit on
the message feature map, and to simulate discussion
for a given set of participants. Discussion simulation
will be a very useful tool for discussion planning -
determining the discussion goal, grouping the people,
building strategic facilitation scenarios.
5 RELATED WORKS
Several tools for on-line focus group
discussions have been introduced for
these years (Zoomerang Online Focus
http://info.zoomerang.com/prodserv/onlinefocus.htm,
GMI Focus Group Software https://www.gmi-
mr.com/net-mr/online-focus-groups.php, and e-
Focusgroups http://www.efocusgroups.co.uk/). For
example, MarketTools, Inc. has launched Zoomerang
Online Focus, which is a web-based solution that
helps marketers conduct focus group research on-
line. One of its selling points is that it provides
highly skilled and trained facilitators (, which they
call moderators). Our work aims to have profitable
on-line focus group discussions without depending
on facilitators’ skills.
Various methods have been proposed for finding
important terms from text (key phrases (Witten et al.,
1999), topic words (Lawrie et al., 2001)). Some
works have focused on finding key persons in text-
based communication (Kamimaeda et al., 2005; Re-
ich et al., 2002), and on exploring social networks
of network-based communication (Zhou et al., 2006).
These are very effective and high quality analyses,
which give us deep insight into each aspect. In or-
der to analyze in various aspects, they need to use
multiple analyses and compare them. This might be
time-consuming work for facilitators. Our goal is to
propose methods or tools which give us multi infor-
mative analysis on a single output.
ACKNOWLEDGEMENTS
We would like to thank to Hakuhodo Inc. for their
project collaboration. This work was sponsored by
the Air Force Office of Scientific Research, Air Force
Materiel Command, USAF (AF9550-06-1-0096 and
AF9550-06-1-0370).
REFERENCES
Imafuji Y., N., Llor`a, X., Goldberg, D. E., Y., W., and D., T.
(2007). Delineating topic and discussant transitions in
online collaborative environments. In Proceedings of
9th International Conference on Enterprise Informa-
tion Systems (ICEIS 2007).
Kamimaeda, N., Izumi, N., and Hasida, K. (2005). Dis-
covery of key persons in knowledge creation based on
semantic authoring. In KMAP 2005.
Lawrie, D., Croft, W. B., and Rosenberg, A. (2001). Finding
topic words for hierarchical summarization. In SIGIR
’01: the 24th ACM SIGIR conference on Research and
development in information retrieval, pages 349–357.
Reich, J. R., Brockhausen, P., Lau, T., and Reimer, U.
(2002). Ontology-based skills management: Goals,
opportunities and challenges. Universal Computer
Science, 8(5):506–515.
Witten, I. H., Paynter, G. W., Frank, E., Gutwin, C., and
Nevill-Manning, C. G. (1999). Kea: practical auto-
matic keyphrase extraction. In DL ’99: the fourth
ACM conference on Digital libraries, pages 254–255.
Zhou, D., Manavoglu, E., Li, J., Gies, C., and Zha,
H. (2006). Probabilistic models for discovering e-
communities. In Proceedings of the 15th international
conference on World Wide Web (WWW2006).
ICEIS 2008 - International Conference on Enterprise Information Systems
566
