
A NOVEL APPROACH FOR SIMULATING A
BIO-CONTAMINATION PROCESS
Gerard Chalhoub, Antonio Freitas and Michel Misson
LIMOS-CNRS, Network and Protocols Team, Blaise Pascal University
B.P. 86, 63172 AUBIERE CEDEX, France
Keywords: Simulation, CSMA/CA, bio-contamination, Ad-hoc, WLAN.
Abstract: The phenomenon of bio-contamination in a population of individuals being contaminated in a near by near
physical, viral or bacterial contact could be compared by analogy with a near by near exchange of "atomic"
data between mobile entities of an ad hoc network. Would the tools of wireless communication engineering
then make it possible to contribute in the modeling of a bio-contamination process? Does the use of
CSMA/CA in order to share the “contamination medium” make it possible to simulate this process of
contagion? To establish the limits of the analogy, we consider the most unfavorable case, the systematic
contamination of proximity. A susceptible mobile becomes contaminated if it passes near a contaminant
mobile at a distance lower than the contamination distance. Simulations under NS2 highlight the effect of
the overall radiation compared to the power used for emitting the atomic data representing the virus and
reveal an optimal frequency of atomic data diffusion in the case of a population with strong geographical
density moving in confined environment.
1 INTRODUCTION
The symbolic system and the vocabulary used in
part(a) of figure 1 give the impression that it is an
ad-hoc wireless communication system between
entities moving according to a certain trajectory and
a given speed. A mobile emits or receives
information by means of an antenna characterized
by the range of an electromagnetic radiation. This
exchange of data takes place only if the receiver is
within range from the transmitter, more precisely the
distance traveled by the signal, is lower than a given
threshold.
Let us suppose now that this range does not
concern the distance at which the mobiles can
exchange information but the distance of a
contamination by air following a cough, a sneeze, or
simply breathing, between individuals during an
ordinary day. Part (b) of figure 1 shows that the
entity A (the contaminant) contaminates the entities
B then C which become in their turn contaminators.
The question put here is the following one: can
the engineering of the wireless networking be usable
to include (represent) a process of bio-
contamination? More precisely, prototyping using
light wireless communicating equipments, or
simulating using simulators developed for the
wireless communications like OPNET and NS2, can
be of a certain utility to model a process of
contagion?
The most important criteria that affect a
contagion process identified by (Shane C. St. John,
1997) were:
- The probability of infection.
- The probability of recovery.
- The number of encounters between
individuals which depends on: the density of
the population and the dynamic degree of
that population.
- The initial number of infected individuals.
Each one of these parameters can be associated
with a step of the modulation process using
simulation tools like OPNET and NS2 (G.
Chalhoub, A. Freitas & M. Misson, 2007). Let us
consider the probability of infection: a susceptible
individual touched by a contaminant is considered
infected with a probability of infection P. In the
123
Chalhoub G., Freitas A. and Misson M. (2008).
A NOVEL APPROACH FOR SIMULATING A BIO-CONTAMINATION PROCESS.
In Proceedings of the First International Conference on Biomedical Electronics and Devices, pages 123-129
DOI: 10.5220/0001049901230129
Copyright
c
SciTePress
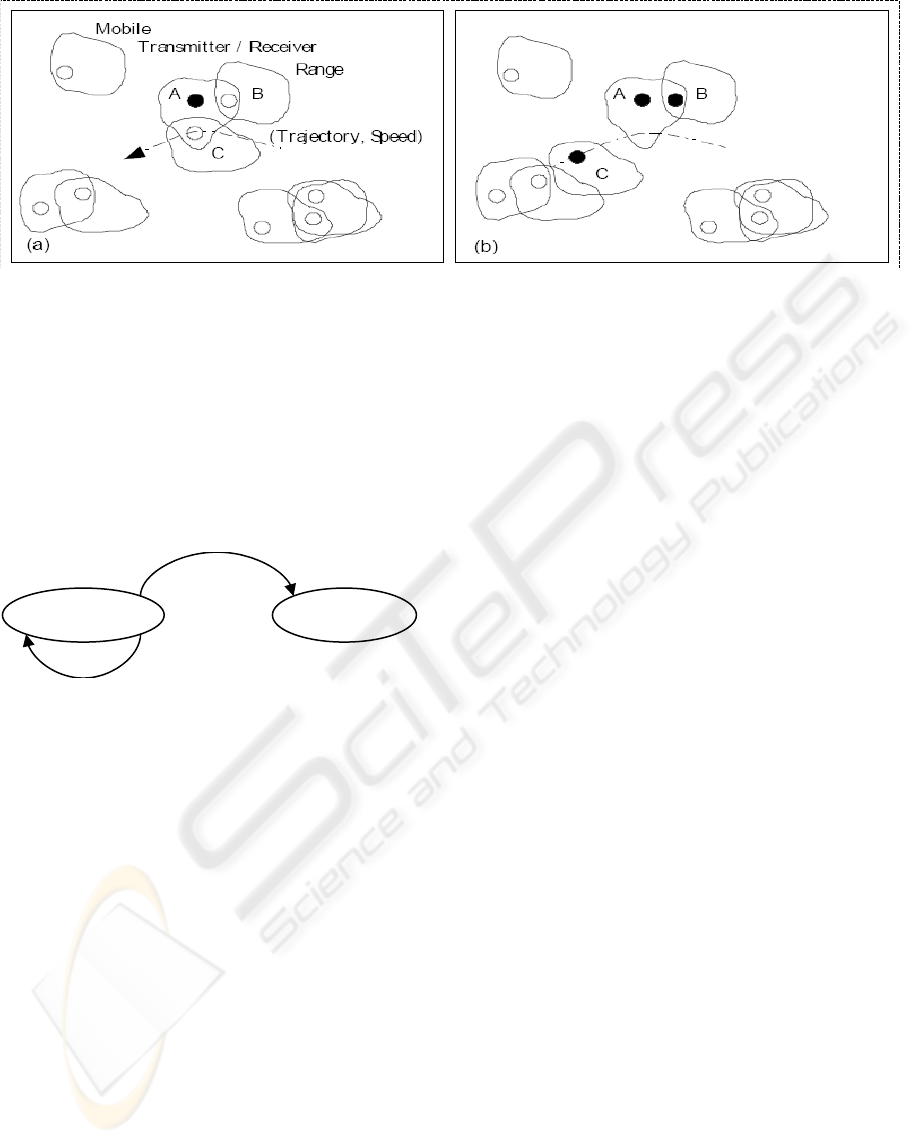
Figure 1: Wireless Communications / Bio-contamination process.
context of a network modulation process, the
transition from susceptible to infected will not take
place unless the susceptible individual receives a
contaminant message with a certain probability of
success (figure 2). In this article we are considering
a systematic contamination (P=1).
Figure 2: Susceptible becomes infected.
2 ASSUMPTIONS
If we consider the cough or the sneeze as means of
contamination by air between individuals, the
analogy with a wireless networking will result in the
diffusion on the radio medium of a frame containing
atomic data. Nevertheless, we make the assumption
in this article that the contamination is regarded as
succeeded, if this information is received with no
errors by one or more other entities.
For an individual the support of viral
transmission, the air, is always available. A cough or
a sneeze of an individual can be contaminant even if
other individuals have an activity which coincides in
time at the same place. In that sense the activities of
contamination are rather cumulative. Here we see a
limit with our analogy arising. In a WLAN several
simultaneous emissions cause a superposition of
signals, a collision, which makes impossible the
deciphering of information (with the exception of
the capture effect). In this case, the contention-based
access methods implement an arbitration which will
try to order the access to the medium. Data to be
transmitted will then undergo a random delay. The
access method CSMA/CA is today the most
“popular” method in the field of the WLAN
(ANSI/IEEE Std 802.11, 1999),
(IEEE Std
802.15.4™-2003)…, and will be detailed in part 3 of
this article.
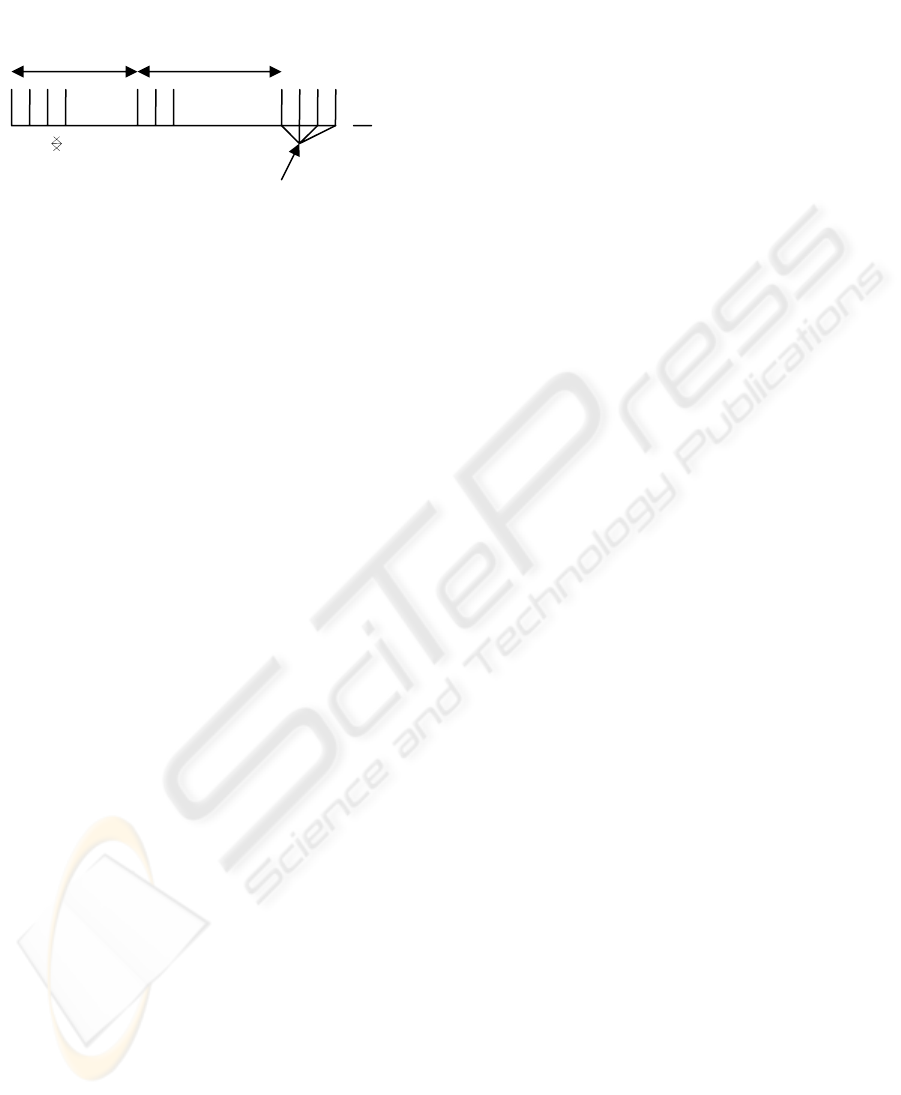
In the case of a contamination caused by
coughing or sneezing, the recurrence of the events is
about a few seconds. This recurrence is not really
periodic but, nevertheless, we can consider it as a
"Burst" activity like it is illustrated in figure 3.
Although T
1
and T
2
are not periodic, the time t
separating 2 messages in a "Burst" transmission can
be considered as a pseudo periodic activity.
While transposing this activity in a wireless
networking domain with the CSMA/CA method, the
density of traffic representing the information of
contamination will be easily assured by the MAC
layer (G. Chalhoub, A. Freitas & M. Misson, 2007).
This approach differs from the stochastic model
based on the cellular automata used by (H.
Situngkir, 2004).
This leads us now to consider a contamination
only due to proximity. Any susceptible individual
who is near a contaminated person, at a distance
lower than the distance of contamination, becomes
contaminant himself. We will call this model of
contamination by proximity, the geometrical model.
In the context of wireless networking, the
contaminated entity must broadcast atomic
information of contamination. Our objective is thus
to answer the following question: compared to the
geometrical model, which is the optimal frequency
of broadcasting the contamination data, with
CSMA/CA as the access method, in a context of
Susceptible Infected
Contaminant
message and (1-P)
Contaminant
message and P
BIODEVICES 2008 - International Conference on Biomedical Electronics and Devices
124
strong density of individuals and a contamination by
proximity?
Figure 3: Burst activity.
3 CSMA/CA AND THE SHARED
MEDIUM
The basic principle of CSMA consists in listening to
the medium before emitting when a station has a
pending (ready to be emitted) frame (Chen, 1994).
On the discharge of the medium the station applies a
method to manage the possible competition with
other stations. In the case of the CA (Collision
Avoidance) method the stations draw a back-off
period to desynchronize the potential candidates.
The detection of an activity on the network is
carried out by the measurement of the power of the
received electromagnetic radiation. If this
measurement is higher than the fixed threshold for
the noise, the medium is regarded as being busy.
In the case of WiFi, the contention resolution
mechanism is governed by the 802.11 standard
specifications
(ANSI/IEEE Std 802.11, 1999). For
the DCF (Distributed Coordination Function) mode
a station having a pending frame may begin to
access only when the radio channel is sensed Idle.
That is the case when the PHY layer performs a
“Clear Channel Assessment (CCA)” which returns
“IDLE” as the value of the CCA Indicator. This is
the case when the energy level received is lower
than a threshold very often estimated at - 95 dBm
(value given by the suppliers of WiFi interface). It is
this value which is passed in parameter (CSThresh:
Carrier Sense Threshold) for a simulation by NS2
(Wu Xiuchao, n.d.) and which creates a little
polemic for a simulation by OPNET
(S. Roy, H. Ma,
R. Vijayakumar & J. Zhu, 2006). Let us consider a
signal received with a power Pr higher than the
Carrier Sense Threshold, it allows to identify the
fact that the channel is indeed busy but it is not a
sufficient condition so that the information
transported by the signal can be suitably interpreted.
For that it is necessary that the receiver has a Margin
of Decoding (MD) which depends on the
modulation used for the transmission (Intersil Data
Sheet HFA3861B, 2001). For example, it is admitted
that in the case of a WiFi network the decoding of a
frame with 11 Mbps requires that the energy of the
signal received be higher than - 82 dBm. It is the
value which is passed via the RXThresh parameter
in a NS2 simulation. This obviously implies that the
area in which the signal is perceived as higher than -
95 dBm is much larger than the zone of reception. If
we illustrate that by a mechanism of contamination
by cough simulated using an access method of the
type CSMA/CA, a person who coughs prevents from
coughing people whom it does not reach!
This is illustrated in the parts (a) and (b) of
figure 4. The most external disc represents the
surface in which the CCA indicator has the value
BUSY, the disc delimited by -82 dBm corresponds
to the surface in which the reception is done with an
acceptable error rate.
Regardless of the nature of the medium, at a
short distance from the transmitter, it is standard to
consider that the law of dispersion of energy is in
1/D².
If we know the transmission power, it will
possible then to deduce the received power at the
security (or contamination) distance which we
introduced. Thus for a transmission power of 20
dBm the power hoped at 2 meters is - 26 dBm. It is
what corresponds to the smallest disc of part (b) of
figure 4.
In the same way by adjusting the power of
transmission to -36 dBm, the threshold of reception
of -82 dBm corresponds to the distance of
contamination. This is represented by the part (c) of
figure 4.
At this stage we can discuss the effect of the
Clear Channel Assessment (CCA). A transmission
with 11 Mbps and a power of - 36 dBm has an
impact which goes well beyond a disc of 2 meters
because of the CCA which covers a surface with a
power higher than - 95 dBm. By reducing the power
of emission we also reduced considerably the
surface of carrier sensing. Using NS2 we will
evaluate the effects of reducing the power of
transmission, on the simulation of the process of
contagion.
T
1
T
2
t
Burst emission of
contaminant messa
g
es
A NOVEL APPROACH FOR SIMULATING A BIO-CONTAMINATION PROCESS
125
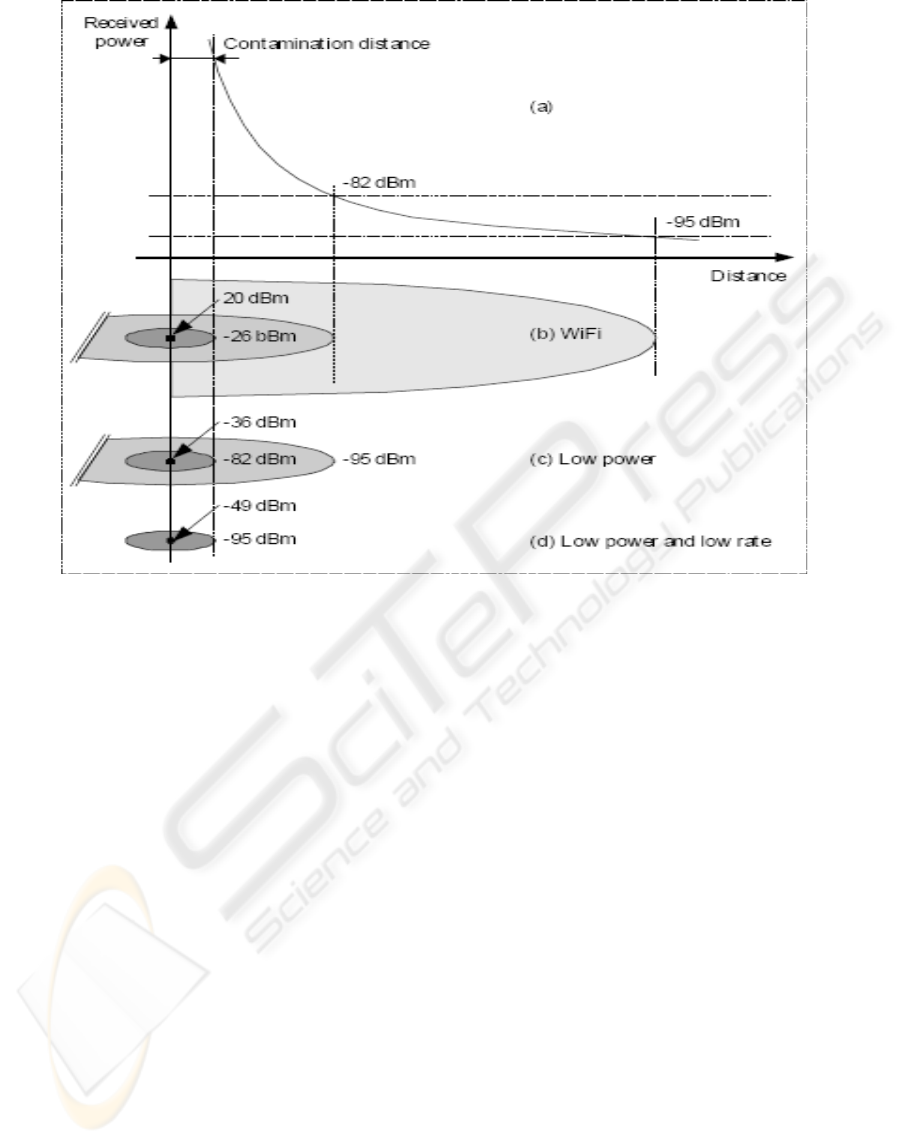
Figure 4: CSMA and thresholds.
4 SIMULATIONS
The object of this paper is to study if the choice of
the access method CSMA/CA exploited to broadcast
atomic information at a given frequency is an
acceptable way to model a process of contamination
by contact.
4.1 The Reference Taken for a
Contamination by Contact
In our approach of simulation we considered that the
ideal case was given by a geometrical approach of
the problem, i.e. at any moment (in fact every 10
ms) we calculate for each contaminated station the
distance which separates it from its neighbors. So if
for a neighbor of a contaminant, this distance is
lower than the threshold of contamination, this
neighbor becomes also contaminated.
The choice of the frequency of this calculation
depends on the velocity of the mobiles: the latter
being at a maximum of 2 m/s this gives us a
maximum error of 4 cm on the calculation of the
distance between mobile if calculation is made every
10 ms. By this geometric calculation we obtain a
number of mobiles contaminated throughout the
simulation time that we will indicate thereafter like
the result of the geometrical model. This result will
represent an asymptote for those which are obtained
by any other way.
4.2 The Simulation Assumptions
In this paper we chose to illustrate the results of a
contamination modeled by CSMA/CA and to
compare them with the results of the geometrical
model for two configurations of mobiles which
correspond to the same initial rate of contamination.
- The First simulation: 100 mobiles in a surface of
20 X 20m² with only one mobile contaminated at the
beginning of simulation
- The Second simulation: 400 mobiles in a surface of
40 X 20m² with 4 mobiles initially contaminated.
In these two cases two frequencies of
broadcasting (2 and 10 Hz) and two powers of
transmission (20 and - 36dBm) are studied.
All simulations were made for 20 scenarios of
nodes distribution and the curves displayed later on
represent the averages of the number of nodes
contaminated during these 20 simulations. Each
simulation represents an evolution of the contagion
BIODEVICES 2008 - International Conference on Biomedical Electronics and Devices
126
during 20 s, the number of contaminated mobiles is
calculated every 0,2 s. All nodes are randomly
moving within the simulated area with a maximum
speed of 2 m/s.
4.3 Analysis of the Effects of the
Transmission Power
In the case of the first simulation one can note that
the power of transmission does not have much
influence because the curves obtained for 20 dBm
and - 36 dBm are very close (Figure 5). The
frequency of broadcasting at 10 Hz makes it possible
to approach the geometrical model much more
clearly.
While multiplying by 2 the geographical density
of the nodes and by considering the same density of
contaminant (4 nodes initially contaminated), a
diffusion made with a limited power gives results
that approach more the geometrical model than
those done using the usual power of Wifi.
The simulation results:
With our assumptions everything takes place
during the first seconds of simulation. Figure 6
shows clearly how reducing the transmission power
improves the propagation by reducing the effect of
CSMA/CA on the delay of the diffusion in an area
with a dense population.
4.4 Examining the Effects of the
Frequency of Diffusion in Low
Power Transmission
Another factor which has also a big part in
determining the effect of CSMA/CA is the
frequency of diffusion. Our goal is to approach the
geometric model which gives us a representation of
an almost continuous contagion. Hence, one can
think of increasing the frequency of the broadcasting
of the contamination frames, that means increasing
the offered load on the network and reaching the
limits of the effectiveness of such an access method
(Chen, 1994). We can thus suppose that there exists,
for a given density of mobile stations, an optimum
frequency of transmission, and that's what we will
try to find by simulation.
Figure 5: Low density contamination.
0
20
40
60
80
100
120
0 0.2 0.4 0.6 0.8 1 1.2 1.4 1.6 1.8 2 2.2 2.4 2.6 2.8 3 3.2 3.4 3.6 3.8 4
time
number of nodes
2m0.1 wifi0.1 2m0.5 wifi0.5 geo
A NOVEL APPROACH FOR SIMULATING A BIO-CONTAMINATION PROCESS
127
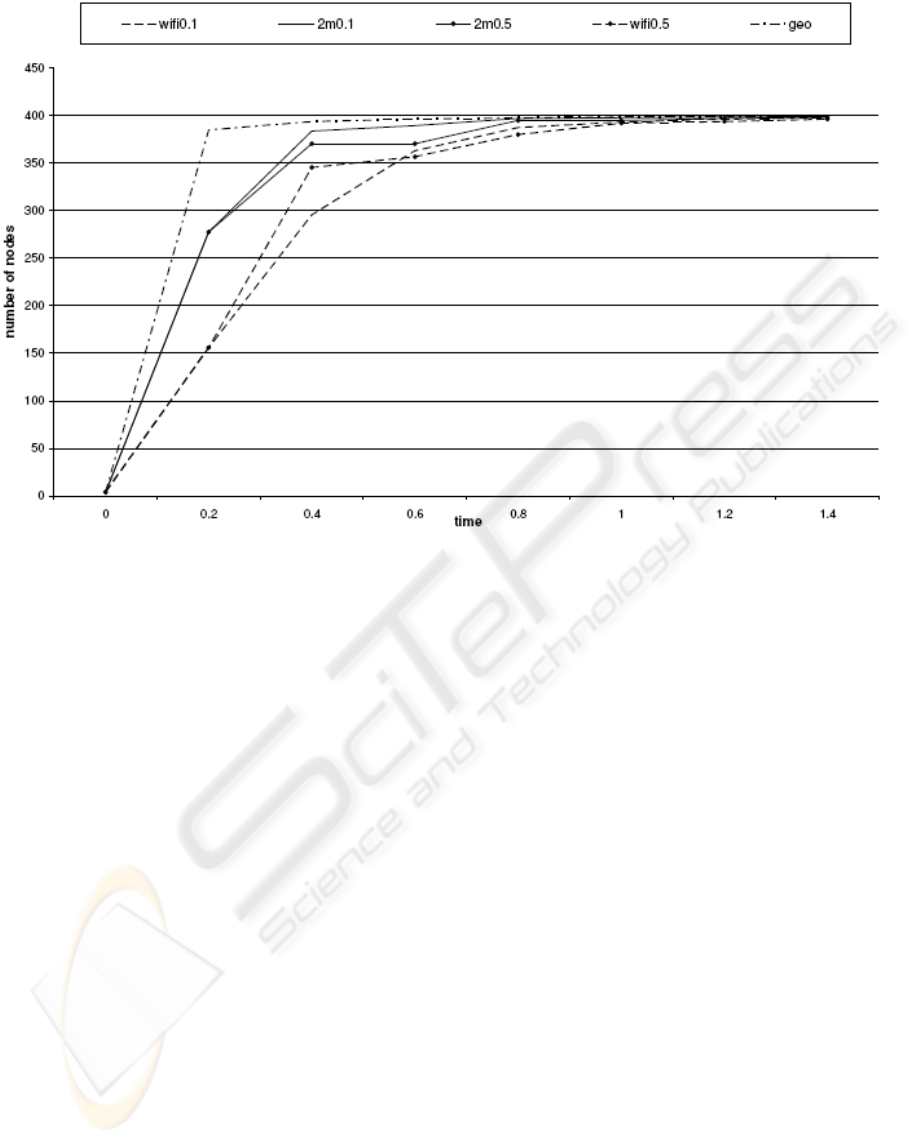
Figure 6: High density contamination.
We tested several frequencies using the previous
model by using a low power transmission (- 36
dBm). For frequencies of broadcasting going from
0.5 to 200 Hz, we will consider the average of 20
simulations, to calculate the number of contaminated
nodes. Each simulation lasts 20 seconds and gives a
value every 0,2 second, we will thus have 100
values per frequency. These 100 values will be
compared with those corresponding to the same
moment, given by the geometrical model to identify
a difference: "an error" between the theoretical
contamination given by the geometrical model and
that approached by CSMA/CA.
Let M be the average of these 100 differences
between the two corresponding values for each
frequency of transmission, we thus obtain the
following curve (Figure 7):
We can notice that with a frequency of diffusion
between 10 and 20 Hz the average number of
contaminated nodes is 0.5 node less when compared
to the ideal number given by the geometric model.
We can clearly identify 3 different zones illustrated
by that curve. In the first zone we are under-loading
the network using frequencies between 0.5 and 4 Hz
for emitting contaminant messages and not being
able to produce the same result given by the
geometric model, which is easily explained by the
fact that we are missing some encounters due to the
mobility of the individuals that cross into each other
without being able to exchange contaminant
messages. By increasing the frequency beyond 20
Hz we are overloading the network and the effect of
CSMA/CA causes a delay on the transmitted
messages which prohibit some individuals to emit
and therefore miss some encounters. We determined
effectively an optimal frequency of diffusing
contaminated messages in a continuous way which,
for our assumptions of simulation, varies between 10
and 20 Hz.
5 CONCLUSION AND
PERSPECTIVES
CSMA/CA and simulators for the wireless networks
are original assets to simulate processes like a
contamination by contact. We have just shown that
by adjusting the transmission power and the
frequency of the access to the medium, it is possible
to simulate with a simulator like NS2 the way in
which a virus is propagated in a mobile human being
community.
BIODEVICES 2008 - International Conference on Biomedical Electronics and Devices
128
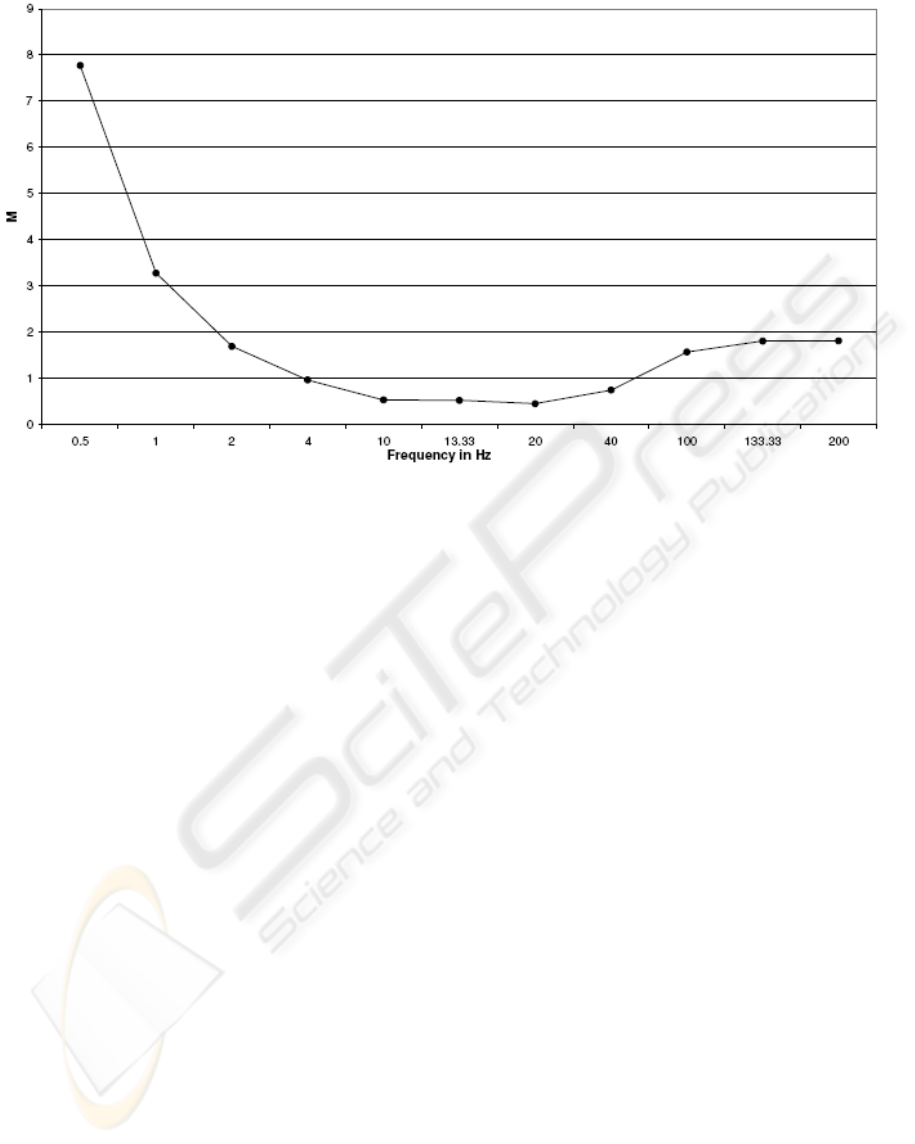
Figure 7: Frequency effect.
To approach more the real nature of a
contamination by proximity, the action of the
contaminant radiation of a node must be limited to
the distance of contamination. It would be
interesting to study next the effect of the bandwidth
which finishes the surfaces dilemma between the
zone of carrier sensing and that of a good reception.
In the case of a 1 Mbps transmission these two
surfaces are overlapping which brings us even closer
to the geometrical model (part (d) of figure 4).
Following a meeting, that took place June 2007,
with a group of doctors who were interested in our
work, we will improve our simulation model by
defining individual profiles which define the
personal biological characteristic of each individual
(degree of vulnerability, being immunized or not,
and time needed to be recovered…), and by
applying the "burst" activity to emit the contaminant
messages instead of the continuous emission.
Having a virus profile with all its characteristics will
also help us build a specific transmission behavior
that will reproduce the virus' nature.
REFERENCES
ANSI/IEEE Std 802.11, 1999 Edition (R2003)
G. Chalhoub, A. Freitas & M. Misson, 2007. Using
Wireless Networking Simulation Tools and Technics to
model a bio-contamination process –First Approach-
Unpublished internal report of the N&P Team
LIMOS.
Hokky Situngkir, 2004. Epidemiology Through Cellular
Automata .WPF2004 Bandung Fu Institute.
IEEE Std 802.15.4™-2003.
Intersil Data Sheet HFA3861B 2001. Direct Sequence
Spread Spectrum Baseband Processor.
Kwang-Cheng Chen, 1994. Medium Access Control of
Wireless LANs for Mobile Computing.
S. Roy, H. Ma & R. Vijayakumar, J. Zhu, 2006.
Optimizing 802.11 Wireless Mesh Network
Performance Using Physical Carrier Sensing.
University of Washington Electrical Engineering
Technical Report.
Shane C. St. John, 1997. Population Dynamics in spatially
explicit lattice epidemic models. AAT 1385006.
Wu Xiuchao, n.d.. Simulate 802.11b Channel within NS2.
A NOVEL APPROACH FOR SIMULATING A BIO-CONTAMINATION PROCESS
129
