
A Contribution to Ancient Cadastral Maps
Interpretation through Colour Analysis
Romain Raveaux, Jean-Christophe Burie and Jean-Marc Ogier
L3I Laboratory – University of La Rochelle, France
Abstract. In this paper, a colour graphic document analysis is proposed with an
application to ancient cadastral maps. The approach relies on the idea that im-
ages of document are fairly different than usual images, such as natural scenes
or paintings… From this statement, we present an architecture for colour
document understanding. It is based on two paradigms. Firstly, a dedicated col-
our representation named adapted colour space which aims to learn the docu-
ment specificity and secondly a document oriented segmentation using a region
growing algorithm supervised by a hierarchical strategy. Experiments are per-
formed to judge the whole process and the first results show a good behaviour
in term of information retrieval.
1 Introduction
The extraordinary potential of the automatic analysis of colour documents brings new
interests and represents a real challenge since colour has always been considered as a
strong tool for information extraction [1]. In the context of a project called
“ALPAGE” supported by the French National Research Agency (ANR)[14], we are
considering the digitalization of ancient maps. In this ALPAGE project, we consider
cadastral maps from the 19th Century (called “Atlas VASSEROT”), on which objects
are drawn by using colour to distinguish parcels for instance. This project deals with
the classical graphic recognition problems, to which are added difficulties due to the
presence of colours and strong time due degradations of relevant information : colour
degradation, yellowing of the paper, pigment fading… In the context of this pluridis-
ciplinary project, the idea is to provide strategic information for historians, or stu-
dents, what means that the purpose is to propose a set of processing allowing to seg-
ment/recognize all the objects of the documents. In such a topic, the number of han-
dled objects can be counted by million. This volume of data leads to the rise of new
services as intelligent indexation, document browsing and content searching. These
subjects lead us to the implementation of mutualized working tools for both ICT-HSS
communities(Information/Communication Technologies – Human/Social Sciences),
allowing to develop research relating to urban space, namely, PRAI software (Pattern
Recognition and Adapted Intelligence) adapted to ancient cadastral maps, and a GIS
(Geographical Information System) including cadastral and historical layers.
Raveaux R., Burie J. and Ogier J. (2007).
A Contribution to Ancient Cadastral Maps Interpretation through Colour Analysis.
In Proceedings of the 7th International Workshop on Pattern Recognition in Information Systems, pages 89-98
DOI: 10.5220/0002427500890098
Copyright
c
SciTePress
It is a new approach to the urban environment, truly integrating the spatial dimension,
which could be implemented thanks to the contributions of recent disciplines such as
computer vision, geomatic and archeogeography. If the analysis of a given document
were reduced in the digitalization of the paper document to a “bitmap” image, the
problem would be commonplace. Actually the subjacent scientific problems are very
complex because the objective is much more ambitious, the conversion of the paper
document into its semantic interpretation [2]. The concept of retro-conversion is a
semantic digitalization, from elementary data and contextual information the analysis
is carried out through a colour graphic recognition process where the aim is to build
structured information dedicated to a GIS. A classical ascending approach from pixel
to object calls various low level tools such as colour segmentation or line tracking
while at the top, high level methods allow the integration of a priori knowledge bring-
ing a contribution to the interpretation process with an aim of archiving information
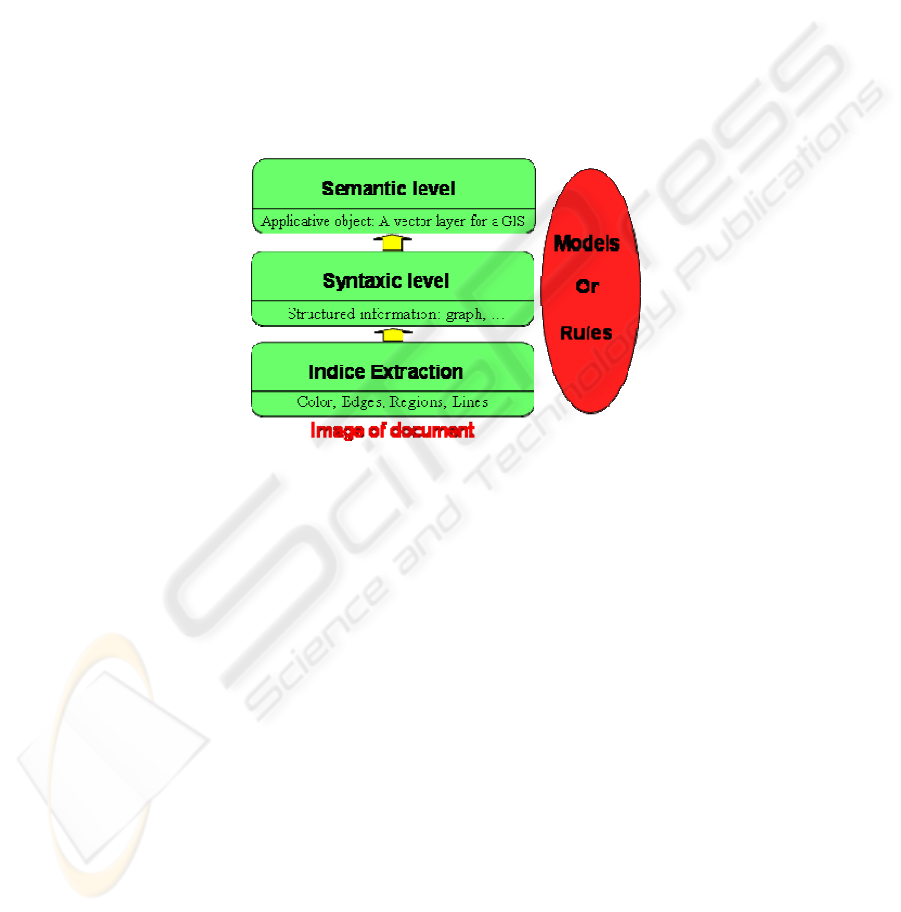
[fig 1] [3].
Fig. 1. Architecture of a graphic document analysis system.
Since we need to consider the colour meaning to extract cadastral information (ie: a
parcel), we have to take care about the colour representation. Consequently, in this
paper, we propose a general architecture to take into account colour information from
graphic documents. Our method relies on three steps: firstly, finding the best colour
model in terms of distinction between different colours. We assume that the choice of
an efficient colour model will be decisive since the performance of any colour-
dependent system is highly influenced by the colour model it uses. Secondly, a colour
segmentation approach dedicated to documents is presented; it is inspired by graphic
construction rules of cadastral maps. And finally, a vectorisation step [11] provides
cadastral objects to be inserted into the GIS.
The paper is organized as follows: In the second section, the question of finding
the best colour space is introduced. Then, the third section presents the colour seg-
mentation working on documents, and particularly the specific operators involved.
The fourth section presents the application to ancient cadastral maps, a comparative
study of colour segmentation methods is given. Finally, a conclusion is given and
future works are brought in section 5.
90
2 Colour Space
In the last ten years, colour analysis has known a considerable progress, due to the
number of acquisition devices which provide colour information, in most of the cases.
In the context of our project, as said in the introduction, the difficulty is to explore
techniques issuing from the rich literature, and to try to adapt it to our very specific
context of degraded colours.
2.1 Forewords: About Pre-processing
In introduction, we express the difficulties to analyse ancient documents which were
deprecated due to the time, usage condition or storage environment. So clearly, a real
need for image restoration has come up. Two pre-processing, the white patch and the
faded colour correction have been executed to bring colours back to original or at
least to unleashed colour significance. A good survey of them can be found in
[15][16].
2.2 Standard Colour Space
Most of acquisition devices, such as digital cameras or scanners, process signals in
the RGB format. This is why RGB space is widely used in the applications of image
processing. The R primary in RGB corresponds to the amount of the physical re-
flected light in the red band. However, RGB representation has several drawbacks
that decrease the performance of the systems which depend on it. RGB space is not
uniform; the relative distances between colours do not reflect the perceptual differ-
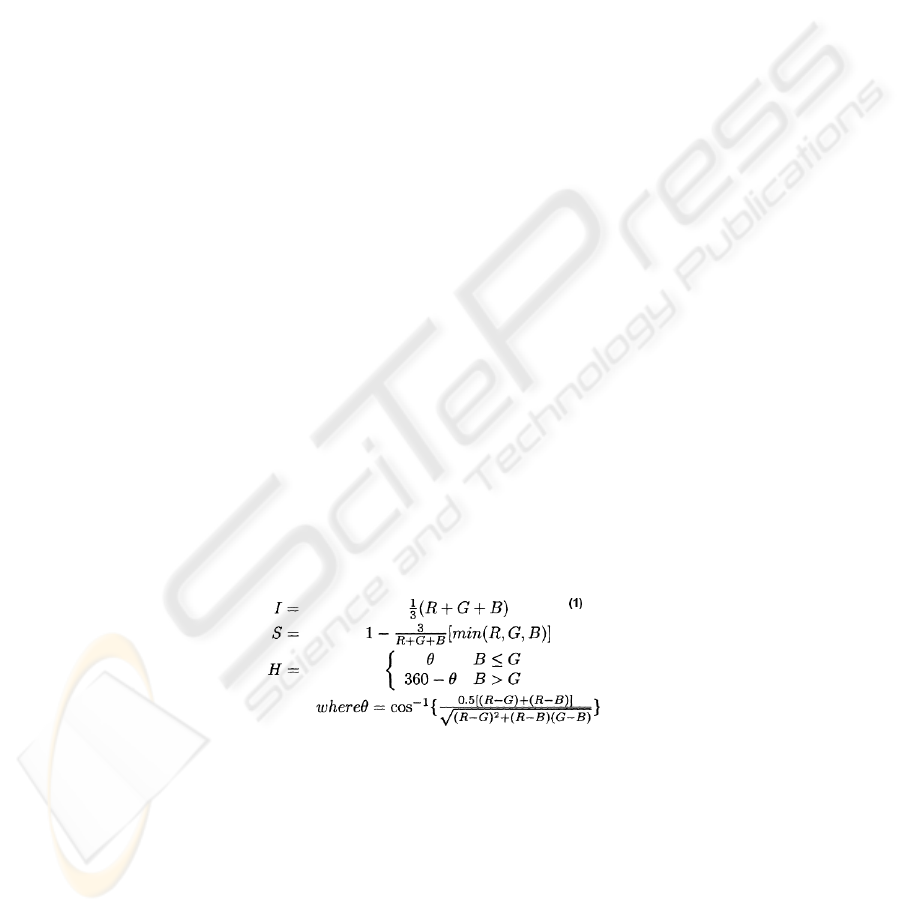
ences. Therefore, HSI space has been developed as a closer representation to the
human perception system, which can easily interpret the primaries of this space. In
HSI space, the dominant wavelength of colour is represented by the hue component.
The purity of colour is represented by the saturation component. Finally, the darkness
or the lightness of colour is determined by the intensity component. Eq.(1) shows the
transformation between RGB and HSI spaces [5].
Although the HSI space is suitable for lots of applications based on colour images
analysis, this colour space presents some problems. For example, there are non-
avoidable singularities in the transformation from RGB to HSI, as shown in Eq.(1).
The XYZ colour space developed by the International Commission on Illumination
(CIE) in 1931 [9] is based on direct measurements of the human eye, and serves as
the basis from which many other colour spaces are defined. The YUV colour is used
in the PAL system of colour encoding in analogical video, which is part of television
91
standards. The YUV model defines a colour space in terms of one luminance and two
chrominance components. Another alternative of YUV is the YIQ which is used in
the NTSC TV standard. On the other hand, Ohta, Kanade, and Sakai [10] have se-
lected a set of "effective" colour features after analyzing 100 different colour features
which have been used in segmenting eight kinds of colour images. Those selected
colour features are usually names as I1I2I3 colour model. XYZ, YUV and I1I2I3 are
non-uniform colour spaces; therefore CIE has recommended CIE-Lab and CIE-Luv
as uniform colour spaces, as they are non-linear transformation of RGB space [8].
2.3 Trained Colour Space
In [13], dominant features from different colour spaces are selected to construct "Hy-
brid Colour Space” (HCS). A principal component analysis is performed from the
covariance matrix composed with the total number of the candidate primaries. The 3
most significant axis are selected to reduce rate of correlation between colour compo-
nents. From this statement, two Genetic Algorithms (GAs) are introduced [4]. They
are handled in two different ways. The first one can be seen as a feature selection
algorithm to build a HCS while the second one is a learning process in order to dis-
cover coefficients/weights which will be used to compute a linear transformation of
RGB, such a model is called all along this paper as adapted colour space (ACS).
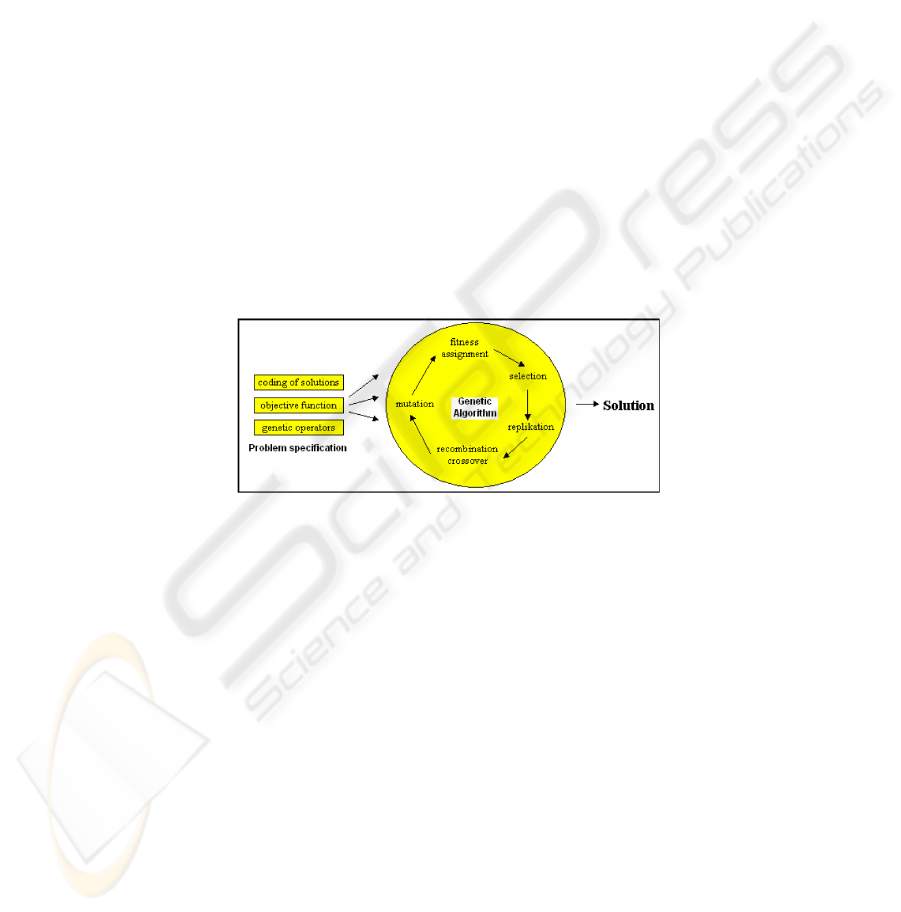
Fig. 2. Overview of a genetic algorithm.
2.4 Genetic Algorithm
Genetic algorithms are adaptive heuristic optimisation algorithms based on the evolu-
tionary ideas of natural selection and genetics. The basic concept of GAs is designed
to simulate natural processes, necessary for evolution of adapted systems. They repre-
sent an intelligent exploitation of a random search within a defined search space to
solve a problem. As can be seen on fig 2, after a random initialization of a population
of possible solutions, GA’s are based on a sequential ordering of four main operators:
selection, replication, crossover and mutation. In order to apply genetic algorithms to
a given problem, three main stages are necessary: the coding of the problem solu-
tions, the definition of the objective function which attributes a fitness to each indi-
vidual, and the definition of the genetic operators which promote the exchange of
genetic material between individuals.
92
2.5 Hybrid Colour Space Built by Genetic Algorithm
In HCS context, each individual has to encode a vector, where each component is an axis
of the HCS. We consider a set C of features.
{
}
N
i
CiC
1=
=
= {R,G,B, I1,I2,I3, L, u,v,…}
with Card(C) = 25.
Practically, it is almost impossible to test all possible combinations,
since they have a combinatory number equal to the factorial of the total number of the
candidate primaries, hence, GA are well suited to get a rid off absurd combination.
From now, the first step is to initialize the population, each individual is made up picking
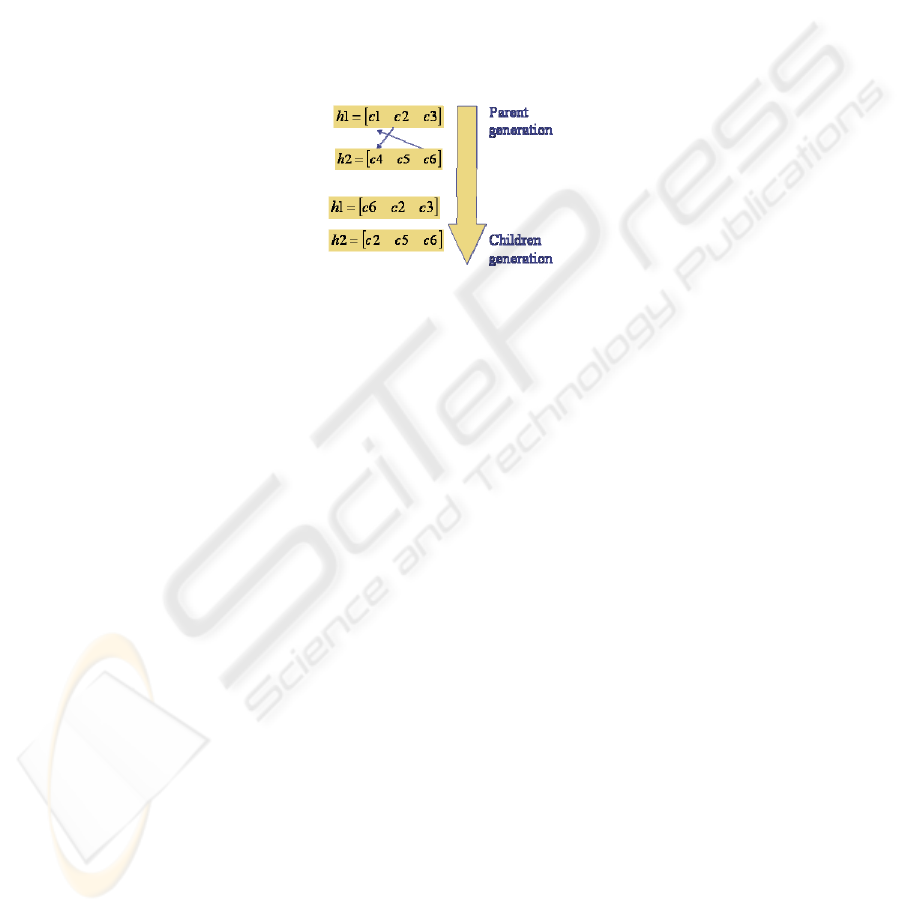
randomly three elements of C. Concerning cross over operator, two individuals h1 and h2
share their genetic material, swapping one of their component; fig 3. Finally, to perform
mutation on an individual, one component is selected and replaced at random by an ele-
ment of C.
Fig. 3. HCS: cross over operator.
2.6 Adapted Colour Space Calculated by Genetic Algorithm Learning
In ACS context, each individual W has to encode a
33
×
matrix, where each matrix
element is a coefficient used to compute a linear transformation of RGB. Each coeffi-
cient belongs to the interval [-1 ; 1] and the initialisation is made at random.
⎥
⎥
⎥
⎦
⎤
⎢
⎢
⎢
⎣
⎡
•=
⎥
⎥
⎥
⎦
⎤
⎢
⎢
⎢
⎣
⎡
B
G
R
W
Bs
Gs
Rs
Where W is defined as follow:
⎥
⎥
⎥
⎦
⎤
⎢
⎢
⎢
⎣
⎡
=
⎥
⎥
⎥
⎦
⎤
⎢
⎢
⎢
⎣
⎡
=
3
2
1
333231
232221
131211
e
e
e
aaa
aaa
aaa
W
And
3,2,1 eee are line vectors.
Concerning cross over concept, two individuals w1 and w2 promote their genetic material,
exchanging to each other one of their component; fig 4. To perform mutation on an indi-
vidual, one component is selected and replaced by a new line vector generated at random.
93
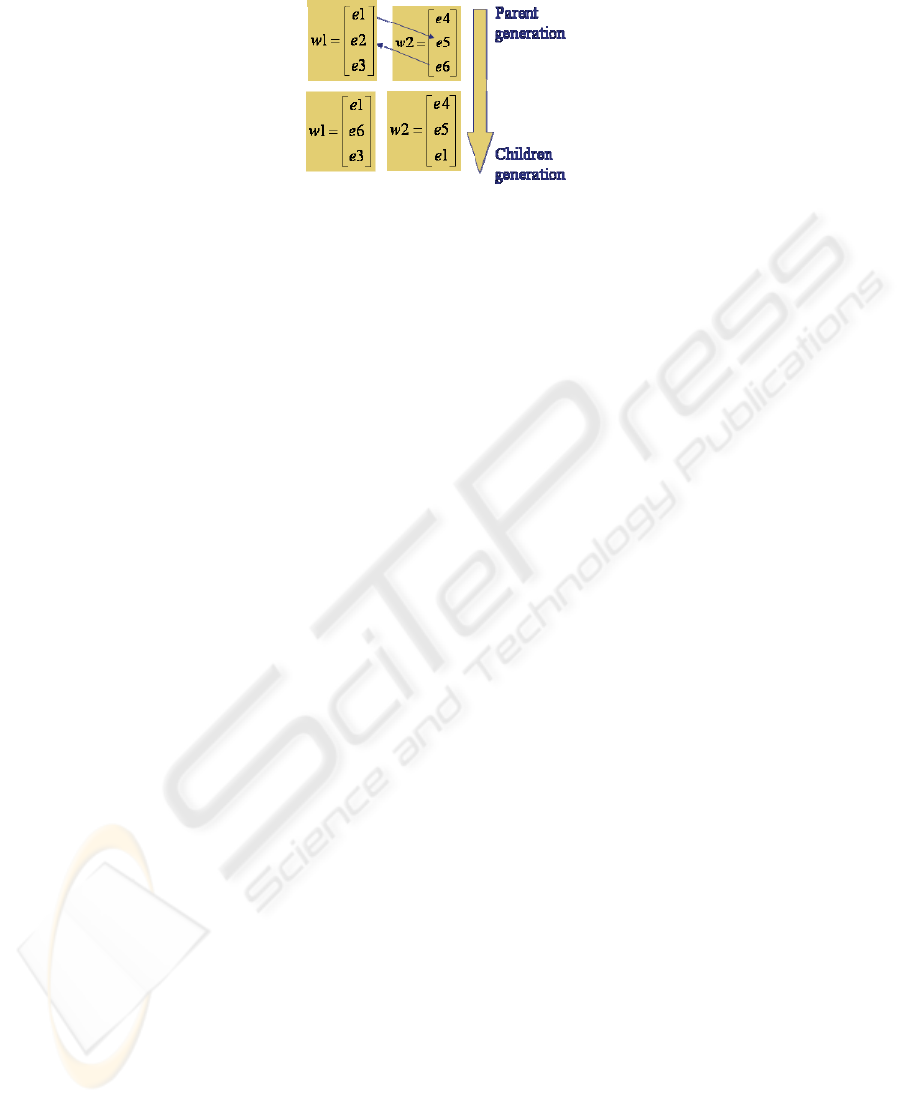
Fig. 4. ACS: Cross over operator.
2.7 Fitness
Both applications implement the same fitness to judge the well behaviour of a colour
space. We consider a colour space as well suited if it maximises a colour recognition
rate given by a supervised colour classification step.
3 Colour Segmentation
Colour segmentation has been a subject of research for about 40 years. Such an
amount of effort cannot be resumed in few lines. Consequently, we sum up the main
ideas by categorising colour segmentations into general families and then, we intro-
duce a hierarchical growing region method adapted to cadastral maps.
3.1 Main Colour Segmentation Families
Image segmentation methods can be categorised as follows:
- Histogram thresholding: assumes that images are composed of regions with differ-
ent color ranges, and separates it into a number of peaks, each corresponding to one
region.
- Edge-based approaches: use edge detection operators such as Di Zenzo[6] for ex-
ample. Resulting regions may not be connected, hence edges need to be joined.
- Region-based approaches: based on similarity of regional image data. Some of the
more widely used approaches in this category are: Thresholding, Clustering, Region
growing, Splitting and merging.
- Hybrid: consider both edges and regions.
3.2 Region Growing Segmentation Supervised by a Hierarchical Strategy
An initial set “A” of small areas are iteratively merged according to similarity con-
straints and according to a hierarchical order. Roughly, seeds are localized where the
color gradient is low and from the starting point, we start by choosing the seed pixel
with the lowest intensity and compare it with neighbouring pixels.
94
Then, region is grown from the seed pixel by adding in neighbouring pixels that are
similar, increasing the size of the region. When the growth of one region stops we
simply choose the next seed pixel which fulfill both constraints, does not yet belong
to any region and a low intensity level. This whole process is continued until all pix-
els belong to some region. Region growing methods[7] often give very good segmen-
tations since it is using both concepts color homogeneity and spatial aspect. The
choice of organizing the growing region according to the intensity of the pixel seeds
is motivated by the will of considering the document layout. Dark areas such as lines
or dark sections are meaningful and represent the frame of the graphic organisation.
And it is helpful in order to materialize the relations between lighter regions.
4 Application to Ancient Cadastral Maps
In this part, we present results on colour space analysis, and colour document seg-
mentation with an application to ancient cadastral maps.
4.1 Experiments on Colour Spaces
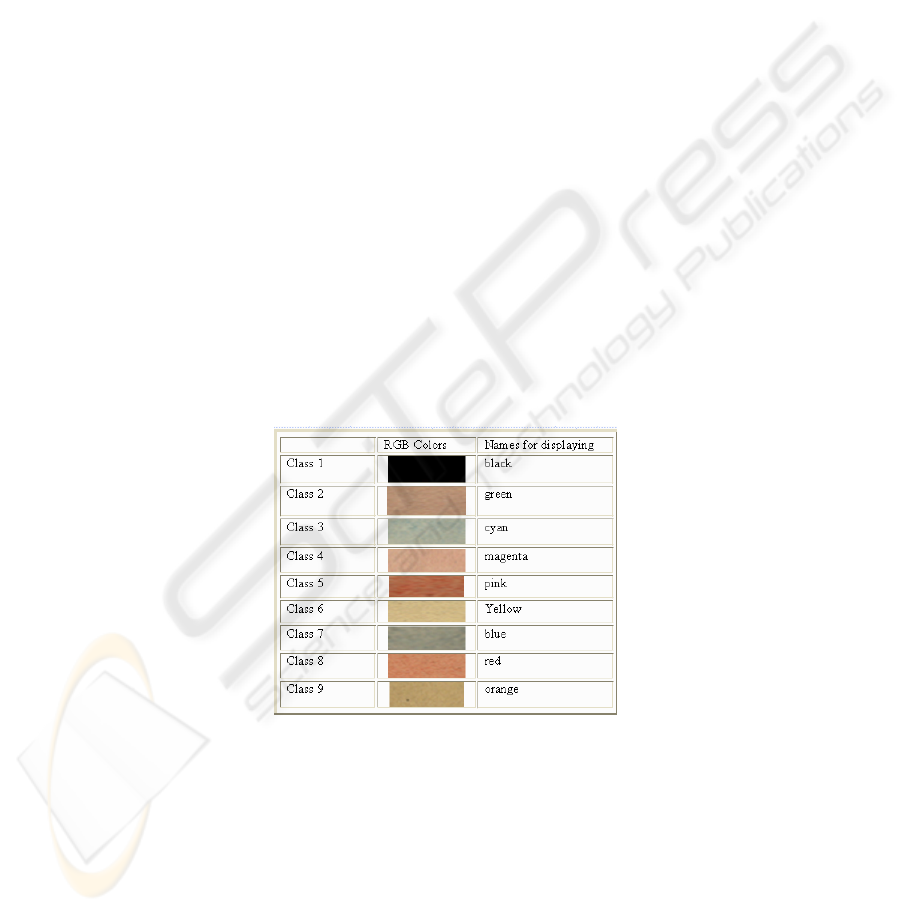
To evaluate the suitability of a colour space, we define a colour ground truth. We
work with two data bases. One is used for learning process dedicated to HCS and
ACS and the other one is applied in a validation context. In all colour spaces, we
perform a KNN classification based on a Euclidian metric to obtain the corresponding
colour recognition rates.
Fig. 5. Colour ground truth.
95
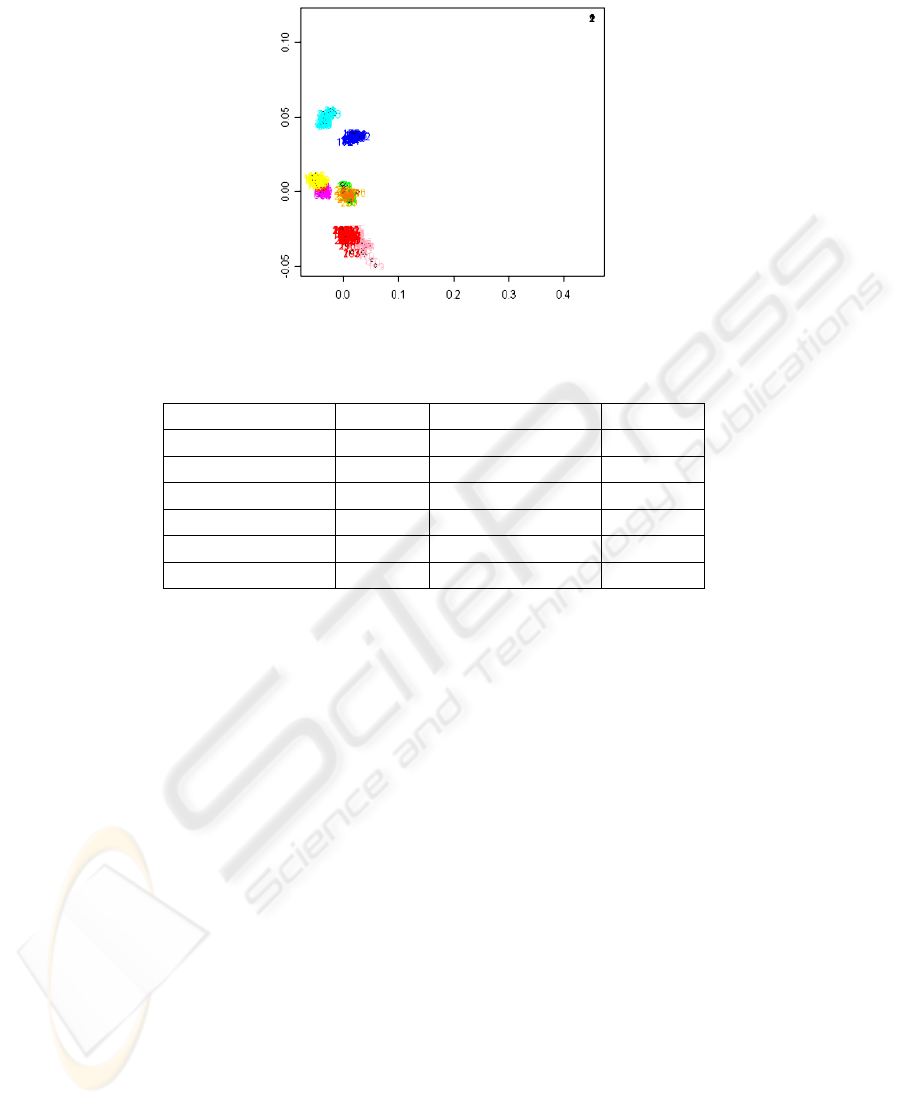
Fig. 6. Colour data: 2D projection using one form of non-metric multidimensional scaling[12].
Table 1. Colour recognition rate obtained by colour classification.
Color Space Rate Color Space Rate
RGB 0,7112 ISH 0,6149
I1I2I3 0,7112 La*b* 0,6417
XYZ 0,6737 Luv 0,6577
YIQ 0,7058 Adapted Space
0,7647
YUV 0,6791 PCA Space 0,7005
AC1C2 0,6684 HybridSpace
0,7326
In table 1, the good results of trained colour spaces HCS and ACS illustrate the need
of dedicated colour spaces when we deal with colour graphic documents.
We are brought to conclusion that colour images of documents are like no others, we
mean very specifics and far away from natural scene. Hence, we point out the need of
an adapted colour space.
4.2 Segmentation Results using Region Growing Algorithm Supervised by a
Hierarchical Scenario.
This experiment is carried out starting from the original RGB image [fig 7] to which
we apply the ACS transformation. From this point, the construction of region is per-
formed according to the scenario described in 3.2. At the end of this operation, we
return to RGB representation computing the transformation inverse of ACS (
1−
W
).
We obtain the segmented image [fig 8] where the found regions will be used to create
cadastral objects.
96
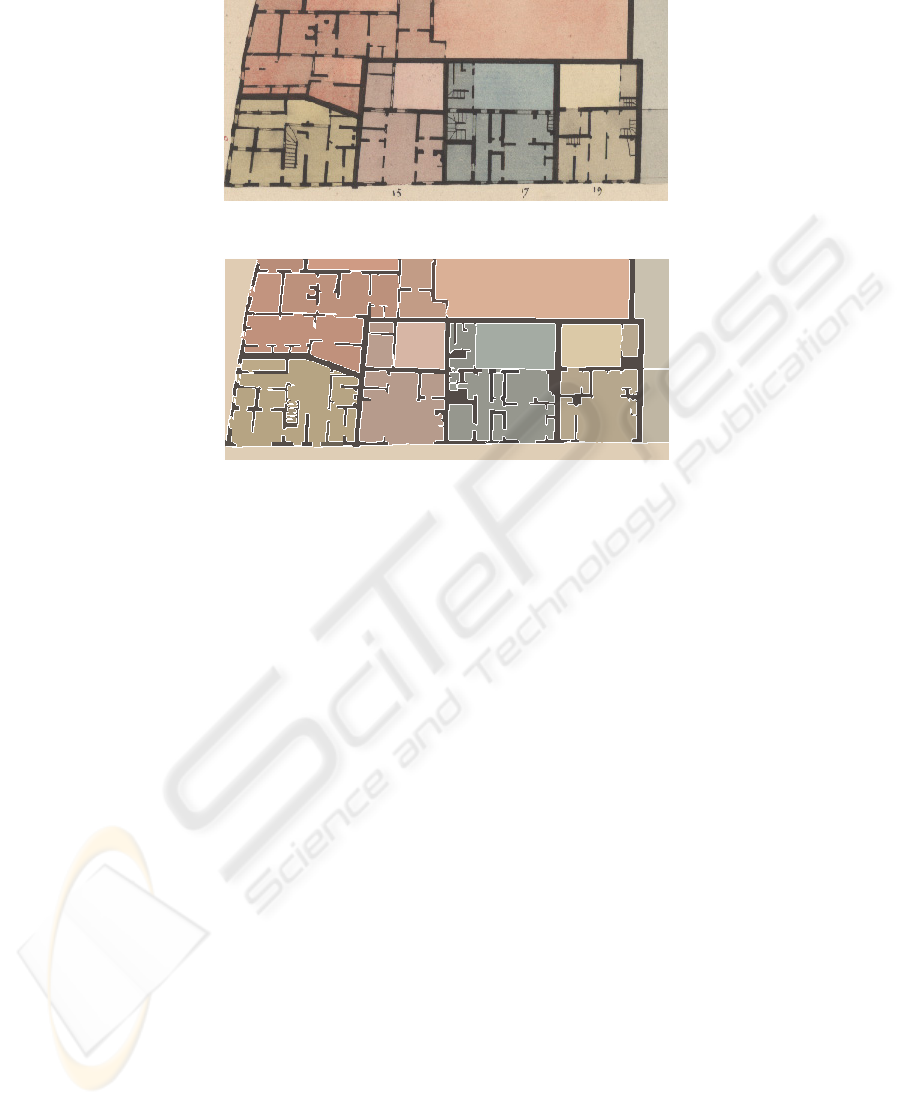
Fig. 7. A piece of cadastral map in RGB space.
Fig. 8. A segmented image by our approach.
5 Conclusion
In this paper, we have been interested in an original problem, the colour graphic
document analysis with an application to ancient cadastral maps. Our contribution
concerns a processing chain which is based on a trained colour space and hierarchical
growing region segmentation. Both tools are colour document oriented to consider
the graphic properties of documents. We are completely aware that works have to be
done to compare results to others approaches. However, preliminary results of our
starting project show a meaningful segmentation for interest regions on cadastral
maps. In addition, research perspectives are explored to combine/fusion black and
colour layers for reaching the interpretation result.
References
1. Dorin Comaniciu, Peter Meer, “Robust Analysis of Feature Spaces: Colour Image Segmen-
tation” Proceedings of IEEE Conference on Computer Vision and Pattern Recognition, San
Juan, Puerto Rico, June 1997, 750-755.
2. BELAID A., TOMBRE K. (1992) "Analyse de documents : de l'image à la sémantique",
Actes de CNED'92, Bigre No 80, pp. 3-29.
3. Lladós J., Kwon Y.B., « Graphics Recognition, Recent Advances and Perspectives »,
GREC, Barcelona, Spain, 2003.
97

4. J.D. Schaffer and J.J. Grefenstette, “Multiobjective learning via genetic algorithms”, In
Proceedings of the 9th international joint conference on adapted intelligence, Los Angeles,
California, pp 593-595, 1985.
5. J. M. Tenenbaum, T. D. Garvey, S.Weyl, and H. C.Wolf. An interactive facility for scene
analysis research. Technical Report 87, Adapted Intelligent Center, Stanford Research In-
stitute, Menlo Park, CA, 1974.
6. S. Di Zenzo, “A note on the gradient of a multi-image”, Computer Vision, Graphics, and
Image Processing, Vol 33, Issue 1, Janvier 1986.
7. « Adaptive image region-growing » Yian-Leng Chang Xiaobo Li, Dept. of Comput. Sci.,
Alberta Univ., Edmonton, Alta.; This paper appears in: Image Processing, IEEE Transac-
tions ; Publication Date: Nov 1994 ;Volume: 3, Issue: 6 On page(s): 868-872 ; ISSN:
1057-7149.
8. H. Palus. Colour spaces. In S.J. Sangwine and R.E.N. Home, editors, The Colour Image
Processing Handbook, pages 67-90. Chapman & Hall, Cambridge, Great Britain, 1998.
9. http://www.cie.co.at/cie/index.html.
10. Y. I. Ohta, T. Kanade, and T. Sakai. Colour information for region segmentation. Computer
Graphics and Image Processing, 13:222-241, 1980.
11. Locteau H., Raveaux R., Adam S « Approximation of Digital Curves Using a Multi-
Objective Genetic Algorithm »; Lecture Notes in Computer Science 3926, 2006.
12. T. F. Cox and M. A. A. Cox (1994, 2001) Multidimensional Scaling. Chapman & Hall.
13. J. D. Rugna, P. Colantoni, and N. Boukala, “Hybrid color spaces applied to image data-
base," vol. 5304, pp. 254{264, Electronic Imaging, SPIE, 2004.
14. http://www.agence-nationale-recherche.fr/
15. G. Buchsbaum, « A spatial processor model for object color perception », journal of the
Franklin institute, 310(1), pp. 1-26, 1980.
16. M. Chambah, B. Besserer, P. Courtellemont, « Recent progress in automatic digital restora-
tion of color motion pictures », SPIE Electronic Imaging 2002, San Jose, CA, USA, janvier
2002, vol. 4663, pp. 98-109.
98
