
GEOMETRIC AND INFORMATION CONSTRAINTS FOR
AUTOMATIC LANDMARK SELECTION IN COLPOSCOPY
SEQUENCES
Juan D. Garc´ıa-Arteaga, Jan Kybic
Center for Machine Perception, Czech Technical University, Karlovo N´amˇest´ı 13, Prague, Czech Republic
Jia Gu, Wenjing Li
STI Medical Systems, 733 Bishop Street, Suite 3100, Hawaii, USA
Keywords:
Medical Image Analysis, Registration,Computer-Aided Diagnosis, Colposcopy, Validation, Mutual Informa-
tion.
Abstract:
Colposcopy is a diagnostic method to visually detect cancerous and pre-cancerous tissue regions in the uterine
cervix. A typical result is a sequence of cervical images captured at different times after the application of a
contrast agent that must be spatially registered to compensate for patient, camera and tissue movement and on
which progressive color and texture changes may be seen. We present a method to automatically select correct
landmarks for non-consecutive sequence frames captured at long time intervals from a group of candidate
matches. Candidate matches are extracted by detecting and matching feature points in consecutive images.
Selection is based on geometrical constraints and a local rigid registration using Mutual Information. The
results show that these landmarks may be subsequently used to either guide or evaluate the registration of
these type of images.
1 INTRODUCTION
Colposcopy is a well established diagnostic method
for early cervical cancer detection (Ferris, 2002). It is
performed during a gynecological examination usu-
ally, but not always, following an abnormal pap smear
test (Wright et al., 2002). During the exam a low
concentration acetic acid (3 to 5%) is applied to the
cervix to induce temporal color and texture changes
in cancerous and pre cancerous tissue areas. An ex-
pert (colposcopist) observes the cervix through a low
magnification microscope(colposcope)duringthe ap-
pearance change process (three to five minutes). He
then reports his findings and, if necessary, recom-
mends a biopsy to confirm the diagnosis. Envisioned
CAD diagnostic systems aim to aid the physician in
his diagnosis by quantitatively measuring and com-
bining features with high prognostic values by ana-
lyzing high resolutionimages capturedduring the col-
poscopy exam (Lange and Ferris, 2005). This will re-
sult in more reliable diagnosis, minimization of the
variability among colposcopists and the proportion of
unnecessary false-positive biopsies.
Due to camera, patient and tissue movement, im-
ages taken during the exam must be spatially regis-
tered before the features extracted from each of them
can be fused with the rest of the set. Several retrospec-
tive image-registration schemes have been proposed
to rectify colposcopy image sequences, either con-
sidering each image individually (Lange et al., 2004)
or using several frames from the sequence (Barreto-
Flores et al., 2005). However there is no “gold stan-
dard” against which to compare the registration re-
sults other than using landmarks chosen by a human
operator. Landmark selection, even when done by an
expert, is subjective and difficult to reproduce.
In a recent article we showed how consistent land-
marks can be semiautomatically extracted from a col-
poscopic image sequence by using a general fea-
ture detector and putative matches between consec-
utive images (Garc´ıa-Arteaga and Kybic, 2007). At
the end of the process an expert chooses among the
detected feature points the final landmarks.This ap-
proach proved robust in consistently detecting and
matching correct features. The landmarks can then
be used for image registration validation or as an ad-
ditional cue for elastic registration. It relies however
on a subjective judgement to validate the match.
333
D. García-Arteaga J., Kybic J., Gu J. and Li W. (2007).
GEOMETRIC AND INFORMATION CONSTRAINTS FOR AUTOMATIC LANDMARK SELECTION IN COLPOSCOPY SEQUENCES.
In Proceedings of the Second International Conference on Computer Vision Theory and Applications - IFP/IA, pages 333-338
Copyright
c
SciTePress
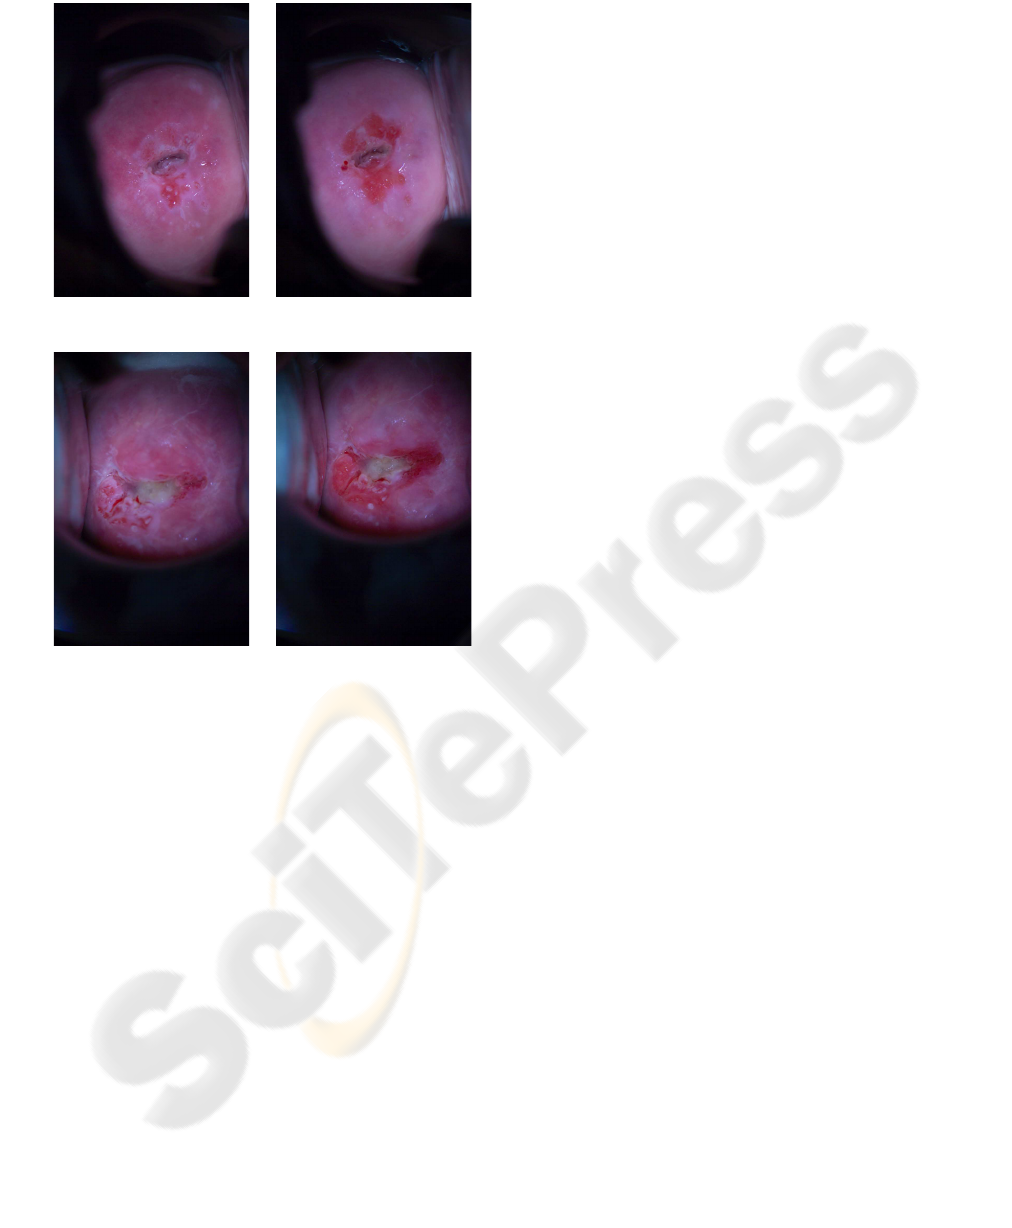
Seq. 82
60 secs. 299 secs.
Seq 90
60 secs. 299 secs.
Figure 1: The first and last frames of the colposcopy se-
quences used for the experiments were captured 60 seconds
(left column) and 299 seconds (right column) after the ap-
plication of acetic acid. They correspond to the maximum
color reaction and to the return to normal color, respectively.
In the present work we expand the previous
methodology and automate the landmark selection
process by addingadditional informationand geomet-
rical constraints. We assume that two detected and
matched feature points are corresponding landmarks
if an image similarity metric in the neighborhood of
the matched points is maximized when the landmarks
overlap. In other words, we assume that registering
the images in the neighborhood of the landmarks will
make the landmarks overlap only if they are correctly
matched. This assumption allows us to test and fully
automate the process of landmark selection. Addi-
tionally, the similarity criterion gives us a quantitative
measure of the quality of our match.
2 METHODS
The landmark selection process can be divided in
three main steps. First pairwise candidate matches are
calculated between every two consecutive frames of
a colposcopy image sequence as detailed in (Garc´ıa-
Arteaga and Kybic, 2007). A global rigid transfor-
mation that roughly aligns the images is calculated.
Then, for each of the point pairs, an initial transla-
tion that makes the candidate points overlap is cal-
culated. Using this translation as starting point, the
small neighborhood of each of the candidate points is
registered individually using different similarity crite-
ria.
2.1 Candidate Point Extraction
On every image, feature locations are extracted us-
ing the Harris corner detector (Harris and Stephens,
1988), a well studied method that detects sharp
changes in the first derivative of an image. On sharp
polyhedral constructions (such as buildings) these
features will correspond to corners. For other imaged
objects the Harris detector will be activated by other
features such as tight curves.
Because color and textural changes are gradual,
good putative matches can be made between the
points of interest found by the Harris detector in im-
ages captured at short time intervals. These matches
are made between all consecutive frames.
To select the candidate landmarksbetween images
m and n of the sequence only the points of interest that
are matched in all frames between m and n are taken
into account. This means that for the candidate fea-
ture point j in the initial image m (X
j
m
) and the can-
didate feature point j in the last image n (X
j
n
) to be
accepted as landmarks there must exist an equivalent
candidate feature point (X
j
k
) in image k for every k
between m and n. In other words, (X
j
m
, X
j
n
) is a can-
didate pair if and only if:
∀k, k ∈ N, m ≤ k < n ∃ X
j
k
, X
j
k+1
|X
j
k
↔ X
j
k+1
Interest points based on weak features will not sur-
vive for many frames. If all the matches throughout
the sequence are correct then the locations of each of
the candidate pair points corresponds to the same tis-
sue region.
2.2 Similarity Measures
We have used two common image similarity metrics:
Sum of Square Differences (SSD)(Zitova and Flusser,
2003) and Mutual Information (MI) (Viola and Wells,
1997).

The SSD criterion is one of the simplest and most
commonly used similarity measures, having a low
computational cost and smooth gradients. It assumes
equal intensity values for corresponding pixels in the
images. The SSD criterion of two images g and f
within an interest region Ω is:
J
SSD
(f(i, j), g(i, j)) =
∑
(i, j)⊂Ω
(f(i, j) − g(i, j))
2
(1)
The MI similarity criterion measures the statis-
tic dependency between two data sets. Because it
does not assume any a priori known dependency be-
tween the images it has been extensively used for
multi-modality image registration (Maes et al., 2003)
(Pluim et al., 2003). The MI criterion is usually writ-
ten in terms of entropy H:
J
MI
(f, g) = I(F, G) = H(F) + H(G) − H(F, G) (2)
H(F) = −
p
F
(ξ)log p
F
(ξ)dξ (3)
where F and G are random variables and pixel values
f
i
= f(x
i
), g
i
= g(x
i
) are assumed to be realizations of
F, G:f
i
∼ F, g
i
∼ G, ( f
i
, g
i
) ∼ (F,G). The unknown
probability distribution functions of F, G and (F, G)
may be estimated by a normalized histogram of the
intensity values.
For colposcopy images different tissue types sub-
ject to the contrast agent will have different reac-
tions (e.g. normal epithelia will not change whereas
metaplastic epithelia will turn opaque white). This
suggests that the use of a multi-modality registration
framework is necessary.
2.3 Deformations
The cervix is an elastic tissue and, as such, it will
undergo elastic deformations during the colposcopy
exam. However, we assume that the local deforma-
tion in the neighborhood of a point of interest (e.g.
a landmark) can be approximated by a rigid transfor-
mations consisting of a translation and a rotation. Fol-
lowing the notation of (Ib´a˜nez et al., 2005) we define
this transformation as:
g
∗
(θ,T,C)
(x
′
, y
′
) = g(x, y)
x
′
= (cosθ− sinθ)(x−C
x
) + (T
x
+Cx)
y
′
= (sinθ+ cosθ)(y−C
y
) + (T
y
+Cy) (4)
where θ is the rotation angle, (C
x
,C
y
) are the coordi-
nates of the rotation center and (T
x
, T
y
) are the com-
ponents of the translation.
2.4 Optimization
The registration is defined as the minimization of the
similarity criterion J:
arg min
θ,T
x
,T
y
J(f(i, j), g
∗
(θ,T,C)
(i, j)) (5)
where J will be either J
SSD
or J
MI
. We search for the
θ, T
x
and T
y
that solve this equation using a gradi-
ent descent algorithm for a window around every fea-
ture point pair X
j
. The center of rotation corresponds
to the test image feature coordinates (for simplicity
we will drop the superscript to refer to each candidate
pair in the rest of the article ):
C = X
test
The initial translation T
0
is chosen so the feature
point in the test image X
test
is mapped to the loca-
tion of the feature point in the reference image X
ref
,
making them overlap:
T
0
= X
ref
− X
test
All operations are carried over a square 65x65 Re-
gion of Interest (ROI) centered on the reference image
feature point location, in this case:
∀i, j ∈ N | X
ref x
− 32 ≤ i ≤ X
ref x
+ 32
X
ref y
− 32 ≤ j ≤ X
ref y
+ 32
This window size keeps the local deformation as-
sumption valid while still providing enough statistical
information to evaluate the MI criterion.
As a preprocessing step, all images are roughly
aligned by a sequential rigid registration of the frames
(Garc´ıa-Arteaga and Kybic, 2007) making initial an-
gle θ
0
= 0 for all feature point pairs of the image.
We consider the optimization process as an iter-
ative refinement of our initial estimation of the test
image feature point location. The new test image fea-
ture point location is chosen so that when transformed
it will overlap the reference image feature point. Set-
ting (x
′
, y
′
) = X
ref
in Equation 4 we find the new test
image feature location (x, y):
x = (x
′
− T
x
−C
x
)(cos(θ) − sin(θ))
−1
+C
x
y = (y
′
− T
y
−C
y
)(sin(θ) + cos(θ))
−1
+C
y
X
testNew
= (x, y)
The ITK implementations of the Mattes MI cri-
terion and of the gradient descent optimization were
used (Ib´a˜nez et al., 2005).
350 360 370 380 390 400
500
510
520
530
540
550
360 370 380 390 400 410 420
500
510
520
530
540
550
410 420 430 440 450 460 470
330
340
350
360
370
380
350 360 370 380 390 400
500
510
520
530
540
550
360 370 380 390 400 410 420
500
510
520
530
540
550
410 420 430 440 450 460 470
330
340
350
360
370
380
390
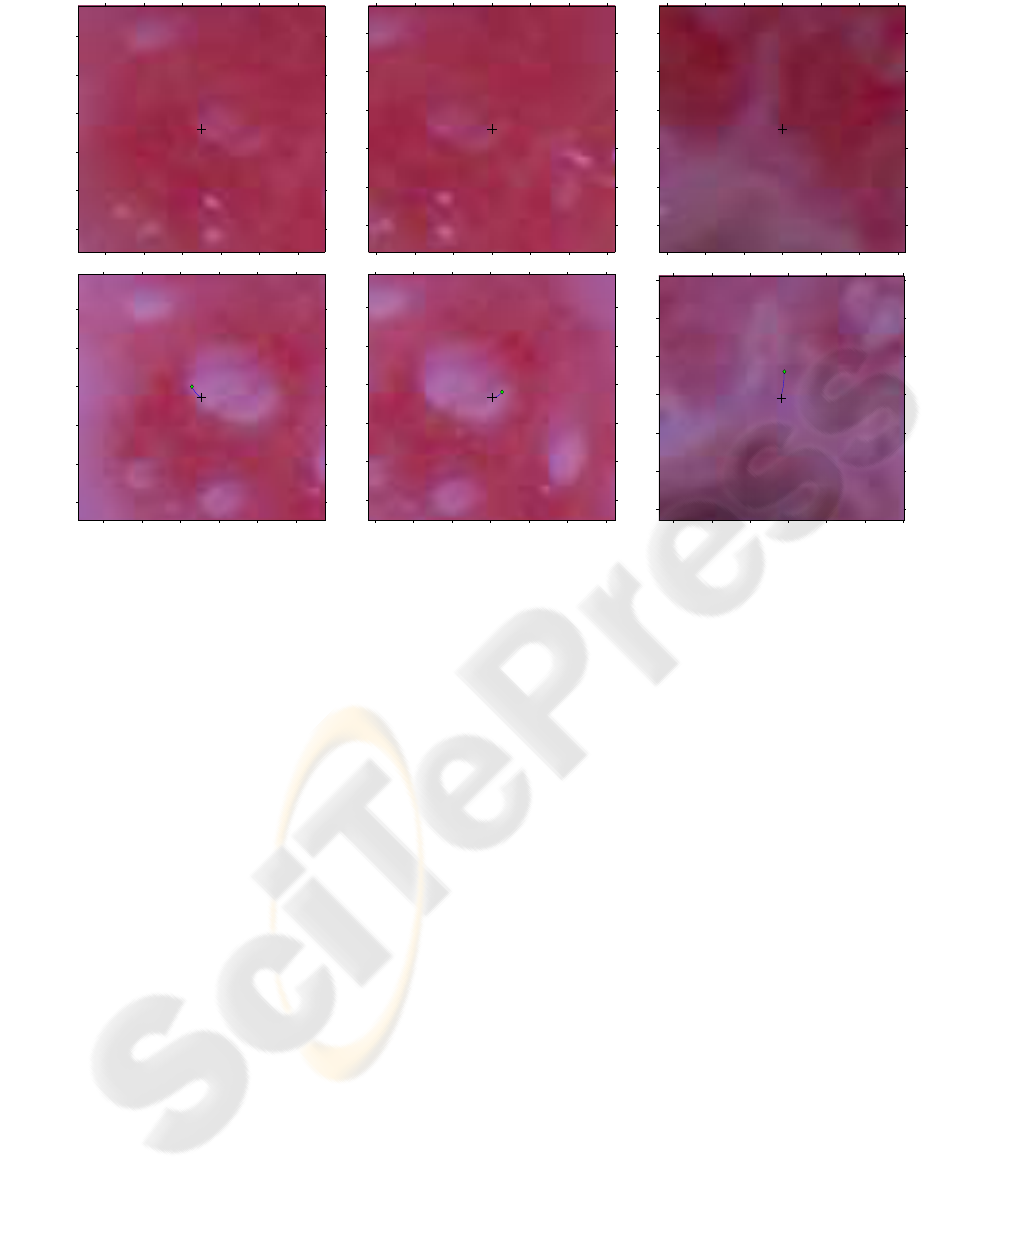
Figure 2: Final candidate pair location after MI registration is shown with a cross in the the template (top) and the test image
(bottom) for initially misaligned pairs. The line from the final to the initial location of the test image feature point (marked
with a diamond) illustrates the path followed by the optimization. The images shown correspond to the ROIs used for the
registration.
3 EXPERIMENTS
We have tested our method on the initial and final
frames of two sequences of images taken from dif-
ferent patients between 60 and 299 seconds after ap-
plication of the acetic solution (sequences 82 and 90,
seen in Figure 1). These images correspond to the
moment of maximal acetic whitening and to its return
to normalcolor. The sequences are composed of nine-
teen 750x1125 pixel color images taken at intervalsof
between 5 and 12 seconds with a cross-polarized filter
to reduce glint and a black opaque speculum that par-
tially masks the background. All operations are done
with grayscale versions of the images although final
results are presented in color. The landmark extrac-
tion algorithm produced 20 and 23 tentative matches,
respectively.
3.1 Results Mi
After registration the number of correct matches
(evaluated manually) goes from 6 to 15 out of 23 can-
didate pairs for sequence 82 and from 10 to 20 out of
23 for sequence 90. It should be noted that most of
the mismatches in sequence 82 occur in smooth fea-
tureless zones where, even for a human, it is difficult
to distinguish salient features. In this areas glint is
mistakenly detected as a valid candidate point.
The results of using MI for registration are clearly
visible in strongly misaligned windows as those seen
in Figure 2. The misalignment is usually due to one
or more mismatches during the candidate extraction
process, i.e. there is at least one k such that:
X
k
= X
k+1
When this happens the whole landmark selection
process is corrupted. By re-placing the test image
feature point location as described in Section 2.4, we
get good final matches from an originally mismatched
pair. This increases the number and quality of the fi-
nal landmarks.
3.2 Results Ssd
It was observed that in many cases the registration us-
ing the SSD criterion converged to minima far away
from the correct transformations, further misaligning
the landmarks as seen in Figure 3. It is difficult to
asses if this behavior is inherent to the appearance
changes induced by the contrast agent or to the severe
330 340 350 360 370 380 390 400
460
470
480
490
500
510
520
530
540
330 340 350 360 370 380 390 400
460
470
480
490
500
510
520
530
SSD
0 20 40 60 80 100 120
150
200
250
300
350
400
450
500
550
600
J
SSD
Iterations
0 20 40 60 80 100 120
−40
−30
−20
−10
0
10
20
Horizontal Displacement
Vertical Displacement
Displacement
Iterations
0 20 40 60 80 100 120
−0.4
−0.3
−0.2
−0.1
0
0.1
0.2
0.3
Rotation (Degrees)
Iterations
MI
0 20 40 60 80 100 120 140
−0.71
−0.7
−0.69
−0.68
−0.67
−0.66
−0.65
−0.64
−0.63
J
MI
Iterations
0 20 40 60 80 100 120 140
−1.5
−1
−0.5
0
0.5
1
1.5
Horizontal Displacement
Vertical Displacement
Displacement
Iterations
0 20 40 60 80 100 120 140
−0.02
0
0.02
0.04
0.06
0.08
0.1
Rotation(Degrees)
Iterations
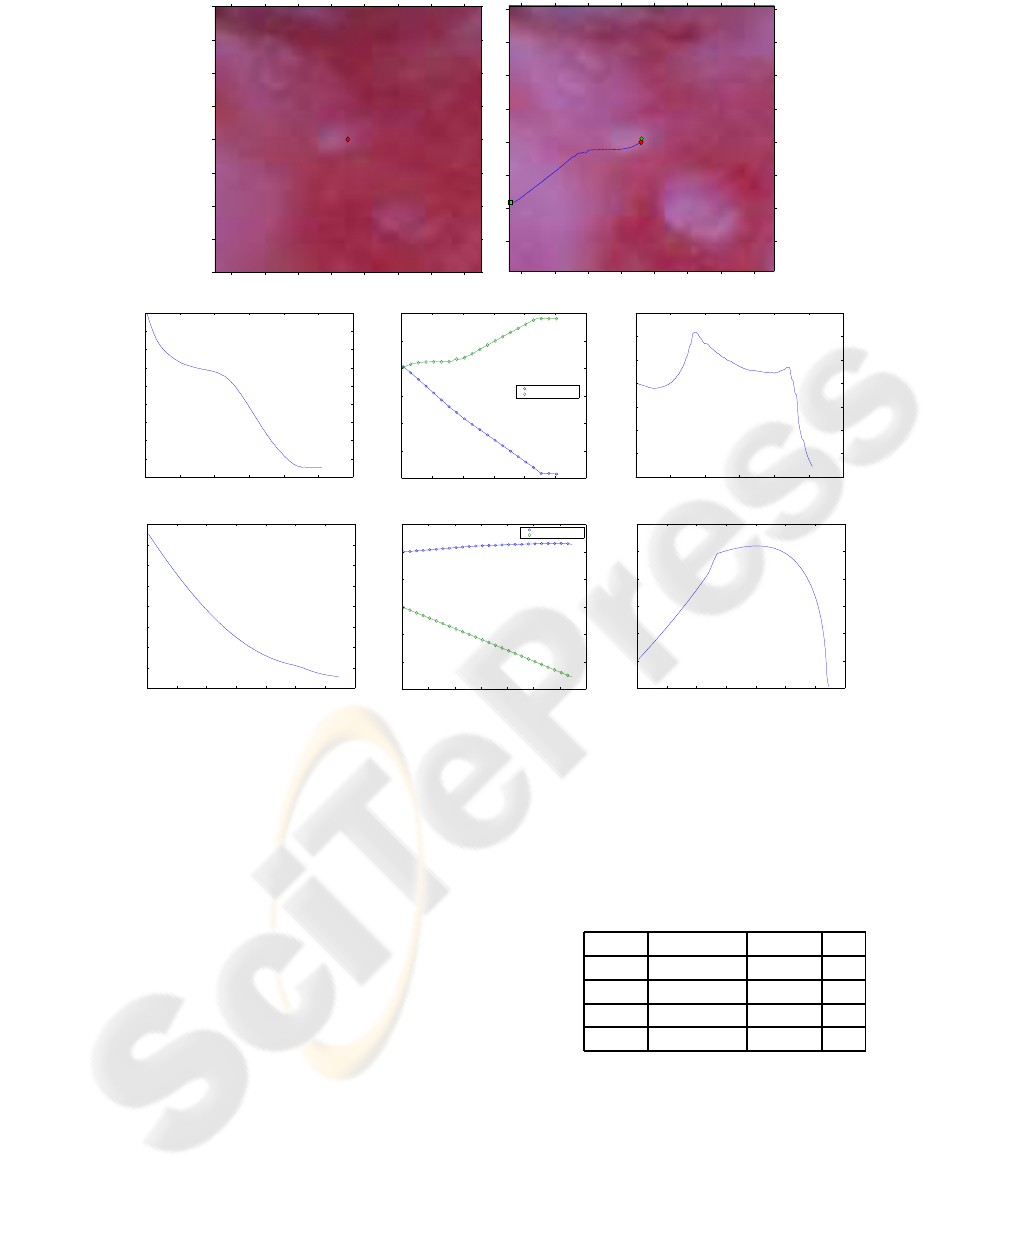
Figure 3: A correctly matched candidate point pair is shown in the reference (top left) and test image (top right) marked as
diamonds at the center of each image. Both the SSD (second row) and the MI (third row) criteria are minimized (leftmost
column). The final transformation (composed of the translations shown in the center column and the rotations on the right
column) re-locates the test image candidate point near its initial position when using MI (shown as a circle overlapping the
initial feature, top right) and drifts away from it when using SSD (final location shown as a square, top right).
illumination inhomogeneities known to be present in
cervical imagery (Dvir et al., 2006). This, together
with the low number of correct matches after registra-
tion (2 out of 20 for sequence 82 and 5 out of 23 for
sequence 90), leads us to believe that the SSD crite-
rion is not appropriate for cervical images at the level
of detail required for this application.
3.3 Geometric Validation
To select the final set of landmarks we check that
their position is consistent with the other landmarks,
that is, we add a geometric constrain. We used the
RANSAC algorithm (Fischler and Bolles, 1987) to
robustly fit the candidate points to a projective trans-
formation both before and after registration using MI.
Projective transformations have been used previously
Table 1: Results of RANSAC fitting. N is the number of
candidate points and Iterations the average number of itera-
tions over all runs.
Iterations Inliers N
82 402 0 23
82
MI
80 6 23
90 267 0 20
90
MI
46 5 20
for colposcopic sequence alignment (Barreto-Flores
et al., 2005) and their robust estimation from observed
data is a well studied problem (Hartley and Zisser-
man, 2004). The results of using the original (unreg-
istered) and the registered set of correspondencesmay
be seen in Table 1. The results shown are the average
of running RANSAC 120 times with each of the sets.

Points selected in 90% or more of the runs are
considered inliers. Visual inspection of the selected
candidate points confirms that all but one of the in-
liers selected corresponded to correct matches. The
remaining one is located in a smooth area where it is
not possible to determine if it is a correct match or
not. The very restrictive distance threshold between
the data points and the model used for outlier rejec-
tion (equal or less than a pixel) explains the relatively
low number of inliers when compared to manual eval-
uation.
It should be noted that it takes a much larger num-
ber of iterations to arrive to the final answer in the
original set of points than when fitting the MI regis-
tered set. This suggests a higher proportion of outliers
in the original set than in the registered set.
4 CONCLUSIONS
We have presented an improvement over our previ-
ous landmark extraction method for registration vali-
dation. The previous method made no direct compar-
ison between the registered images to guarantee the
similarity of the candidate points. We have shown
that this can be done by using a local estimate of the
MI criterion as a similarity measure and registering
locally with rigid transformations.
We have also observed that although low com-
plexity similarity criteria like the SSD are good for
matching consecutive frames with small appearance
changes, they are not appropriate to compare images
captured at long time intervals. The failure of the SSD
similarity criterion to align even correctly matched
candidate points confirms that multi modality regis-
tration framework is better suited for this type of im-
ages.
An additional geometrical constraint was added to
select the final landmarks. Such a constraint is nec-
essary because the MI similarity criterion, as imple-
mented, is not sufficiently discriminative to separate
landmarks from mismatches. Further research in the
use of similarity criteria that takes into account im-
portant visual information such as color and edges to-
gether with a better geometric model of the cervix de-
formation should improve the robustness of the sys-
tem and reduce the number of false negatives (land-
marks classified as mismatches).
REFERENCES
Barreto-Flores, A., Altamirano-Robles, L., Morales-Tepalt,
R. M., and Cisneros-Aragon, J. D. (2005). Identify-
ing precursory cancer lesions using temporal texture
analysis. In Second Canadian Conference on Com-
puter and Robot Vision, pages 34–39. IEEE Computer
Society.
Dvir, H., Gordon, S., and Greenspan, H. (2006). Illumina-
tion correction for content analysis in uterine cervix
images. In CVPRW ’06: Proceedings of the 2006
Conference on Computer Vision and Pattern Recogni-
tion Workshop, page 95, Washington, DC, USA. IEEE
Computer Society.
Ferris, D. (2002). Modern Colposcopy: Textbook and Atlas.
Kendall Hunt Publishing Company, Dubuque, Iowa,
2nd edition.
Fischler, M. A. and Bolles, R. C. (1987). Random sam-
ple consensus: a paradigm for model fitting with ap-
plications to image analysis and automated cartogra-
phy. Morgan Kaufmann Publishers Inc., San Fran-
cisco, CA, USA.
Garc´ıa-Arteaga, J. D. and Kybic, J. (2007). Automatic
Landmark Detection for Cervical Image Registration
Validation. SPIE Medical Imaging 2007, in press.
Harris, C. and Stephens, M. (1988). A combined corner and
edge detection. In Proceedings of The Fourth Alvey
Vision Conference, pages 147–151.
Hartley, R. I. and Zisserman, A. (2004). Multiple View
Geometry in Computer Vision. Cambridge University
Press, ISBN: 0521540518, second edition.
Ib´a˜nez, L., Schroeder, W., Ng, L., and Cates, J. (2005). The
ITK Software Guide. Kitware, Inc., second edition.
Lange, H., Baker, R., H˚akansson, J., and Gustafsson, U. P.
(2004). Reflectance and fluorescence hyperspectral
elastic image registration. In Fitzpatrick, J. M. and
Sonka, M., editors, Medical Imaging 2004: Phys-
iology, Function, and Structure from Medical Im-
ages. Edited by Amini, Amir A.; Manduca, Armando.
Proceedings of the SPIE, Volume 5370, pp. 335-345
(2004)., pages 335–345.
Lange, H. and Ferris, D. G. (2005). Computer-aided-
diagnosis (CAD) for colposcopy. Medical Imaging
2005: Image Processing, 5747(1):71–84.
Maes, F., Vandermeulen, D., and Suetens, P. (2003). Med-
ical image registration using mutual information. Pro-
ceedings of the IEEE, 91(10):1699–1722.
Pluim, J. P. W., Maintz, J. B. A., and Viergever, M. A.
(2003). Mutual-information-based registration of
medical images: a survey. Medical Imaging, IEEE
Transactions on, 22(8):986–1004.
Viola, P. and Wells, W. M. I. (1997). Alignment by max-
imization of mutual information. Int. J. Comput. Vi-
sion, 24(2):137–154.
Wright, T. C. J., Cox, T. J., Massad, L. S., Twiggs,
L. B., Wilkinson, E. J., and for the 2001 ASCCP-
Sponsored Consensus Conference (2002). 2001 Con-
sensus Guidelines for the Management of Women
With Cervical Cytological Abnormalities. JAMA,
287(16):2120–2129.
Zitova, B. and Flusser, J. (2003). Image registration
methods: a survey. Image and Vision Computing,
21(11):977–1000.
