
NEW RESULTS ON DIAGNOSIS BY FUZZY PATTERN
RECOGNITION
Mohamed Saïd Bouguelid, Moamar Sayed Mouchaweh and Patrice Billaudel
Centre de Recherche en Science et Technologie de l’Information (CReSTIC),Université de Reims-Champagne-Ardennes
Moulin de la Housse, BP 1039, 51687 Reims, France
Keywords: Pattern recognition, Fuzzy pattern matching, Nearest Neighbours techniques, Multi-criteria decision.
Abstract: We use the classification method Fuzzy Pattern Matching (FPM) to realize the industrial and medical
diagnosis. FPM is marginal, i.e., its global decision is based on the selection of one of the intermediate
decisions. Each intermediate decision is based on one attribute. Thus, FPM does not take into account the
correlation between attributes. Additionally, FPM considers the shape of classes as convex one. Finally the
classes are considered as equi-important by FPM. These drawbacks make FPM unusable for many real
world applications. In this paper, we propose improving FPM to solve these drawbacks. Several synthetic
and real data sets are used to show the performances of the Improved FPM (IFPM) with respect to classical
one as well as to the well known classification method K Nearest Neighbours (KNN). KNN is known to be
preferment in the case of data represented by correlated attributes or by classes with different a priori
probabilities and non convex shape.
1 INTRODUCTION
In statistical Pattern Recognition (PR) (Dubuisson,
2001), historical patterns about system functioning
modes are divided into groups of points, called
classes, using unsupervised learning method (Duda,
2001) or human experience. These patterns, or
points, with their class assignments, constitute the
learning set. A supervised learning method uses the
learning set to build a classifier that best separates
the different classes in order to minimize the
misclassification error. This separation, or
classification, is realized by using a membership
function, which determines the likelihood or the
certainty that a point belongs to a class.
The membership function can be generated using
Probability Density Function (PDF) estimation
based methods or heuristics-based ones. In the first
category, the membership function is equal to either
the PDF or to the probability a posterior. The
estimation of PDF can be parametric, as the baysien
classifier (Dubuisson, 1990), or non parametric, as
the Parzen window (Dubuisson, 2001), voting k
nearest neighbour rules (Denoeux, 1998), (Denoeux,
2001) and (Dubuisson, 2001), or by histograms
(Sayed Mouchaweh, 2004), (Medasani, 1998). In
heuristic-based methods (Medasani, 1998), the shape
of the membership function and its parameters are
predefined either by experts to fit the given data set,
or by learning to construct directly the decision
boundaries as the potential functions (Dubuisson,
1990) and neural networks (Ripley, 1996), or the
clustering methods as Fuzzy C-Means (Medasani,
1998).
One of the applications of PR is the diagnosis of
industrial systems for which no mathematical or
analytical information is available to construct a
model about the system functioning. Each
functioning mode, normal or faulty, is represented
by a class. The problem of diagnosis by PR becomes
a problem of classification, i.e., the actual
functioning mode can be determined by knowing the
class of the actual pattern, or observation, of the
system functioning state.
There are many fuzzy classification methods in
the literature. The choice of one of them depends on
the given application and the available data. We use
the method Fuzzy Pattern Matching (FPM)
(Devillez, 2004b), (Grabish, 1992) and (Sayed
Mouchaweh, 2002a) because it is simple, adapted to
incomplete database cases and has a small and
constant classification time. FPM is a marginal
classification method, i.e., its global decision is
167
Saïd Bouguelid M., Sayed Mouchaweh M. and Billaudel P. (2007).
NEW RESULTS ON DIAGNOSIS BY FUZZY PATTERN RECOGNITION.
In Proceedings of the Fourth International Conference on Informatics in Control, Automation and Robotics, pages 167-172
DOI: 10.5220/0001628401670172
Copyright
c
SciTePress

based on the selection of one of the intermediate
decisions. Each intermediate decision is calculated
using a membership function based on a probability
histogram for each class according to each attribute.
Thus, FPM is not adapted to work with data
represented in a space of correlated attributes.
Additionally, it does not respect the shape of classes
if this shape is non convex. Finally, all the classes
are considered as equi-important, i.e., with the same
a priori probabilities.
In this paper we propose a solution to develop
FPM to take into account the correlation between
attributes as well as the class importance and its
shape if this shape is non convex. The paper is
structured as follows. Firstly, the functioning of
FPM is explained briefly. Then the limits of FPM
are discussed using some synthetic examples. Next,
several real examples are used to evaluate the
performances of the Improved FPM (IFPM) with
respect to the classical one as well as to the well
known classification method K Nearest Neighbours
(KNN). This evaluation is based on the
misclassification rate. Finally a conclusion ends this
paper.
2 FUZZY PATTERN MATCHING
FPM, described in (Devillez, 2004b), (Grabish,
1992) and (Sayed Mouchaweh, 2002a), is a
supervised classification method based on the use of
probability histograms. Let C
1
, C
2
, …, C
c
denote the
classes described by a attributes. These attributes
provide different points of view about the
membership of an incoming point in the different
classes. The functioning of FPM involves two
phases: the learning and the classification ones.
2.1 Learning Phase
In the learning phase, the data histograms are
constructed for each class according to each
attribute. The number of bins h for a histogram is
experimentally determined. This number has an
important influence on the performances of FPM
(Sayed Mouchaweh, 2002b). The histogram upper
and lowest bounds can be determined either as the
maximal and minimal learning data coordinates or
by experts. In this paper, we adopted the first
manner and we have added a tolerance Tol to adjust
this histogram in order to maximize FPM
performances. The height of each bin is the number
of learning points located in this bin. The probability
distribution
j
i
p of the class C
i
according to the
attribute j is calculated by dividing the height of
each bin b
k
by the total number N
i
of learning points
belonging to the same class. Then these probabilities
{
}
{
}
hkyp
k
b
j
i
,...,2,1,)( ∈ are assigned to bins
centres
k
b
y
. The PDF
j
i
P is obtained by a linear
linking between the bins heights centres. Indeed if
we have a large number of data, the normalized
histogram can be assumed to approximate the PDF.
In order to take into account the uncertainty and
the imprecision contained in the data, the probability
distribution
j
i
p is converted into possibility one
j
i
π
.
This conversion is realized using the transformation
of Dubois and Prade (Dubois, 1993) defined as:
∑
=
=
h
kd
b
j
i
b
j
i
b
j
i
dkk
yp,ypminy ))()(()(
π
(1)
We have chosen this transformation for the good
results which it gives in PR applications (Sayed
Mouchaweh, 2002b), (Sayed Mouchaweh, 2006). A
linear linking between bins heights centres converts
the distribution of possibilities
{
}
{
}
hky
k
b
j
i
,...,2,1,)( ∈
π
into density one
j
i
Π
. This
operation is repeated for all the attributes of each
class.
2.2 Classification Phase
The membership function
j
i
μ
for each class C
i
and
according to each attribute j is considered to be
numerically equivalent to the possibility distribution
(Zadeh, 1978). Thus, the classification of a new
point x, whose values of the different attributes are
x
1
, …, x
j
, …, x
a
, is made in two steps:
Determination of the possibility membership
value
j
i
π
of the point x to each class C
i
according to the attribute j by a projection on
the corresponding possibility density
j
i
Π
;
Merging all the possibility values
1
, ...,
a
ii
π
π
,
concerning the class C
i
, into a single one by an
aggregation operator H:
),...,(
1 a
iii
H
πππ
=
(2)
The result
i
π
of this fusion corresponds to the
global possibility value that the new point x belongs
to the class C
i
. The operator H can be a
ICINCO 2007 - International Conference on Informatics in Control, Automation and Robotics
168
multiplication, a minimum, an average, or a fuzzy
integral (Grabish, 1992). Finally, the point x is
assigned to the class for which it has the maximum
membership value.
3 LIMITS OF FPM
3.1 Classes of Non Convex Shape
FPM is similar to the naive Bayesian classifier who
supposes the attributes statistically independent.
This classifier defines the probability a
posterior
()
i
CxΦ that x belongs to the class C
i
by:
a
j=1
() ( )()
j
iii
Cx pxCPCΦ=
∏
(3)
Where
()
j
i
px C is the marginal conditional density
of the attribute j given the class C
i
and P(C
i
) denotes
the a priori probability of the class C
i
. If the a priori
probabilities of classes are the same, then the
equation (3) becomes similar to the equation (2).
Thus FPM, as all the other marginal methods, does
not take into account neither the correlation between
attributes nor the class importance or its shape if it is
non convex. Indeed, FPM produces always
rectangular membership level curves for all the
possible class shapes. Figure 1.a and Figure 1.b
present respectively the membership level curves
obtained by FPM for a class defined either by two
linear or non linear correlated attributes. We can
notice that these levels do not respect the class
shape.
Figure 1.a: Membership level curves obtained by FPM for
a class defined by linear correlated attributes.
In (Devillez, 2004a), two improvements were
proposed to integrate the information about class
shape in the learning phase. These two
improvements are based on the division of each
class into several sub ones. However these
improvements have some drawbacks as the critical
determination of the value of some parameters, like
the number of subclasses, the expensive computation
time and the rejection areas inside classes, i.e., areas
in which points are not assigned to any class.
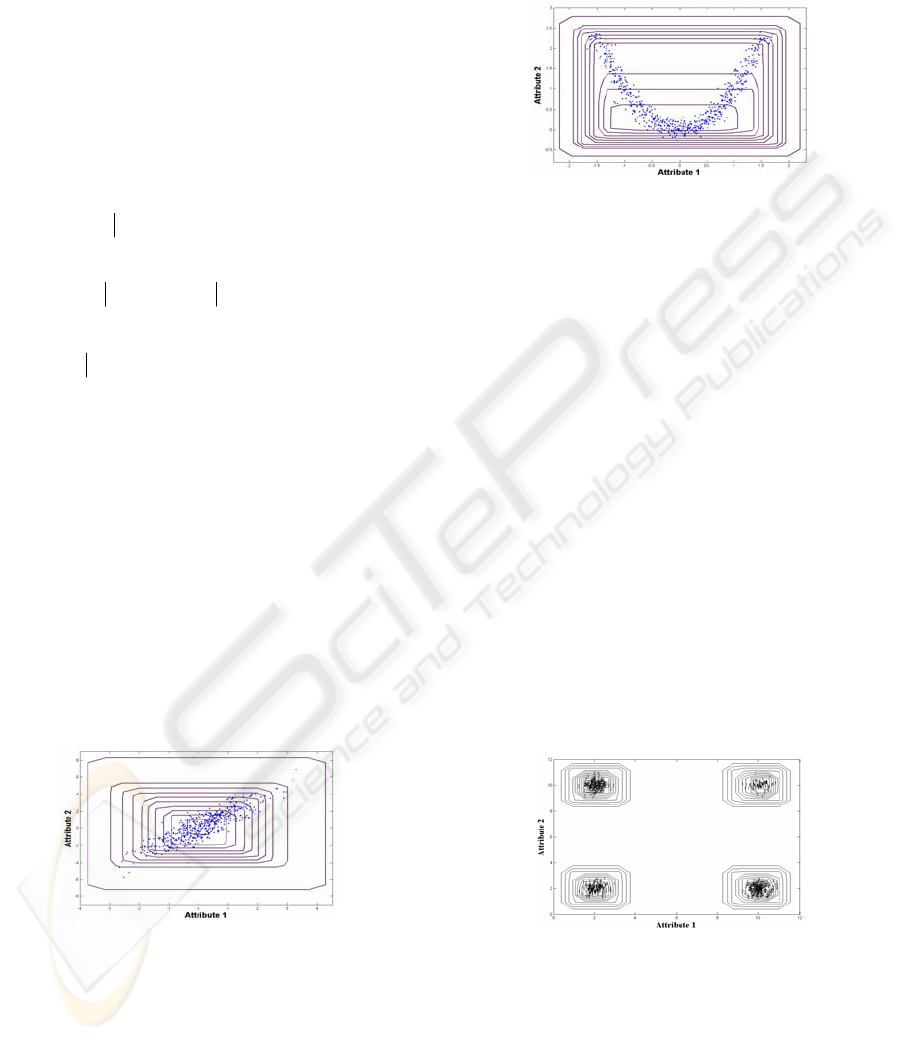
Figure 1.b: Membership level curves obtained by FPM for
a class defined by non linear correlated attributes.
3.2 Classes with Correlated Attributes
The XOR data are a classical example used in the
literature to show the correlation between attributes.
Indeed any classifier needs to use the information
issued from all the attributes to take a correct
decision. Thus FPM is not adapted for this type of
data since its decision is based on the selection of
one attribute. The Figure 2 shows XOR data in a
representation space of two attributes as well as the
membership level curves, obtained by FPM for the
class 1. We can see that the classes have a convex
shape and that FPM does not distinguish between
the points of the class 1 and the ones of the class 2.
Thus the improvements proposed by Devillez
(Devillez, 2004a) cannot solve this problem since
they were developed to be adapted to the class shape
and not to the case of correlated attributes. Same
remark can be noticed for the membership level
curves of the class 2.
Figure 2: The membership level curves, obtained by FPM,
for XOR data for the class 1.
In (Cadenas, 2004) a solution to make FPM
operant in the case of data with correlated attributes
is presented. This solution uses the Parzen Window
method to construct the membership functions of
each class according to one main feature and, if it is
necessary, to one auxiliary feature. The
NEW RESULTS ON DIAGNOSIS BY FUZZY PATTERN RECOGNITION
169
classification phase uses the fuzzy integral as an
aggregation operator. However, this solution is
consuming of time and has an exponential
complexity according to the number of attributes. In
addition, this solution does not work in the case of
XOR described by more than two attributes.
4 IMPROVED FPM (IFPM)
We propose a solution to make FPM operant in the
case of data with correlated attributes and classes of
non convex shape. This solution looks for the
relationship between the attributes of the
representation space using the learning set. This
relationship is represented by a correlation matrix
between the bins of the histogram of the first
attribute and all the other bins of the other
histograms of the other attributes. This solution does
not require any determination of any supplementary
parameter. The functioning of IFPM is divided into
two phases: learning and classification ones.
4.1 Learning Phase
The learning phase of IFPM is similar to the one of
FPM but it integrates in addition the information
about the zones of learning points inside the
representation space. Each zone is resulting by the
intersection of the bins of a learning point according
to all attributes.
Let X denotes the learning set which contains N
points x divided into c classes inside a representation
space of a attributes. Each class C
i
contains n
i
points:
{1,2,..., }ic∈ . Each histogram for each
attribute j,
{1,2,..., }ja∈ , contains h bins
j
j
k
b ,
{1, 2 , ..., }
j
kh∈ . The correlation matrix B for the
learning set X is defined as follows:
],...,,...,,[
21 ci
BBBBB =
(4)
Where
i
B is the correlation matrix for the class
C
i
. This matrix can be calculated as follows:
{
}
[1,0]
x
ii
b
B
α
=∈
(5)
Where x belongs to the zone resulting by the
intersection of the bins
12
12
[, ,..., ]
a
a
xkk k
bbb b= .
x
i
b
α
is
the correlation factor between the bin
1
1
k
b of the first
attribute and all the other bins of the other attributes
according to the class C
i
. This correlation factor can
be calculated using the following equation:
,() :
i
x
XCx C
∀
∈=
1213 1
1213 1
If ... 1
Else 0
ax
x
ai
kkkk kk b
i
b
xb b b b b b
α
α
⎧
∈
∩∧∩∧∧∩⇒ =
⎪
⎨
⇒=
⎪
⎩
(6)
Where “
∧
” and “
∩
” denote respectively the AND
and intersection operators.
The Figure 3 shows a simple example of the
calculation of the matrix B for the case of a
representation space containing one class defined by
two attributes. We can notice that the bins
1
2
b and
2
2
b are correlated because a learning point is located
in the zone resulting by the intersection of these two
bins. Thus the correlation factor of this zone
12
22
1
bb
α
is
equal to 1 in the matrix B. While there is no learning
point in the zone of the intersection of the bins
1
1
b
and
2
5
b . The correlation factor of this zone
12
5
1
1
bb
α
is
equal to zero in B.
b
5
b
4
b
3
b
2
b
1
a
1
a
2
x
1
x
2
x
3
x
4
x
5
x
6
x
7
x
8
x
9
x
1
x
2
x
3
x
4
x
5
x
6
x
7
x
8
x
9
1
C
1
1
2
2
1
2
=
bb
α
0
1
2
5
1
1
=
bb
α
⎥
⎥
⎥
⎥
⎥
⎥
⎦
⎤
⎢
⎢
⎢
⎢
⎢
⎢
⎣
⎡
10000
01010
00101
00110
01000
b
1
b
2
b
3
b
4
b
5
b
1
b
2
b
3
b
4
b
5
b
1
b
2
b
3
b
4
b
5
h
a
2
a
1
B
1
Figure 3: Correlation Matrix obtained by IFPM for the
class
1
C inside
2
ℜ
.
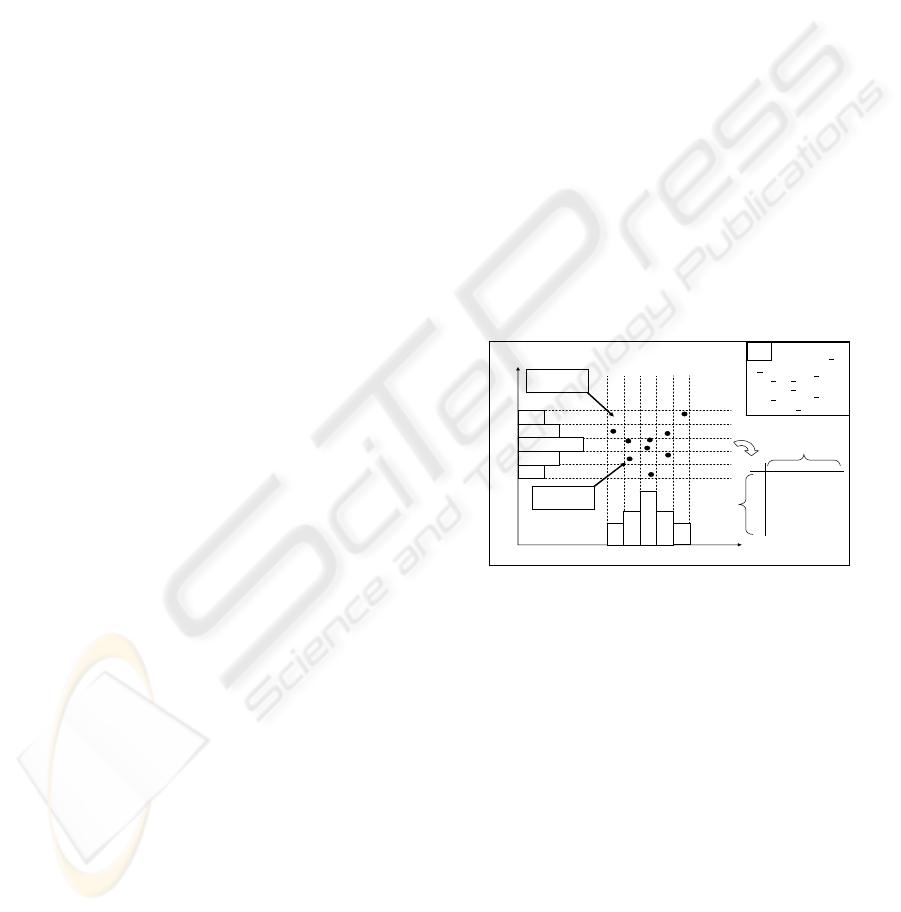
4.2 Classification Phase
The classification of a new point x starts by
determining its bins according to each attribute
12
12
[ , ,..., ].
a
a
xkk k
bbb b= Then the possibility membership
value
i
π
for each class C
i
is calculated exactly as
FPM if and only if
1=
i
b
x
α
. In order to take onto
account the importance of a class, the possibility of
each class is multiplied by its a priori probability. If
,0=
i
b
x
α
the point x will be rejected according to the
class
C
i
, i.e., 0
i
π
=
. Finally the point x will be
assigned to the class for which it has the highest
possibility membership value. The Figure 4
ICINCO 2007 - International Conference on Informatics in Control, Automation and Robotics
170
represents the steps of the classification phase of
IFPM
Classification by IFPM
1
1
[ ,..., ,..., ]
jh
ja
xk k k
bb b b=
Calculating by FPM the
membership value
π
i
of
x
to
C
i
Rejecting the point
x
according to the class
C
i
→
π
i
= 0
1
x
i
b
α
=
Yes
No
Finding the correlation factor in
the matrix
B
x
i
b
α
For each class
C
i
,
i =
1
,…,
c
ic= ic=
Determination of the bins
b
x
of the
point
x
according to each attribute
j
1
(,, , )
j
aT
x
xxx= ……
New point:
Assigning
x
to the class for which it
has the maximum membership value
No
Yes
1
i
ii
c
j
j
N
N
π
π
=
=
∑
Figure 4: Algorithm of the classification phase of IFPM.
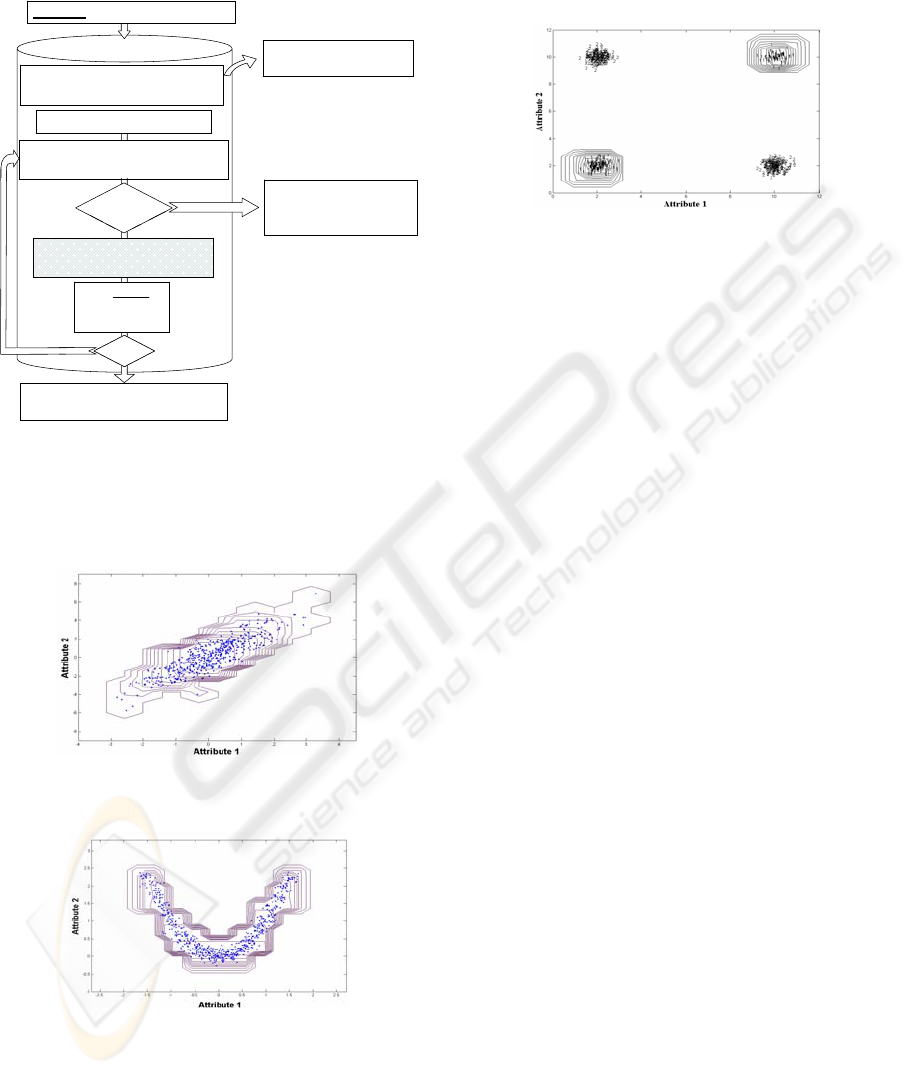
The Figure 5.a and Figure 5.b show the
membership level curves issued from the application
of IFPM on the two examples of the Figure 1.
Figure 5.a: Membership level curves obtained by IFPM
for a class defined by linear correlated attributes.
Figure 5.b: Membership level curves obtained by IFPM
for a class defined by non linear correlated attributes.
We can find that these curves respect the non
spherical and non convex shapes of classes.
Equally, the Figure 6 shows these curves for the
class 1 obtained by IFPM, for XOR data. We can
find that IFPM discriminates well the points of the
class 1 and the class 2. Same result can be obtained
for the class 2.
Figure 6: Membership level curves, obtained by IFPM, for
XOR data for class 1.
5 EXPERIMENTAL RESULTS
We will test the performances of IFPM with FPM
and classical as well as Fuzzy KNN (FKNN) with
crisp initialisation and several values of k between 1
and 15, using the misclassification rate as evaluation
criterion. For that we use four data sets: XOR
problem, Spiral, Pima Indians diabetes (Newman,
1998) and Ljubljana Breast Cancer (LBC) data sets
(Newman, 1998). XOR problem data set is
composed of 2 classes in a representation space of 5
attributes. We have chosen 5 attributes to test IFPM
performances in the case of a representation space
characterized by more than 2 correlated attributes.
Spiral data are represented in terms of evenly spaced
samples from a non linear two-dimensional
transformation of the Cartesian coordinates. We
have chosen this data set because the classes are non
linearly separable. The Pima and LBC data sets are
known to be strongly non Gaussian. The number of
points in each class, the number of classes and the
number of attributes are depicted in Table 1.
We have used the leave-one-out method to
calculate the Misclassification Rate (MR) because it
gives a pessimistic unbiased estimation of MR. We
integrate also the Rejection Rate (RR) to indicate the
number of points which are not assigned to any
class. Indeed, it is better to reject a point than to
misclassify it. The Table 2 shows the obtained
results for the three methods. These results are
obtained using the optimal values of
h and Tol for
FPM and IFPM, and
K for KNN. We can conclude
that IFPM provides better results, according to the
evaluation criterion and for the four data sets, than
FPM and both, KNN and FKNN.
NEW RESULTS ON DIAGNOSIS BY FUZZY PATTERN RECOGNITION
171

Table 1: Data Sets used for the test.
Data set Classes DIM Per Class
XOR 2 5 {400,400}
Spiral
2 2 {970,970}
Pima
2 8 {268,500}
LBC
2 9 {218,68}
Table 2: Comparison between IFPM, FPM, KNN and
FKNN, using leave-one-out technique, according to
Rejection Rate (RR) and to Misclassification Rate (MR).
Method FPM
IFPM
Criterion
MR (%) RR (%)
MR (%) RR (%)
XOR 44.12 0 0 0
Spiral 18.24 0 0 1.5
Pima 30.73 0.78 19.53 20.7
LBC 25.87 1.05 10.14 30.42
Method KNN FKNN
XOR 0 0 0 0
Spiral 0 0 0 0
Pima 25.26 0 26.43 0
LBC 23.78 0 23.43 0
6 CONCLUSIONS
In this paper, we have proposed a solution to adapt
the classification method Fuzzy Pattern Matching
(FPM) to be operant in the case of classes with
correlated attributes as well as the class importance
and its shape if this shape is not convex. The
integration of this solution in FPM is called
Improved FPM (IFPM). The performances of IFPM
are compared with the ones of FPM, K Nearest
Neighbours (KNN) and Fuzzy KNN (FKNN) using
the misclassification rate as evaluation criterion.
This comparison is realized according to four data
sets. We have also used XOR problem and Spiral
data which are widely used to study the correlation
between attributes. In addition, we have used Pima
Indians diabetes and Ljubljana Breast Cancer data
sets which are known to be strongly non Gaussian
with different a priori probabilities. The
misclassification rate obtained by IFPM is better
than the one of FPM, KNN and FKNN. However,
IFPM rejects more points than the previous methods.
Anyway, it is better to reject a point than to
misclassify it.
REFERENCES
Cadenas, J.M., M.C. Garrido and J.J. Hernandez, 2004.
Improving fuzzy pattern matching techniques to deal
with non discrimination ability features. In: IEEE
International Conference on Systems, Man and
Cybernetics, pp. 5708-5713.
Denoeux, T., M. Masson and B. Dubuisson, 1998.
Advanced pattern recognition techniques for system
monitoring and diagnosis: a survey. In: Journal
Européen des Systèmes Automatisés (RAIRO-APII-
JESA), Vol. 31(9-10), pp. 1509-1539.
Denoeux, T. and L.M. Zouhal, 2001. Handling
possibilistic labels in pattern classification using
evidential reasoning. In: Fuzzy Sets and Systems, Vol.
1(22), pp. 409-424.
Devillez, A., 2004a. Four supervised classification
methods for discriminating classes of non convex
shape. In: Fuzzy sets and systems, Vol. 141, pp. 219-
240.
Devillez, A., M.Sayed Mouchaweh and P. Billaudel,
2004b. A process monitoring module based on fuzzy
logic and Pattern Recognition. In: International
Journal of Approximate Reasoning, Vol. 37, Issue 1,
pp.43-70.
Dubois, D. and H. Prade, 1993. On possibility/probability
transformations, In: Fuzzy Logic, pp. 103-112.
Duda, R.O., P.E. Hart and D.E. Stork, 2001. Pattern
Classification second edition. Wiley, New York
Dubuisson, B., 2001. Automatique et statistiques pour le
diagnostic. Traité IC2 Information, commande,
communication. Hermes Sciences, Paris.
Dubuisson, B., 1990. Diagnostic et reconnaissance des
formes, Traité des Nouvelles Technologies, série
Diagnostic et Maintenance, Hermes Sciences, Paris.
Grabish, M. and M. Sugeno, 1992. Multi-attribute
classification using fuzzy integral. In: Proc. of fuzzy
IEEE, pp. 47-54.
Medasani, S., K. Jaeseok and R. Krishnapuram, 1998, An
overview of membership function generation
techniques for pattern recognition. In: International
Journal of Approximate Reasoning,Vol. 19,pp. 391-
417.
Newman D.J., Hettich, S., Blake C.L. and Merz, C.J,
1998. UCI Repository of machine learning databases,
http://www.ics.uci.edu/~mlearn/MLRepository.html,
Dept. of Information and Computer Science,
University of California, Irvine.
Ripley, B.D.,1996. Pattern Recognition and Neural
Networks. Cambridge University Press, Cambridge.
Sayed Mouchaweh, M., A. Devillez, G.V. Lecolier and P.
Billaudel, 2002a. Incremental learning in real time
using fuzzy pattern matching. In: Fuzzy Sets and
Systems, Vol. 132/1, pp. 49-62.
Sayed Mouchaweh, M. and P. Billaudel ,2002b. Influence
of the choice of histogram parameters at Fuzzy Pattern
Matching performance. In: WSEAS Transactions on
Systems, Vol. 1, Issue 2, pp. 260-266
Sayed Mouchaweh, M., 2004. Diagnosis in real time for
evolutionary processes in using Pattern Recognition
and Possibility theory. In: International Journal of
Computational Cognition 2, Vol. 1, pp. 79-112.
Zadeh, L. A., 1978. Fuzzy sets as a basis for a theory of
possibility. In: Fuzzy sets and systems, Vol. 1, pp. 3-2.
ICINCO 2007 - International Conference on Informatics in Control, Automation and Robotics
172
