
MULTICHANNEL FILTER FOR ENHANCEMENT OF SPEECH
BLOCKS
Ivandro Sanches
Genius Instituto de Tecnologia, Manaus, Amazonas, Brazil
Keywords: Speech, noise, microphone array.
Abstract: This work presents the concepts and the achieved results of a proposed microphone array algorithm based
on multi-dimensional Wiener filter developed to work on blocks of speech. The inputs to the algorithm are
two correlation matrices: the correlation matrix of the background noise affecting the desired signal and the
correlation matrix of the signal affected by the noise. Experiments show that improvements of more than
12dB on signal to noise ratio can be achieved when comparing the filtered signals with one of the
microphone array channels. In order to save computational load, the input signal is processed in blocks of a
specified size and a technique is proposed to reduce blocking effects on the output filtered signal. It will be
shown that practically there are no blocking effects. It is also shown that the technique is independent of the
array physical configuration.
1 INTRODUCTION
Speech communication or recognition systems on
embedded and other kinds of applications are
demanding for effective ways of dealing with low
signal to noise ratio (SNR) and the mobility of
speakers (or even the mobility of applications, in the
case of robots). Microphone array techniques play
an important role in this scenario. This work
presents a multichannel algorithm which
significantly increases the SNR, copes with any
microphone array geometry and may facilitate user’s
and application mobility.
Next section introduces the notation and
describes the algorithm. Section 3 presents signal
enhancement results when the technique is applied
to simulated data and, then, data acquired in real
conditions. Simulated data were used in order to
show and simulate the independency on array
physical configuration and to show the absence of
blocking effects in the filtered signal.
2 ALGORITHM PRESENTATION
The proposed algorithm has some resemblance to
(Florencio and Malvar, 2001) and (Doclo and
Moonem, 2001). It differs from both in the sense
that the input and output signals are processed in
blocks of samples to considerably reduce the
computational load. Analysis of the algorithm in
hearing aid applications is presented in (Spriet,
Moonen, and Wouters, 2005).
The notation used is presented next. It is
assumed that speech, s, and affecting noise, n, are
statistically uncorrelated, and that noise is linearly
added to speech:
x = s + n, (1)
where x is the output from the N channels of the
microphone array for a given frame analysis of L
S
samples per channel:
⎥
⎥
⎥
⎥
⎦
⎤
⎢
⎢
⎢
⎢
⎣
⎡
=
)()2()1(
)()2()1(
)()2()1(
222
111
SNNN
S
S
Lxxx
Lxxx
Lxxx
"
#%##
"
"
x
. (2)
Our objective is to estimate the clean signal s
given x, the noise statistics, and the filter order L. In
general, we may not need to estimate s, but just one
of the N rows of s. In the approach, without loss of
generality, we attempt to estimate s
1
, that is, the
clean speech signal from channel 1. The algorithm
has two correlation matrices as input, the
272
Sanches I. (2007).
MULTICHANNEL FILTER FOR ENHANCEMENT OF SPEECH BLOCKS.
In Proceedings of the Fourth International Conference on Informatics in Control, Automation and Robotics, pages 272-276
DOI: 10.5220/0001625202720276
Copyright
c
SciTePress

background noise correlation matrix R
N
and the
signal correlation matrix R
X
. The former is
computed with L
N
samples from each channel of the
microphone array when there is no speech activity.
Note that the bigger L
N
is, the more statistics from
noise are gathered at the cost of computational load
to estimate R
N
. The correlation matrix R
X
, for a
given filter order L, is computed from matrix X
defined as:
[]
N
XXXX "
21
= , (3)
where,
Ni
LxLLxLLx
Lxxx
Lxxx
SiSiSi
iii
iii
i
≤≤
⎥
⎥
⎥
⎥
⎦
⎤
⎢
⎢
⎢
⎢
⎣
⎡
+−+−
+
= 1,
)()2()1(
)1()3()2(
)()2()1(
"
#%##
"
"
X
(4)
Then, the correlation matrix R
X
, is computed
from:
1
.
+−
=
LL
S
T
X
XX
R , (5)
where X
T
is the transpose of X. Matrix R
N
is
computed in similar fashion with L
N
background
noise samples per channel, instead.
The optimal multi-dimensional Wiener filter,
W
WF
, can now be computed:
)(
1
NXXWF
RRRW −=
−
, (6)
as presented in (Florencio and Malvar, 2001), matrix
1−
X
R
above can be replaced by
1
)(
−
+
NX
RR
ρ
,
where
0≥
ρ
. Increasing
ρ
improves intelligibility at
a cost of increasing signal distortion.
The filtered signal matrix can then be computed
from
T
WF
XWY .= . (7)
It can be seen that matrix Y is (NL)×(L
S
-L+1).
Every L rows from Y correspond to a filtered
estimate of a specific channel from the array, and
they can be conveniently grouped to form an
improved filtered estimate from the specific channel.
Grouping L consecutive filtered signals is possible
when it is noticed that each one of the L rows is
shifted by just one sample from the next row.
Equation 8 presents the grouping process resulting in
the output filtered signal of length L
S
-L(N+1)+2
corresponding to the estimation of s
1
,
,2)1(1,
]][[
)(
1
1
++−≤≤
+−
=
∑
=
NLLn
L
niNLi
ny
S
L
i
Y
(8)
where Y[i][j] is the Y element on row i and column
j. Figure 1 illustrates the time relative positions
among frames and the length of the filtered signals
in Y and in y
1
compared to the original frame length.
The algorithm then proceeds taking the next L
S
input
samples per channel after an input shift of L
S
-
L(N+1)+2 samples.
Figure 1: Lengths of the original analysis frame, filtered
frame and grouped frame.
As an example, when applying the algorithm in a
speech recognition experiment, one may wish that
the length of the filtered vector y
1
be around 20ms at
a frame rate of 10ms. For that end, assuming
sampling frequency f
S
kHz, the following must be
satisfied:
2)1(20 ++
−
=
NLLf
SS
. (9)
To help with the definitions, one can further
assume the constraint that the filtered signal y
1
is
half of the original frame length L
S
, resulting an L
S
corresponding to 40ms. These assumptions and
constraints provide a way to determine the value of
L, the filter order:
⎟
⎠
⎞
⎜
⎝
⎛
+
+
=
1
220
N
f
L
S
round
. (10)
Thus, for instance, when N = 2 microphones and
f
S
= 8kHz, the filter order is L = 54, and L
S
= 320
samples.
More generally, equation 8 can be rewritten for
channel j, 1 ≤ j ≤ N:
.2)1(1
,
])1(][)1([
)(
1
++−≤≤
−−+−−+
=
∑
=
NLLn
L
LjniNLLji
ny
S
L
i
j
Y
(11)
L
S
L
S
- L+1
L
S
- L(N+1)+2
Original frame length
Filtered frame length (Y row)
Grouped frame length (y
1
)
MULTICHANNEL FILTER FOR ENHANCEMENT OF SPEECH BLOCKS
273
3 EXPERIMENTS
This section presents experimental results that show
the performance of the proposed algorithm on
simulated data as well as data acquired in real
conditions.
3.1 Simulated Data
This section presents the algorithm acting on
simulated signals in order to explore the algorithm
behaviour in respect to blocking effects and
independence on the array configuration, that is, it
will be shown that the algorithm does not require
that the signal be acquired from a perfectly
symmetric array. Two experiments will be presented
in this section.
The first experiment explores how the algorithm
deals with blocking effect. For that end, it was
simulated a 4-channel (4 microphones) signal
affected by omnidirectional noise at a signal to noise
ratio (SNR) of 0dB. Signals sampling frequency is
8kHz. Every channel has an initial period of noise
and then a 100Hz sine wave starts. Noise statistics
are obtained from the beginning 100ms of the signal
(no sine wave present). Sine waves from adjacent
channels are shifted by 30 degrees. Analysis frame
duration of the input signal is 40ms. Frame duration
of the output filtered signal is 20ms, thus blocking
effects would happen at this rate (every 2 cycles of
the sine wave). The affecting noise is a Gaussian
random noise uncorrelated among channels, which is
not a condition that happens on real applications,
where noise is correlated among channels (the next
experiment will show a condition where noise is
highly correlated among channels).
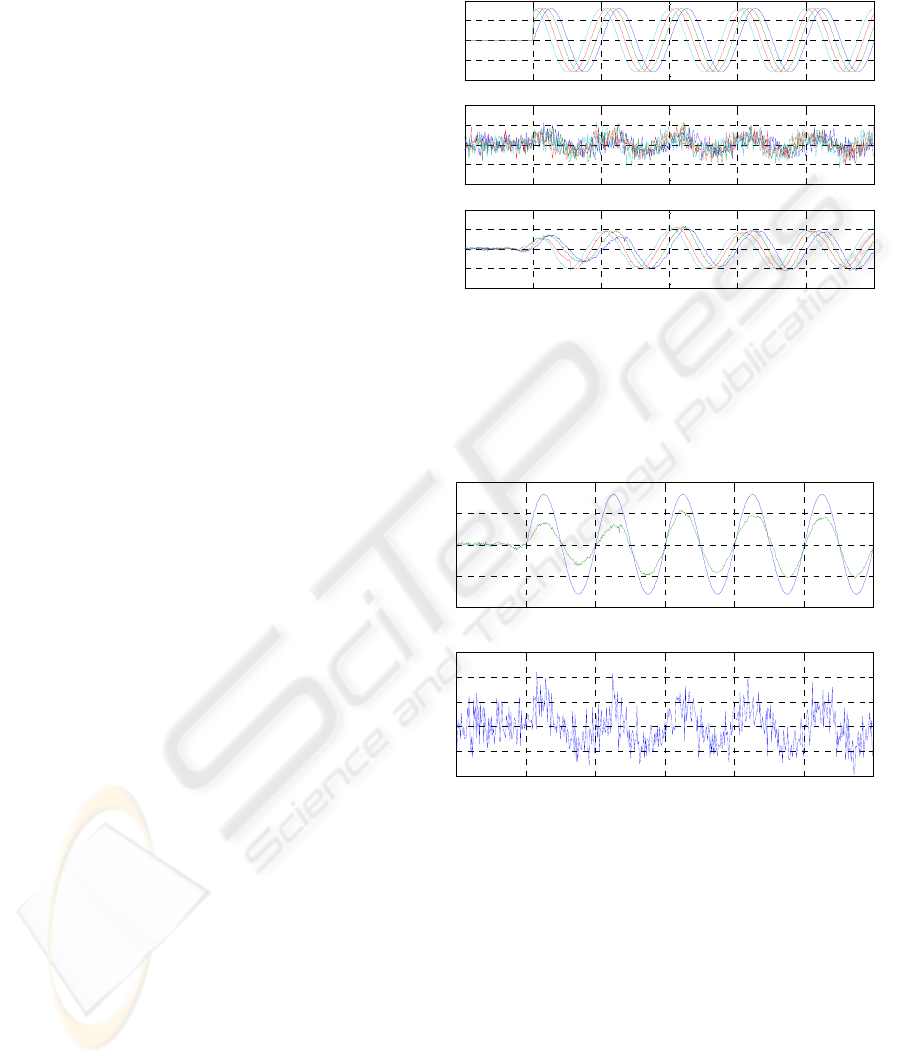
Figure 2 presents 60ms of the described signals.
There are three plots in this figure. The first plot
presents the clean signal. It can be seen that the sine
wave period is 10ms, corresponding to 100Hz. The
second plot shows the noisy signal, which is formed
from the addition of the clean 4-channel sine wave
signal to the 4-channel noise signal. The third plot
presents the filtered signal corresponding to every
channel of the array (see equation 11). The
discontinuities at 0.01s on the clean signal, first plot,
cause a transition region on the filtered signal, third
plot, of about 20ms, after which there is no visual
evidence of blocking effect, since the filtered signal
is fairly continuous. This was also confirmed
analyzing the remaining seconds of the filtered
signal. Figure 3 presents in more detail the results
for channel 1 only. The first plot compares directly
the input clean signal to the filtered signal. The
second plot presents channel 1 noisy signal, which is
one of the inputs to the algorithm.
Figure 2: Plot 1 presents a 4-channel 100Hz clean sine
wave signal. Every adjacent channel is shifted by 30
degrees. Plot 2 is the result of adding omnidirectional
Gaussian noise at 0dB SNR, producing the noisy signal
input to the algorithm. Plot 3 is the output filtered signal
corresponding to each input noisy channel.
Figure 3: Channel 1 extracted from figure 2. The first plot
compares channel 1 clean signal to the corresponding
filtered signal. The second plot presents the actual channel
1 input noisy signal.
The second experiment, illustrated in figure 4,
aims to observe the behaviour of the algorithm in an
eventual asymmetric array configuration. Producing
different phase shifts between adjacent channels
simulates this. In the example, the clean signal phase
shifts from channel 1 are 30, 90 and 180 degrees.
Likewise, the noise signal channels have different
phase shifts. From channel 1, the phase shifts on the
noise channels are –20, -50 and –90 degrees. As
before, the clean signal is composed of 100Hz sine
waves, while the noise signal is now formed with
0 0.01 0.02 0.03 0.04 0.05 0.06
-1
-0.5
0
0.5
1
x 10
4
Clean amplitude
0 0.01 0.02 0.03 0.04 0.05 0.06
-4
-2
0
2
4
x 10
4
Noisy amplitude
0 0.01 0.02 0.03 0.04 0.05 0.06
-1
-0.5
0
0.5
1
x 10
4
Filtered amplitude
Time, seconds
0 0.01 0.02 0.03 0.04 0.05 0.06
-1
-0.5
0
0.5
1
x 10
4
Clean and filtered signals, channel 1
Signal amplitude
0 0.01 0.02 0.03 0.04 0.05 0.06
-2
-1
0
1
2
3
x 10
4
Noisy signal, channel 1
Time, seconds
Signal amplitude
ICINCO 2007 - International Conference on Informatics in Control, Automation and Robotics
274
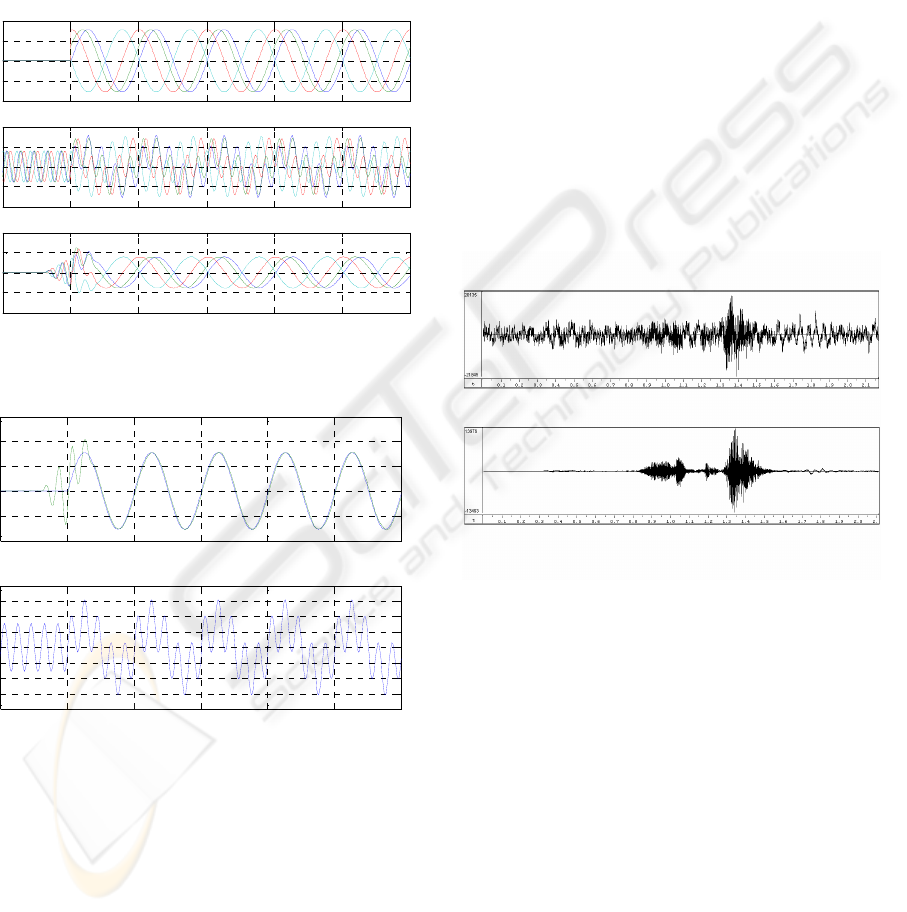
500Hz sine waves at 0dB SNR. It can be seen on
figure 4 third plot that the algorithm coped
conveniently with the different phase shifts imposed
on the clean and noise signals. It can be noticed that
the phase shift among input channels is preserved
among the output filtered channels. And, again, no
blocking effect can be detected. Figure 5 presents
with more detail channel 1 clean signal directly
compared to the filtered channel 1 (first plot) and the
input noisy signal (second plot).
Figure 4: Experiment to show the independence of the
algorithm to asymmetries on array configuration.
Figure 5: The first plot compares channel 1 clean signal to
the corresponding filtered signal from figure 4. Second
plot presents the actual channel 1 input noisy signal.
3.2 Real Data
The speech data used in this experiment was
acquired from a microphone array with four
omnidirectional microphones spaced by 15cm. The
signals were acquired at a sampling frequency of
48kHz. In this experiment the signals were
decimated to 16kHz. The speaker was about 1m
from the microphones. The environment was a room
in the speaker’s house. An engine background noise
can be heard when the corresponding audio file from
one of the channels is played. Figure 6 first plot
presents the signal from one channel of the
microphone array. The SNR at this channel is 4.3dB.
Figure 6 second plot shows the output from the
proposed algorithm. The SNR at the filtered signal is
32.3dB. Both SNR’s were computed by the NIST
signal to noise estimation utility (quick method; see
References section below). Note that the noise from
the first 300ms from the filtered signal is more
attenuated than the remaining of the noise portion,
since the first 400ms from the noisy input was used
to compute the noise correlation matrix, R
N
. Input
frames of 40ms (L
S
=640, L=64) were used to
compute the signal correlation matrix, R
X
, at every
20ms interval. Filtered output frames of 20ms (320
samples) were produced and concatenated. Listening
to this signal, it is realized that the engine
background noise was completely removed.
Figure 6: Experiment with real data. The first plot shows
one channel from the microphone array. The second plot
presents the corresponding algorithm output.
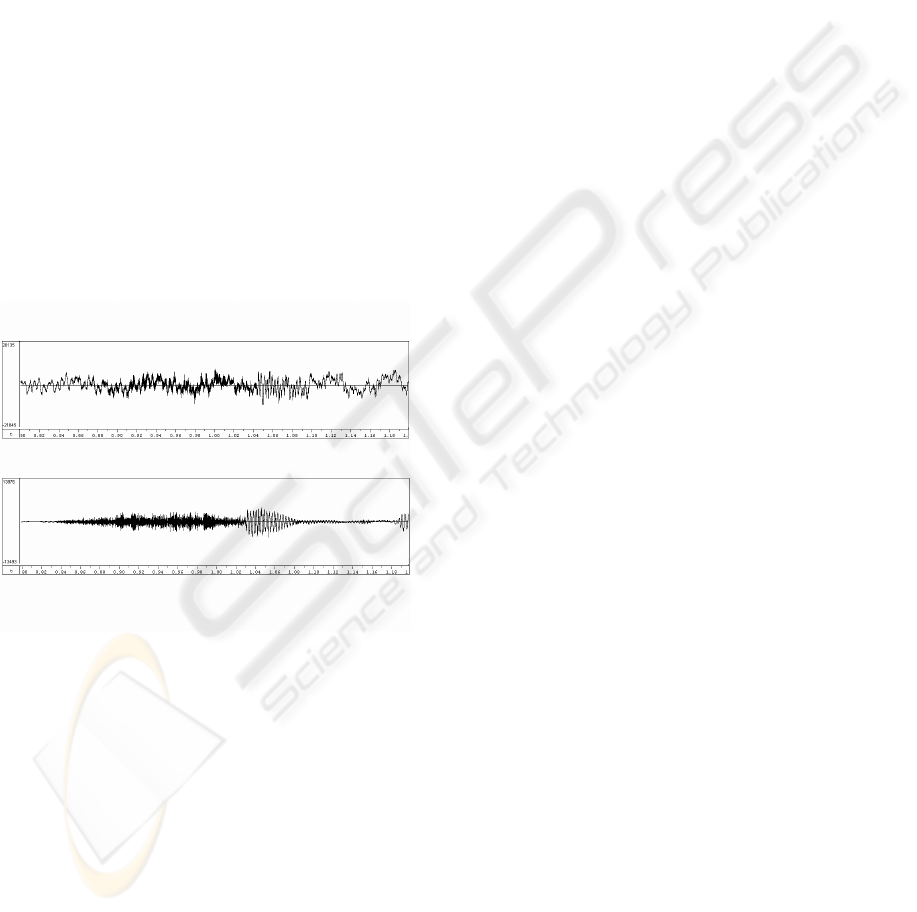
Figure 7 presents in more detail the time interval
from 0.8s to 1.2s. This interval corresponds to a
sound like ‘she’.
3 CONCLUSION
This work presented a successful algorithm based on
multi-dimensional Wiener filter, suitable to work
with microphone arrays of any physical
configuration. It was shown that, although the
algorithm works with blocks of signal, in order to
reduce computational load, blocking effects are not
perceptible. It is worth mentioning that from the
speech recognition point of view, coupling the
0 0.01 0.02 0.03 0. 04 0. 05 0.06
-2
-1
0
1
2
x 10
4
Clean amplitude
0 0.01 0.02 0.03 0. 04 0. 05 0.06
-4
-2
0
2
4
x 10
4
Nois y amplit ude
0 0.01 0.02 0.03 0. 04 0. 05 0.06
-4
-2
0
2
4
x 10
4
Filtered amplitude
Time, seconds
0 0.01 0.02 0.03 0.04 0.05 0. 06
-2
-1
0
1
2
3
x 10
4
Clean and filtered s ignals, channel 1
Signal amplitude
0 0.01 0.02 0.03 0.04 0.05 0. 06
-4
-3
-2
-1
0
1
2
3
4
x 10
4
Noisy signal , channel 1
Time, seconds
Signal amplitude
Time, seconds
MULTICHANNEL FILTER FOR ENHANCEMENT OF SPEECH BLOCKS
275
microphone array to the speech recognition front-
end, blocking effect is not an issue when it is
realized that the front-end works with blocks
(frames) of speech. If no optimizations are applied,
mainly in the solution of equations 5, 6 and 7,
algorithm computational complexity is high, about
(NL)
3
+(L
S
-L)(NL)
2
flops for each block of output
signal (e.g., 4.4Mflops for 20ms of filtered speech
with N = 2 microphones, f
S
= 8kHz, L = 54, and L
S
=
320 samples). Future efforts should be focused on
this issue, exploring matrices symmetries and
positive definiteness. As an example, the
computation of R
X
can go from about (L
S
-L)(NL)
2
to
about N(N+1)(L
S
L+3L
2
+5L) flops. The
independence on the array physical configuration
coupled with the computation of every channel best
estimate may be conveniently applied on speech
recognition tasks where microphones are spread in a
room environment, and the channel with the best
SNR is chosen as input to the speech recognition
process, extending speaker’s mobility. The next
steps will be to investigate the performance of the
algorithm on speech recognition experiments.
Figure 7: Excerpt from figure 6 signals, between 0.8s and
1.2s. This interval corresponds to a sound like ‘she’.
ACKNOWLEDGEMENTS
This work had the financial support from FUNTTEL
and FINEP, respectively the Fund for Technological
Development of Telecommunications, of the
Brazilian Ministry of Communications, and the
Fostering Agency of Studies and Projects, of the
Brazilian Ministry of Science and Technology,
under the contract 01.02.0066-00.
REFERENCES
Doclo, S. and Moonem, M. (2001). Microphone Arrays:
Signal Processing Techniques and Applications,
chapter GSVD-Based Optimal Filtering for Multi-
Microphone Speech Enhancement. Springer-Verlag,
Berlin.
Florencio, D., and Malvar, H. (2001). Multichannel
filtering for optimum noise reduction microphone
arrays. In Proc. ICASSP, volume 1, pages 197-200.
NIST, National Institute of Standards and Technology,
http://www.nist.gov/speech/tools/index.htm, accessed
January 10, 2007.
Spriet, A., Moonen, M., and Wouters, J. (2005).
Robustness analysis of multichannel Wiener filtering
and generalized sidelobe cancellation for
multimicrophone noise reduction in hearing aid
applications. In IEEE Trans. on Speech and Audio
Processing, volume 13, pages 487-503.
Time, seconds
ICINCO 2007 - International Conference on Informatics in Control, Automation and Robotics
276
