
A BROWSER EXTENSION
FOR PROVIDING VISUALLY IMPAIRED USERS
ACCESS TO THE CONTENT OF BAR CHARTS ON THE WEB
Stephanie Elzer, Edward Schwartz
Department of Computer Science, Millersville University, POB 1002, Millersville, PA 17551, USA
Sandra Carberry, Daniel Chester, Seniz Demir, Peng Wu
Department of Computer & Information Sciences, University of Delaware, 103 Smith Hall, Newark, DE 19716, USA
Keywords:
Accessibility, assistive technology, plan recognition, Bayesian networks, graph understanding.
Abstract:
This paper presents the SIGHT (Summarizing Information GrapHics Textually) system that enables visually
impaired users to gain access to information graphics that appear on a web page. The user interface is im-
plemented as a browser extension that is launched by a keystroke combination. The output of SIGHT is a
textual summary of the graphic, the core content of which is the hypothesized intended message of the graphic
designer. The textual summary of the graphic is then conveyed to the user by screen reading software (such as
JAWS). This approach has the benefits of 1) not requiring any action on the part of the web page developer, and
2) providing the user with the message and knowledge that one would gain from viewing the graphic rather
than requiring the user to form a mental map of the graphic.
1 INTRODUCTION
Information graphics (non-pictorial graphics, such as
bar charts, line graphs and pie charts) are an impor-
tant component of many documents. Unfortunately,
these visual presentations present serious informa-
tion access challenges for visually impaired users.
Documents on the Web can be accessed by visually
impaired users through screen reading software that
reads the information on a computer screen using syn-
thesized speech. If the developer of the web page has
supplied alternative text (or “alt text”) for graphics in
the html, most screen readers will read this text to the
user. However, the vast majority of web pages are
developed without broad accessibility in mind, and
alt text is not supplied, thus making the content of
the document’s graphics inaccessible to a visually im-
paired user.
It has been our observation that the majority of
information graphics that appear in formal reports,
newspapers, and magazines are intended to convey a
message or communicative intention. We conducted
a corpus study (Carberry et al., 2006) whose primary
goal was to determine the extent to which the mes-
sage conveyed by an information graphic in a multi-
modal document is also conveyed by the document’s
text. We analyzed 100 randomly selected graphics
from our collected corpus of information graphics,
along with the articles in which they appeared. The
selected articles were taken from magazines (such as
Newsweek, Business Week, Fortune, and Time) and
local and national newspapers. In 39% of the in-
stances, the text was judged to fully or mostly con-
vey the message of the information graphic. How-
ever, in 26% of the instances, the text conveyed only
a little of the graphic’s message. Most surprising was
the observation that in 35% of the instances in our
analyzed corpus, the text failed to convey any of the
message. These findings make it crucial that mech-
anisms be developed for providing visually impaired
individuals with alternative access to the content of
information graphics.
A number of projects have attempted to make im-
ages accessible to visually impaired viewers by repro-
ducing the image in an alternative medium, such as
sound (Meijer, 1992; Alty and Rigas, 1998), touch
(Ina, 1996) or a combination of the two (Ramloll
et al., 2000; Yu et al., 2002; Kennel, 1996). One par-
ticularly interesting project is that of Yu and Brew-
ster (Yu et al., 2002). In this project, they investigate
the development and usefulness of web-based mul-
timodal graphs which use haptic devices and audi-
59
Elzer S., Schwartz E., Carberry S., Chester D., Demir S. and Wu P. (2007).
A BROWSER EXTENSION FOR PROVIDING VISUALLY IMPAIRED USERS ACCESS TO THE CONTENT OF BAR CHARTS ON THE WEB.
In Proceedings of the Third International Conference on Web Information Systems and Technologies - Web Interfaces and Applications, pages 59-66
DOI: 10.5220/0001274600590066
Copyright
c
SciTePress
tory output to communicate the contents of the graphs
to the users. The web pages containing the graph-
ics must be properly formatted with the coordination
of embedded haptic and audio features controlled by
Cascading Style Sheets (Yu et al., 2002). Although
the evaluation of their system does demonstrate the
usefulness of the approach when compared to tradi-
tional tactile diagrams, they note that the process of
preparing the graphics is laborious (Yu et al., 2002).
Aside from the use of sound and touch, there is
some research by Kurze (Kurze, 1995) that generates
text in a presentation tool used to convey the content
of a graphic. In this system, a verbal description of
the diagram’s properties, such as the style of the dia-
gram, the number of data sets, the labels of axes and
the ranges of axes, is output through a text-to-speech
device (Kurze, 1995).
However, all of these approaches require the user
to build a “mental map” of the diagram – a task that is
very difficult for the congenitally blind because they
have no personal knowledge regarding the appearance
of information graphics (Kennel, 1996). In addition,
many of the other systems require 1) special equip-
ment or 2) preparation work (model creation) to be
done by a sighted individual. Consequently, existing
systems have not been successful in solving the acces-
sibility issue for visually impaired individuals. Thus
it is imperative that novel approaches be investigated.
Rather than providing alternative access to what
the graphic looks like or a listing of all of the data
points contained in the graphic, our SIGHT system
provides the user with the message and knowledge
that one would gain from viewing the graphic. We
hypothesize that the core message of an information
graphic (the primary overall message that the graphic
conveys) can serve as the basis for an effective tex-
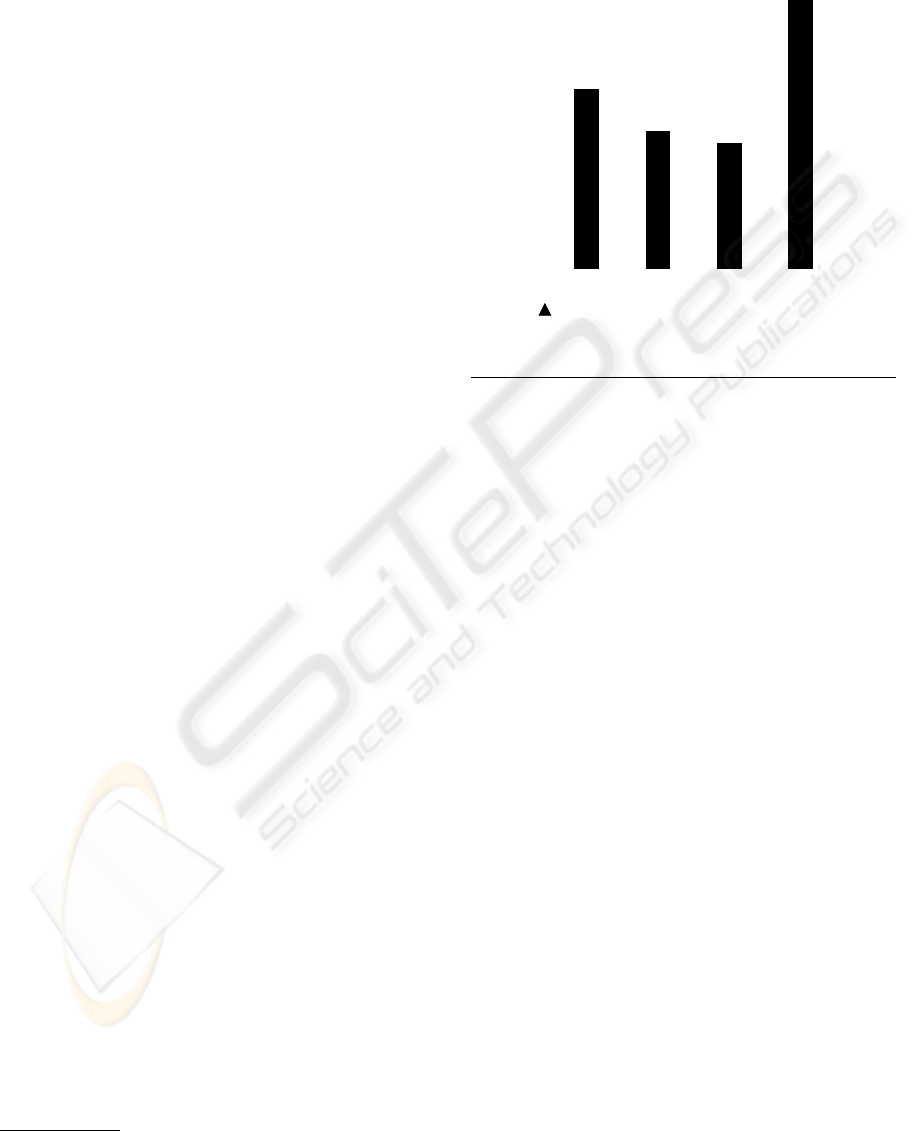
tual summary of the graphic. For example, given the
graphic in Figure 1, rather than simply presenting the
heights of the bars and their values, SIGHT infers
that the graphic’s intended message is that there is
an increase in Jan ’99 in the dollar value of 6-month
growth in consumer revolving credit in contrast with
the decreasing trend from July ’97 to July ’98 and
conveys this message to the user via speech. We even-
tually envision SIGHT as an interactive natural lan-
guage system that will provide a richer textual sum-
mary, with the inferred message as the core content,
and that can respond to follow-up questions from the
user or requests for justification of the system’s in-
ferred message.
The remainder of the paper presents our imple-
mented SIGHT system. First we present the browser
extension that we have constructed to enable visually
1
Graphic from BusinessWeek, April 5, 1999 issue.
6−MONTH GROWTH
IN CONSUMER
REVOLVING
CREDIT
CREDIT−CARD DEBT
LEAPS HIGHER
July ’97 Jan ’98 July ’98 Jan ’99
0
5
10
15
20
BILLIONS OF DOLLARS
25
Figure 1: Graphic with a Contrast Pt with Trend Message
1
.
impaired users to gain access to the information pro-
vided by information graphics that appear on a web
page. Next we outline how images are translated into
an XML representation of the graphic, and then we
present our overall methodology for inferring the in-
tended message of an information graphic. Note that
all of the examples presented in this paper have been
successfully run on the SIGHT system. We then con-
clude with a discussion of the future directions of our
work.
2 THE SIGHT SYSTEM
The architecture of our SIGHT system is shown in
Figure 2. The following subsections discuss the
various components with particular emphasis on the
browser extension which allows visually impaired
users to access textual summaries of information
graphics.
2.1 The Browser Extension
Because our target users are visually impaired, our
user interface cannot rely on any of the usual visual
mechanisms. Instead, the users must be able to launch
our application from the keyboard. We have imple-
mented our browser extension specifically for JAWS
7.10 (the most recently released version of JAWS)
and Internet Explorer (preferably version 6.0 or later).
JAWS, produced by Freedom Scientific, is the most
widely used screen reading software for Windows,
WEBIST 2007 - International Conference on Web Information Systems and Technologies
60
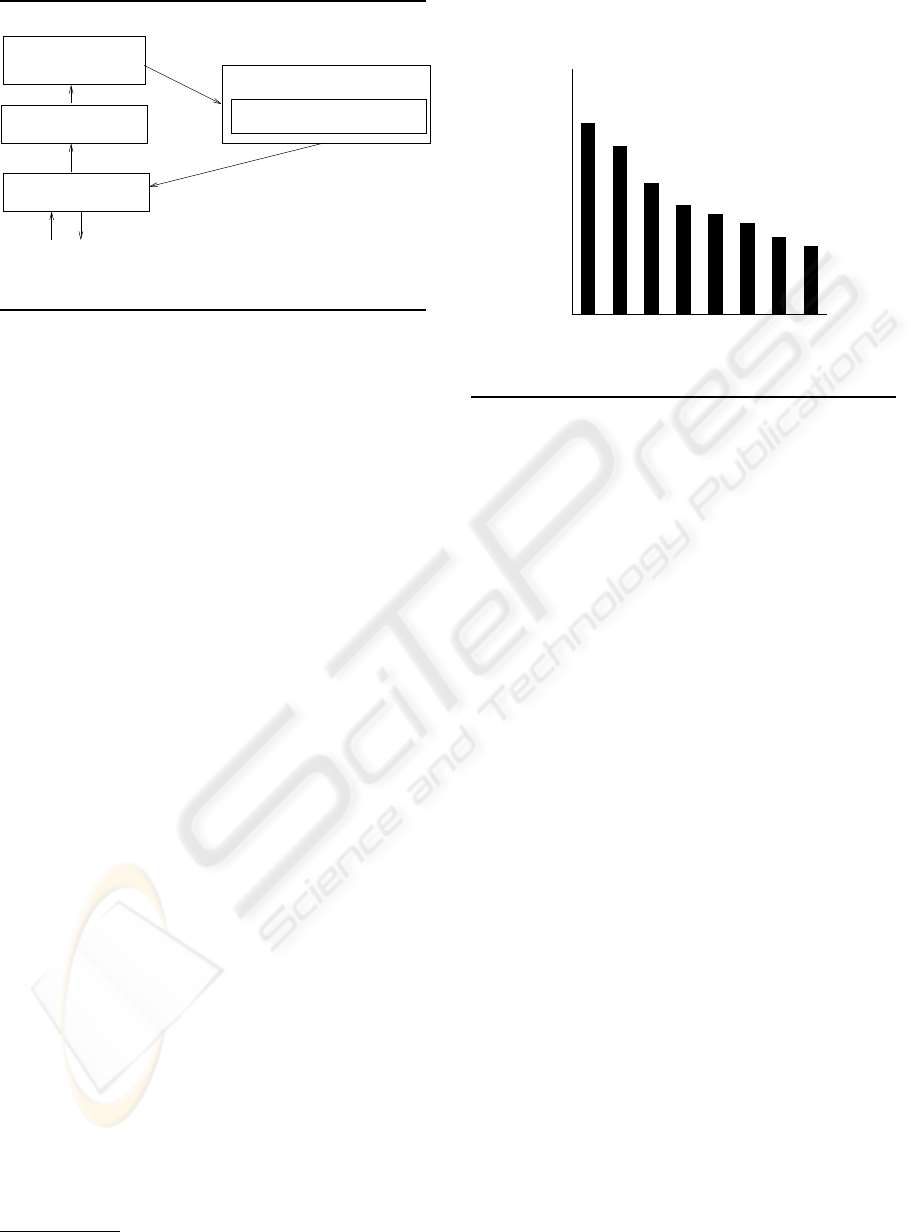
Analysis of Perceptual Task Effort
Intention Recognition Module
(IRM)
(APTE)
Visual Extraction Module
(VEM)
XML
XML
augmented
(CTM)
Caption Tagging Module
Preprocessing and
image file
textual summary
Browser Helper Object
(BHO)
web
page
window containing
textual summary
Figure 2: SIGHT System Architecture.
and JAWS users are encouraged to use Microsoft’s
Internet Explorer for web browsing, so this pair of
applications should be ideal for a large portion of our
target users. However, the concepts applied here are
extensible to other implementation platforms, as ex-
plained in Section 2.2.3.
When navigating a web page, JAWS users have
many options. When the web page is initially opened,
JAWS begins reading the content of the web page,
from top to bottom. The actual content that JAWS
reads is highly configurable by the user, but typically
includes any text on the page, the screen text per-
taining to links and buttons, and the alternative text
associated with graphics. So that we do not con-
flict with the existing navigation commands in JAWS,
we chose CONTROL+Z as the key combination for
launching our interface. If the user comes across a
bar chart during their navigation of a web page, they
can hit CONTROL+Z to launch our application and
receive a textual summary of the information con-
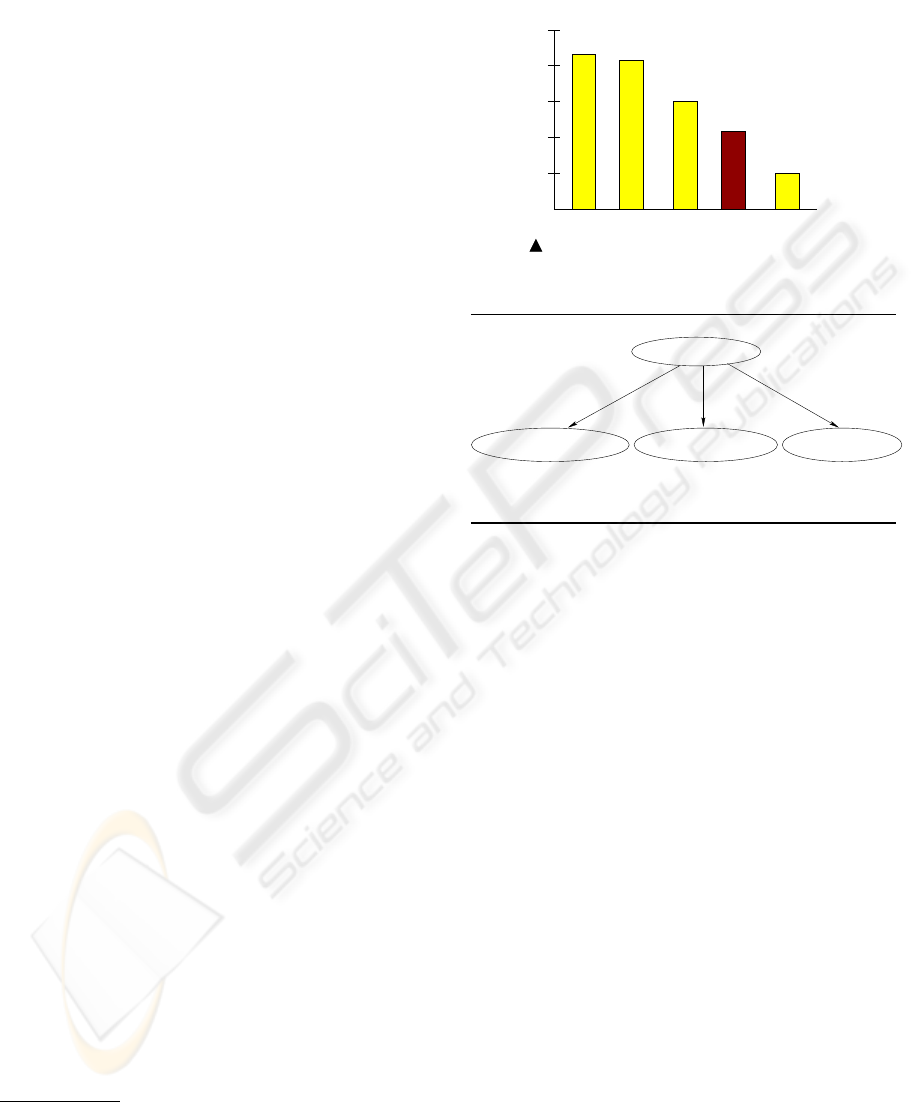
veyed by the bar chart. For example, if the user en-
countered the graphic shown in Figure 3, they could
hit CONTROL+Z and a new window containing the
summary of the graphic would appear. For this par-
ticular graphic, SIGHT produces the summary
This bar chart titled ’The notebook spiral’
shows that the dollar value of average laptop
prices fell from 2000 to 2003 and then falls
more slowly until 2007.
However, this type of interaction requires a very
tight coupling between our application and the web
browser, because our application needs to be able to
determine which graphic is currently in focus within
the web browser. We achieved the proper level of
integration by implementing our user interface as a
Browser Helper Object for Internet Explorer.
Browser Helper Objects are special add-on com-
ponents that enable the customization of Internet Ex-
2
Graphic from BusinessWeek, September 5, 2005.
’05 ’06 ’07’03 ’04’02’01’00
500
2500
2000
1500
1000
0
AVERAGE LAPTOP PRICES
DOLLARS
THE NOTEBOOK SPIRAL
Figure 3: Graphic with a Changing Trend Message
2
.
plorer (version 4.0 or later). BHOs are tied to the
main window of the browser and are created as soon
as a new browser window is created. BHOs are im-
plemented as in-process Component Object Model
(COM) components, and they run in the same process
space as the browser; this means that they can perform
virtually any action on the available windows and
modules. Our BHO hooks onto Internet Explorer’s
message loop and captures all of the keyboard events
within the browser, looking for the CONTROL+Z
combination. Upon detecting the CONTROL+Z com-
bination, the BHO queries the Document object of the
Internet Explorer instance to determine which object
is currently in focus within the browser. If the ob-
ject in focus appears to be a graphic containing a bar
chart, our system then attempts to infer the intended
message of the bar chart. The resultant textual sum-
mary is presented to the user in a new window. The
text in that new window is then read to the user by
JAWS, and the user can subsequently close the win-
dow using standard JAWS/Windows keystrokes (typ-
ically ALT+F4).
2.2 Implementation Issues
The procedure described above works well as long as
1) the object currently in focus in the browser is a bar
chart, and 2) the object in focus in the JAWS inter-
face is the same as the object in focus according to
the browser. This section addresses these issues.
2.2.1 Identifying Bar Charts
Since our BHO is operating within Internet Explorer,
and web pages contain many graphical elements that
are not bar charts, it is entirely possible that the user
A BROWSER EXTENSION FOR PROVIDING VISUALLY IMPAIRED USERS ACCESS TO THE CONTENT OF
BAR CHARTS ON THE WEB
61

may attempt to launch our system to process a graphic
that is not a bar chart. Therefore, when the CON-
TROL+Z keystroke is detected, the BHO runs a brief
image processing algorithm to determine whether the
selected graphic has particular attributes that identify
it as a possible bar chart, such as whether the graphic
has 20 or fewer gray levels, and whether the graphic
contains at least two rectangles with a common begin-
ning row or column. If the graphic does not appear
to be a bar chart, the message “The selected graphic
does not appear to be a bar chart,” is read to the user
by JAWS.
2.2.2 Focusing On Bar Charts
When browsing a web page in Internet Explorer,
JAWS users have the option of “tabbing” through the
content of the page. By repeatedly hitting the tab but-
ton, JAWS will traverse the elements on the page ac-
cording to the browser’s default tab order for that page
or the tab order specified in the html code. When the
user is traversing a web page in JAWS using the tab
keys, the focus in Internet Explorer is updated along
with JAWS’ focus. For graphics that are in the tab
order, JAWS will read the alt text (if any) associ-
ated with the graphic when the user traverses to the
graphic. If the user hits CONTROL+Z when JAWS
reaches the graphic, our BHO will be activated.
However, many graphics are not included in the
tab order of the page, since there is typically not an ac-
tion associated with them (such as a link to follow or
a text box to fill in). To address this issue, when a web
page is opened in Internet Explorer, our BHO per-
forms a scan of all of the graphics on that page, per-
forming the bar chart detection logic described pre-
viously. If an image appears to be a bar chart, our
BHO will insert that graphic into the tab order of the
page, and will append “This graphic appears to be a
bar chart” to the alt text (if any). This pre-processing
of the web page ensures that the user will not acci-
dentally overlook bar charts that could be processed
by our system while traversing the page.
When a web page is opened in Internet Explorer
while JAWS is running, JAWS automatically begins
reading the content of the page from top to bottom
(this is sometimes called “say all” mode). It is gen-
erally more convenient for JAWS users to utilize the
“say all” mode rather than tabbing through the content
of the page. If the BHO’s pre-processing has detected
a potential bar chart, the user will be alerted to its
presence by JAWS reading the alt text, “This graphic
appears to be a bar chart,” that was inserted into the
document by our BHO. Unfortunately, while in the
“say all” mode, the focus in JAWS is not reflected
in Internet Explorer. This obviously poses a problem
since our BHO relies on the Document object in Inter-
net Explorer to identify the graphic in which the user
is interested. Fortunately, the latest release of JAWS
allows the user to set the application focus to the lo-
cation of the JAWS virtual cursor by entering CON-
TROL+INSERT+DELETE. After entering this while
JAWS’ virtual cursor has the graphic containing a bar
chart in focus, the user may then enter CONTROL+Z
to hear the summary of the bar chart.
2.2.3 Extensibility of the Browser Extension
While the current version of the user interface has
been designed specifically with JAWS and Internet
Explorer in mind, we expect similar solutions to work
for other applications. For example, extensions sim-
ilar to BHOs can be developed for Mozilla’s Firefox
browser using the Cross Platform Component Object
Model (XPCOM). Regarding the use of screen read-
ers other than JAWS, our BHO in Internet Explorer
will work with any screen reader; it is simply a mat-
ter of investigating how the focus of Internet Explorer
and the screen reading software interact and of ensur-
ing that the keystroke combination does not conflict
with existing screen reader functionality. For visually
impaired users who primarily use a screen magnifier
(such as ZoomText), rather than a screen reader, the
text produced by our BHO can be handled in the same
manner as text in any other application.
2.3 Processing the Image
Once the browser component of the SIGHT system
has detected that the user would like to access a partic-
ular graphic, it sends the image to the Visual Extrac-
tion Module. VEM is responsible for analyzing the
graphic’s image file and producing an XML represen-
tation containing information about the components
of the information graphic including the graphic type
(bar chart, pie chart, etc.) and the textual pieces of the
graphic (such as its caption). For a bar chart, the rep-
resentation includes the number of bars in the graph,
the labels of the axes, and information for each bar
such as the label, the height of the bar, the color of the
bar, and so forth (Chester and Elzer, 2005). This mod-
ule currently handles only electronic images produced
with a given set of fonts and no overlapping charac-
ters. In addition, the VEM currently assumes standard
placement of labels and axis headings. Work is under-
way to remove these restrictions. But even with these
restrictions removed, the VEM can assume that it is
dealing with a simple bar chart, and thus the problem
of recognizing the entities in a graphic is much more
constrained than typical computer vision problems.
WEBIST 2007 - International Conference on Web Information Systems and Technologies
62

The XML representation is then passed to the Pre-
processing and Caption Tagging Module (CTM). The
preprocessing augments the xml with salience infor-
mation such as a bar that is colored differently from
other bars in the graphic or a bar that has an anno-
tation when the other bars do not. The caption tag-
ging extracts information from the caption (discussed
later) and then passes the augmented XML repre-
sentation to the intention recognition module (IRM),
which is described in the next section.
2.4 Irm: A Bayesian Inference System
The IRM is responsible for recognizing the intended
message of the information graphic, which we hy-
pothesize can serve as the basis for an effective sum-
mary of the graphic. While the browser extension will
work for any type of information graphic, the scope
of the work currently implemented for the image pro-
cessing and IRM components is limited to the pro-
cessing of simple bar charts. By simple bar charts, we
mean bar charts that display the values of a single in-
dependent attribute and the corresponding values for a
single dependent attribute. Although our system cur-
rently handles only simple bar charts, we believe that
our methodology is broadly applicable and extensible
to other types of graphics.
2.4.1 Communicative Signals
We view information graphics that appear in popular
media as a form of language with a communicative
intention. The IRM reasons about the communica-
tive signals present in a graphic in order to identify
its intended message. We have identified three kinds
of communicative signals that appear in simple bar
charts.
Our first communicative signal is the relative ef-
fort required for different perceptual and cognitive
tasks.
3
Here we are extending a hypothesis of the Au-
toBrief group (Kerpedjiev and Roth, 2000). The Au-
toBrief project was concerned with generating infor-
mation graphics, and they hypothesized that a graphic
designer chooses a design that best facilitates the per-
ceptual and cognitive tasks that a viewer will need to
perform on the graphic. Thus given a graphic, our hy-
pothesis is that the relative difficulty of different per-
ceptual tasks serves as a signal about which tasks the
3
By perceptual tasks(Kerpedjiev and Roth, 2000) we
mean tasks that are performed by viewing the graphic, such
as comparing the heights of two bars; by cognitive tasks, we
mean tasks that require a mental computation such as inter-
polating between two labelled values on the dependent axis
in order to determine the value represented by a bar whose
top is not aligned with a labelled value.
viewer was expected to perform in deciphering the
graphic’s message. This correlates with Larkin and
Simon’s (Larkin and Simon, 1987) observation that
graphics that are informationally equivalent are not
necessarily computationally equivalent — for exam-
ple, if a set of bars are arranged in order of increasing
height, then it will be much easier to identify the rank
of an individual bar than if the bars were arranged in
alphabetical order of their label.
To rank tasks in terms of effort, we constructed a
set of effort estimation rules. Each rule represents a
task that can be performed on a graphic and is com-
prised of a set of condition-computation pairs: each
condition captures possible features of the graphic
(such as whether the top of a bar is aligned with a la-
belled tick mark on the dependent axis), and the com-
putation captures the effort required for the task given
that set of graphic features. The effort computations
are based on work by cognitive psychologists, and our
effort estimation rules have been validated via a set of
eye-tracking experiments (Elzer et al., 2006).
A second communicative signal is the salience of
entities in the graphic. Our system recognizes a num-
ber of ways in which an entity in a bar chart becomes
salient. These include coloring or annotating a bar
differently from the other bars in a bar chart (as is the
case for the bar labelled CBS in Figure 4), since these
design strategies draw attention to the bar. It also in-
cludes mentioning a bar’s label in the caption, since
this also draws attention to the bar. The preprocessor
and caption tagging module are responsible for identi-
fying salient entities in the graphic. The preprocessor
analyzes the XML representation of the graphic and
augments it to indicate entities that are salient due to
graphic design decisions. The Caption Tagging Mod-
ule uses a part-of-speech tagger to identify nouns in
the caption, and then it augments the XML represen-
tation to indicate any bars that match a noun in the
caption.
A third communicative signal is the presence of
certain verbs and adjectives in a caption. In (Elzer
et al., 2005a) we present a corpus study showing that
(1) captions are often very general or uninformative,
and (2) even when captions convey something about
the graphic’s intended message, the caption is often
ill-formed or requires extensive analogical reasoning.
Thus we have chosen to perform a shallow analysis of
captions that extracts communicative signals but does
not attempt to understand the caption. For example,
the verb lag in the caption “American Express’ to-
tal billings still lag” suggests a message about an en-
tity’s rank with respect to some measure. Similarly,
we found that nouns derived from verbs, such as rise
in the caption “Cable on the Rise”, and adjectives
A BROWSER EXTENSION FOR PROVIDING VISUALLY IMPAIRED USERS ACCESS TO THE CONTENT OF
BAR CHARTS ON THE WEB
63
also suggest the general category of message. Using
WordNet and a thesaurus, we identified verbs and ad-
jectives that were similar in meaning and might sig-
nal one or more categories of message and organized
them into verb classes. The Caption Tagging Mod-
ule uses a part-of-speech tagger and a stemmer to an-
alyze captions and extract nouns, adjectives, and the
root form of verbs, adjectives, and nouns derived from
verbs, and further augments the XML representation
of the graphic to indicate the presence of one of our
identified verb or adjective classes in the caption.
2.4.2 Reasoning About the Graphic’s Intention
Having developed a means of extracting the evidence
provided by the communicative signals in a graphic,
we need to use this evidence in reasoning about the
intended message of an information graphic. For this
purpose, we dynamically construct a Bayesian net-
work for each new information graphic. The top level
of the network captures the various categories of mes-
sages that can be conveyed by a bar chart, such as con-
veying a change in trend (Change-Trend), conveying
the rank of an entity in a bar chart (Get-Rank), com-
paring two entities (Relative-Difference), etc. Below
each category of message are nodes that capture the
different possible instantiations of that message cate-
gory. For example, if a graphic has five bars as in Fig-
ure 4, then the children of the Get-Rank node would
be Get-Rank(BAR1,LABEL1), . . ., Get-Rank(BAR5,
LABEL5).
We use plan operators to specify how a graphic de-
signer’s communicative goal can be achieved via the
viewer performing certain perceptual and cognitive
tasks. For example, consider the goal of the viewer
getting the rank of a bar, given that the bar is salient,
as in Figure 4. The operator for achieving this goal
decomposes the goal into three subgoals: perceiving
whether the bars are sorted in order of height, per-
ceiving (ie., finding) the label associated with the bar,
and perceiving the rank of that bar with respect to bar
height. Each subgoal in an operator is either a prim-
itive with an associated effort rule or has an operator
that decomposes it into a set of simpler subgoals. The
operators determine the structure of our Bayesian net-
work, in that subgoals in an operator become children
of their goal node in the Bayesian network. For exam-
ple, Figure 5 displays the piece of the Bayesian net-
work produced by the Get-Rank operator. The entire
network is built dynamically for a new graphic.
4
Graphic from BusinessWeek, April 5, 1999. Note that
in its original form, the graph was not a simple bar chart,
because there was a secondary value (average age of values)
also displayed on the bars, so it has been adapted to display
only a single dependent value.
0
40
80
120
160
200
Average Price of Ad
WBFOXABC
NBC
Advertisers Pay
More for Youth
THOUSANDS OF DOLLARS
CBS
Figure 4: Graphic with a Get-Rank Message
4
.
Perceive−rank(_bar)Perceive−if−bars−are−sorted
Get−Rank(_bar,_label)
Perceive−label(_bar,_label)
Figure 5: A Piece of Network Structure.
Evidence nodes must be added to the Bayesian
network to reflect the evidence provided by the infor-
mation graphic about its intended message. Evidence
nodes reflecting the amount of effort required for a
perceptual task (categorized as low, medium, high,
or impossible) and evidence nodes reflecting whether
a parameter of a perceptual task is salient (via high-
lighting, annotating it, etc.) are attached to percep-
tual task nodes. For example, consider the graphic in
Figure 4, the piece of network structure shown in Fig-
ure 5, and the evidence nodes that would be attached
to the instantiated perceptual task node Perceive-
rank(BAR4). The effort evidence node would indi-
cate that little effort is required for this task since the
bars are sorted according to height. The highlighting
evidence node would indicate that the instantiated pa-
rameter BAR4 is highlighted in the graphic. The an-
notation and noun-in-caption evidence nodes would
indicate respectively that no bars have special anno-
tations and that none of the bar labels are part of the
graphic’s caption. Evidence nodes reflecting the pres-
ence of one of our verb or adjective classes in the cap-
tion provide evidence for a general category of mes-
sage and thus are attached to the top level node in the
network.
Associated with each child node in a Bayesian
network is a conditional probability table that gives
the conditional probability for each value of the child
node given the value of the parent node. In our
WEBIST 2007 - International Conference on Web Information Systems and Technologies
64

Bayesian network, the value of the parent node is ei-
ther that it is or is not part of the plan that the graphic
designer has for the viewer to deduce the graphic’s
message. The conditional probability tables for net-
work nodes are learned from our corpus of graphics.
Once the network with its evidence nodes is built,
the probabilities propagate through the network to hy-
pothesize the intended message of the graphic. For
the graphic in Figure 4, SIGHT infers that the graphic
is conveying the rank of CBS and produces the nat-
ural language “This bar chart titled ‘Advertisers pay
more for youth’ shows that CBS has the second lowest
rank in terms of the dollar value of average price of
Ad compared with NBC, ABC, FOX, and WB.”
5
.
2.4.3 Evaluation
The performance of the message inference within our
SIGHT system has been evaluated in two ways. First,
using a corpus of 110 simple bar charts that had pre-
viously been annotated with their primary message by
two human coders, we evaluated our approach using
leave-one-out cross validation in which each graphic
is selected once as the test graphic, and the other 109
graphics are used to compute the conditional proba-
bility tables for the Bayesian network. We viewed
the system as successful in recognizing the graphic’s
message if its top-rated hypothesis matched the mes-
sage assigned by the coders and the system-assigned
probability for the hypothesis exceeded 50%. The
system’s overall success rate, 79.1%, is the average
of the results of all 110 experiments.
We also performed a qualitative evaluation in or-
der to determine whether the intentions being inferred
by our system would meet the approval of users. Sev-
enteen human subjects rated a posited message for
each of 27 bar charts. In 20 of the 27 cases, the
posited message matched the message inferred by our
system. Subjects rated the messages from 0 (strongly
disagree) to 4 (strongly agree). For the 20 messages
matching the system’s output, the rating was 3.33
with a standard deviation of 1.02 and a 95% confi-
dence interval of .108, whereas for the 7 messages
that differed from the system’s output, the rating was
only 1.19 with a standard deviation of 1.46 and a 95%
confidence interval of .261.
From these evaluations, we conclude that our sys-
tem has a high degree of success at recognizing the
primary message of a simple bar chart, and that using
the recognized message as the basis for a graphic’s
summary should produce summaries that would be
satisfactory to a majority of users.
5
For further detail on the Bayesian network, see (Elzer
et al., 2005b)
2.5 Generating the Summary
Once the intended message has been inferred by our
Bayesian inference system, it is used as the core con-
tent of a textual summary of the graphic. One of the
most challenging aspects of generating coherent nat-
ural language has been determining the full label for
the measurement (or value) axis. In examining our
corpus of bar charts, taken from a variety of maga-
zines and newspapers, we have found that the mea-
surement axis label might be very abbreviated and
that full rendering of the label often requires extrac-
tion of words from text within the graphic (such as
AVERAGE LAPTOP PRICES in Figure 3) or from the
caption and/or second-tier descriptive text below the
caption. We have constructed a set of heuristics for
ranking the graphic’s components in terms of where
to look for the measurement axis label and how to
extract it from these textual pieces. Other heuristics
augment the wording of the label. For example, one
heuristic states that if the graphic’s text contains a sin-
gle proper noun that does not match the label of a
bar, then the measurement axis label should gener-
ally be preceded with that proper noun in possessive
case. Consider, for example, the graphic in Figure 6.
Here the measurement axis is labelled as Percentage
of unauthorized workers and the unit of measurement
is also captured by the % sign after the annotated val-
ues, but “Percentage of unauthorized workers” must
be preceded with the proper noun “United States” in
order to fully describe what is being measured. The
natural language generation component of our sys-
tem (to be presented in a separate paper) uses a set
of heuristics to generate a complete rendering of the
measurement axis label, which is then used in tem-
plates to generate the appropriate wording for the par-
ticular category of inferred message. For example,
SIGHT hypothesizes that the graphic in Figure 6 is
conveying a Rank-of-all message and generates the
textual summary “This bar chart titled ’Workers with-
out papers’ compares the entities Farming, Cleaning,
Construction, and Food preparation with respect to
United States’s percentage of unauthorized workers.”
3 CONCLUSION
SIGHT has been implemented and tested for simple
bar charts. We eventually envision SIGHT as an in-
teractive natural language system which infers the in-
tended message of an information graphic, provides
a summary that includes the intended message along
with notable features of the graphic, and then re-
sponds to follow-up questions from the user. These
A BROWSER EXTENSION FOR PROVIDING VISUALLY IMPAIRED USERS ACCESS TO THE CONTENT OF
BAR CHARTS ON THE WEB
65
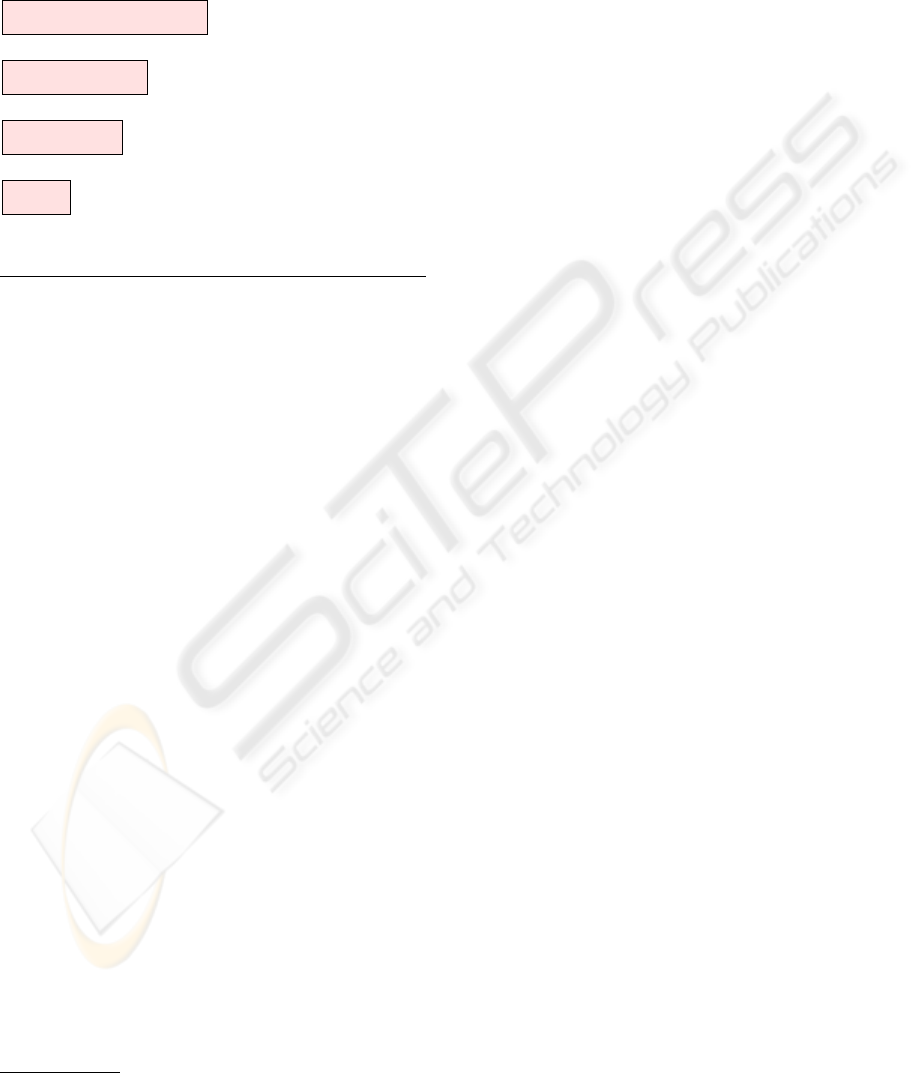
Percentage of
unauthorized workers
24%
Farming
Cleaning
Construction
Food preparation
17%
14%
12%
Workers without papers
Industries that require manual labor
and little formal education draw heavily on illegal immigrants’ labor.
About 5% of workers in the United
States are illegal immigrants.
Figure 6: Graphic with a Rank of All Message
6
.
additional features would obviously make for a richer
and more robust user interface. We are also working
to make the image processing in VEM more robust,
and to extend the SIGHT system to other kinds of in-
formation graphics such as line graphs and pie charts,
and to complex graphics, such as grouped bar charts.
Information graphics are an important part of
many documents available on the world-wide web,
yet they are largely inaccessible to visually impaired
users. This paper has presented a novel implemented
interface that enables visually impaired users to gain
access to the information provided by simple bar
charts that appear on a web page. Our approach of
presenting the message conveyed by the information
graphic, rather than rendering the graphic in a differ-
ent medium, has significant advantages — it provides
the user with easy access to the communicative intent
of the graphic, and does not require specialized hard-
ware or for the user to construct a mental map of the
graphic. Moreover, our system does not require any
action on the part of the web page developer.
REFERENCES
Alty, J. L. and Rigas, D. (1998). Communicating graphical
information to blind users using music: The role of
context. In Proc. of CHI-98, Human Factors in Com-
puter Systems, p. 574–581, Los Angeles. ACM Press.
Carberry, S., Elzer, S., and Demir, S. (2006). Information
graphics: An untapped resource for digital libraries.
In Proc. of SIGIR 2006, Seattle, WA.
6
Graphic from USA Today, July 11, 2006 issue.
Chester, D. and Elzer, S. (2005). Getting computers to see
information graphics so users do not have to. In Proc.
of the 15th Int’l Symposium on Methodologies for In-
telligent Systems, LNAI 3488, p. 660–668. Springer-
Verlag.
Elzer, S., Carberry, S., Chester, D., Demir, S., Green, N.,
Zukerman, I., and Trnka, K. (2005a). Exploring and
exploiting the limited utility of captions in recognizing
intention in information graphics. In Proc. of the 43rd
Annual Meeting of the ACL, p. 223–230.
Elzer, S., Carberry, S., Zukerman, I., Chester, D., Green,
N., and Demir, S. (2005b). A probabilistic framework
for recognizing intention in information graphics. In
Proc. of IJCAI, p. 1042–1047.
Elzer, S., Green, N., Carberry, S., and Hoffman, J. (2006).
A model of perceptual task effort for bar charts and
its role in recognizing intention. User Modeling and
User-Adapted Interaction, 16(1):1–30.
Ina, S. (1996). Computer graphics for the blind. ACM SIG-
CAPH Computers and the Physically Handicapped,
55:16–23.
Kennel, A. R. (1996). Audiograf: A diagram-reader for the
blind. In Second Annual ACM Conference on Assistive
Technologies, p. 51–56.
Kerpedjiev, S. and Roth, S. (2000). Mapping communica-
tive goals into conceptual tasks to generate graphics
in discourse. In Proc. of the Int’l Conf. on Intelligent
User Interfaces, p. 60–67.
Kurze, M. (1995). Giving blind people access to graph-
ics (example: Business graphics). In Proc. Software-
Ergonomie ’95 Workshop Nicht-visuelle graphische
Benutzungsoberflchen, Darmstadt, Germany.
Larkin, J. and Simon, H. (1987). Why a diagram is (some-
times) worth ten thousand words. Cognitive Science,
11:65–99.
Meijer, P. B. (1992). An experimental system for auditory
image representations. IEEE Transactions on Biomed-
ical Engineering, 39(2):112–121.
Ramloll, R., Yu, W., Brewster, S., Riedel, B., Murton, M.,
and Dimigen, G. (2000). Constructing sonified haptic
line graphs for the blind student: First steps. In Proc.
of ASSETS 2000, p. 17–25, Arlington, VA.
Yu, W., Reid, D., and Brewster, S. (2002). Web-based mul-
timodal graphs for visually impaired people. In Proc.
of the 1st Cambridge Workshop on Universal Access
and Assistive Techn., p. 97–108.
WEBIST 2007 - International Conference on Web Information Systems and Technologies
66
