
A MULTIMODAL INTERFACE FOR PERSONALISING SPATIAL
DATA IN MOBILE GIS
Julie Doyle, Joe Weakliam, Michela Bertolotto
School of Computer Science and Informatics
University College Dublin,
Belfield,Dublin 4, Ireland
David Wilson
Department of Software and Information Systems
University of North Carolina at Charlotte, 9201 University City Blvd, Charlotte, NC 28223, USA
Keywords:
Multimodal interaction, GIS, mobile, spatial personalisation.
Abstract:
Recently the availability and usage of more advanced mobile devices has significantly increased, with many
users accessing information and applications while on the go. However, for users to truly accept and adopt such
technologies it is necessary to address human-computer interaction challenges associated with such devices.
We are interested in exploring these issues within the context of mobile GIS applications. Current mobile
GIS interfaces suffer from two major problems: interface complexity and information overload. We have
developed a novel system that addresses both of these issues. Firstly, our system allows GIS users to interact
multimodally, providing them with the flexibility of choosing their preferred mode of interaction for specific
tasks in specific contexts. Secondly, it records all such interactions, analyses them and uses them to build
individual user profiles. Based on these, our system returns personalised spatial data to users, and hence
eliminates superfluous information that might be otherwise presented to them. In this paper we describe the
system we have developed that combines multimodal interaction with personalised services, and that can be
used by mobile users, whether they are novices or professionals within the field of GIS. The advantages of our
multimodal GIS interface approach are demonstrated through a user interaction study.
1 INTRODUCTION
Comparatively little research has been conducted into
designing interfaces that allow mobile Geographic In-
formation Systems (GIS) users to interact effectively
and efficiently with geospatial data. GIS applications
were initially developed for expert users to perform
complex calculations and queries. Therefore, many
GIS interfaces are inherently complex and require do-
main specific knowledge for such tasks (Blaser et al.,
2000). However GIS tools are being used in increas-
ingly more diverse application domains. Hence inter-
faces for GIS need to be user-friendly and intuitive.
Research has shown that multimodal interfaces
can significantly reduce the complexity of GIS in-
terfaces (Fuhrmann et al., 2005), (Oviatt, 1996).
The growing interest in multimodal interfaces is in-
spired by the goals of supporting more transparent,
flexible, efficient and powerfully expressive means
of human-computer interaction. Much research in
the area of multimodal interfaces focuses on speech
and pen/gesture recognition (Rauschert et al., 2002a),
(Rugelbak and Hamnes, 2003). Indeed, speech input
is a natural form of interaction for humans.
There are many well-documented advantages to de-
signing a multimodal interface to a GIS, particularly
a mobile GIS. Providing multiple modes of input for
human-computer interaction makes applications ac-
cessible to a wider variety of users. For example, non-
expert users can choose to interact using the technique
they find most intuitive; users with a speech impedi-
ment or strong accent can interact using the pen; users
with a broken arm can use speech input.
Multimodal interaction allows users to exercise se-
lection and control over how they interact (Oviatt and
Cohen, 2000). This is particularly beneficial in field
GIS where a user’s context is constantly changing.
Users profit from the ability to switch between differ-
ent interaction modes, depending on which best suits
their current situation. For example, speech may of-
ten not be feasible or appropriate in certain situations
such as a noisy environment or for a tourist in a mu-
seum. In such circumstances the pen might be a more
suitable input mode. One of the most important ad-
vantages of multimodal systems is that they improve
the performance and robustness of human-computer
interaction with such systems (Oviatt, 1999). If both
speech and pen provide parallel functionality, error
71
Doyle J., Weakliam J., Bertolotto M. and Wilson D. (2006).
A MULTIMODAL INTERFACE FOR PERSONALISING SPATIAL DATA IN MOBILE GIS.
In Proceedings of the Eighth International Conference on Enter prise Information Systems - HCI, pages 71-78
DOI: 10.5220/0002454200710078
Copyright
c
SciTePress

correction is more efficient as one mode can be used
to correct errors made by the other. If a partic-
ular word is mis-interpreted, for example, the pen
can be used to undo the action associated with the
voice command, and to perform the action again.
Finally, multimodal interaction increases the overall
efficiency and usability of mobile GIS applications,
with many studies showing increased speeds and user
preference whilst interacting multimodally, compared
to unimodally. Some of these studies are presented in
the related work section.
Besides the complexity of querying and interact-
ing, the sheer volume of data returned to users in
current GISs is a major factor of interface complex-
ity as users must sift through large amounts of spa-
tial data that often bears no relation to their current
task. Moreover, on mobile devices superfluous spa-
tial data can significantly clutter the interface mak-
ing navigation and interaction substantially more dif-
ficult. Personalisation is a concept common in both
Web-based and mobile applications and is used when
tailoring specific information to users based on their
individual requirements. In the design of interfaces
for desktop and wireless applications, employing per-
sonalisation assists the developer in addressing the
issues of interface complexity and information over-
load. Personalisation in existing GIS, however, typ-
ically deals with the recommendation of non-spatial
content within some sort of a tourist setting (Zipf,
2002). This includes, for example, presenting clients
with information related to suitable restaurants, ad-
equate hotels, or museum opening hours, where all
recommendations are based on preference detail gath-
ered either directly or indirectly from the user. There
is a notable absence of GIS that present users with
personalised map feature content. In many appli-
cations (both professional and non-professional) this
would be very useful. An example might be where a
structural engineer requires road infrastructure infor-
mation so as to locate areas for building levees.
Personalising spatial map content allows the tailor-
ing of maps containing specific feature information
to enable users to realize personal tasks quicker and
more efficiently. It also assists the development of
interfaces whereby developers need not worry about
interface complexity and information density due to
the reduction in the amount of content delivered and
the style with which it is presented.
We have developed a system that provides users
with personalised spatial data, tailored to their current
task in a specific environment. Our system combines
multimodal interaction with personalised services, re-
sulting in an easy to learn, easy to use GIS for mobile
users. The system has been developed on a Tablet PC.
A Tablet PC is similar to a PDA in that it is a portable,
handheld device. However, Tablet PCs have a larger
screen size and the same processing capabilities as a
desktop PC, hence allowing for superior viewing and
editing in the field. The advanced architecture of the
Tablet PC may be of benefit especially to GIS profes-
sionals such as cartographers or surveyors.
The remainder of the paper is organised as follows.
Section 2 discusses related work in the areas of multi-
modal interfaces and personalisation within GIS. Sec-
tion 3 outlines our system architecture and describes
each system component in detail. A user study and the
results of this study are presented in section 4. Sec-
tion 5 concludes and addresses some ideas for future
work.
2 RELATED WORK
This section describes related research in the areas
of multimodal interfaces and personalisation within
GIS. One of the earliest systems providing a mul-
timodal interface to a GIS was QuickSet (Cohen
et al., 1997). QuickSet is a collaborative, multimodal
(pen/voice) interface for map-based tasks with appli-
cation to distributed systems. QuickSet provides a
multimodal interface to a number of distributed ap-
plications including military simulation, virtual real-
ity and medical informatics. In a later study (Cohen
et al., 2000), QuickSet was compared with a unimodal
GUI. Results indicated a strong user preference for
multimodal over unimodal interaction, and a substan-
tial efficiency increase when users interacted multi-
modally.
The research presented in (Rauschert et al., 2002b)
addresses the problem of the complexity of current
GIS user interfaces. The authors suggest that incor-
porating multimodal interaction into GIS interfaces
as combining input modalities is more efficient and
intuitive to users than using just one input modality.
They describe a system, DAVEG (Dialogue-Assisted
Visual Environment for Geoinformation) that uses a
combination of speech and gesture to aid users in col-
laborative group work within GIS. The advantage of
using gestures in addition to speech is that speech may
not be completely accurate when spatial information
such as location needs to be specified. Gestures are
more useful for such queries. A user evaluation of the
DAVEG system was carried out in (Fuhrmann et al.,
2005), the results of which indicated that users felt the
speech-based dialog allowed them to visualise and in-
teract with the system more easily.
In (Jost et al., 2005) a user study is presented, the
results of which aim to answer the questions: (1)
What are the most suitable interaction techniques for
navigational and informative tasks for mobile pedes-
trians and (2) Do social and situational context affect
multimodal interaction? The study was carried out on
the SmartKom system, a PDA-based application for
ICEIS 2006 - HUMAN-COMPUTER INTERACTION
72
navigation and information for tourists. SmartKom
aims to allow users to interact with the system intu-
itively by supporting several input modalities includ-
ing speech and gesture. The results showed that users
fundamentally prefer multimodal interaction in a mo-
bile information system. The majority of users also
reported increased convenience, speed and usability
while interacting multimodally. Each of the above
systems supports the idea that multimodal interaction
allows for increased flexibility, convenience and effi-
ciency when interacting with GISs. However, our sys-
tem goes one step further by providing users with an
intuitive, user-friendly interface by personalising the
spatial data returned to them. The amount of data be-
ing returned is therefore reduced, hence reducing the
complexity of the interface and improving usability.
One major problem with both Web and mobile GIS
is that systems apply a “one-fits-all” approach, which
does not fulfill the requirements of heterogeneous
users having different goals. For example, Google
Maps (GoogleMaps, 2005) returns maps containing
default map content. This highlights the need for per-
sonalised solutions, tailored to the specific require-
ments of the single user. STAR, a Web-based system
that exploits configuration technology in order to sup-
port a tourist in organizing a personalised agenda for a
tour in a city, is introduced in (Goy and Magro, 2004).
STAR, however, requests explicit input from the user
before suggesting an appropriate agenda. If the pro-
posed agenda solution is partial, i.e. not all the time
slots are filled, then the user can select new items in
order to fill them in.
Many traditional wireless information and naviga-
tion tools available to city visitors suffer from limi-
tations, e.g. they are constrained by the need to sat-
isfy the interests of the majority rather than the spe-
cific interests of individuals. The Cyberguide project,
in which prototypes of a mobile context-aware tour
guide are built, is presented in (Abowd et al., 1997).
Knowledge of the user’s current location, as well as
a history of past locations, is used to provide more of
the kinds of services that are expected from real tour
guides. Cyberguide monitors user interactions with
maps to ascertain user history and users can also in-
sert detail into a database describing their personal ex-
periences. Some content personalisation is provided
through the generation of tourist trails showing po-
tential sites of interest. However, no personalisation
of actual map feature content takes place. The Cyber-
guide application is geared completely towards city
visitors whereas our application does not discriminate
between clients, i.e. we can cater for any individual
seeking spatial information in the form of area maps.
The contribution of our research is focused on de-
signing a graphical user interface that supports mul-
timodal interaction and presentation of personalised
spatial map data for individual GIS users. None of the
above systems provide explicit support for such func-
tionality. The advantage of our approach is that it is
flexible, and so can better serve a more diverse pop-
ulation, thus making our system more user friendly.
Users are given the option of how they choose to inter-
act, making any given session less complex. This cou-
pled with the fact that user interactions are processed
so as to provide personalised data for the user’s next
session means that the user does not have to sift
through superfluous data that is of little relevance to
them. This is particularly advantageous in mobile en-
vironments.
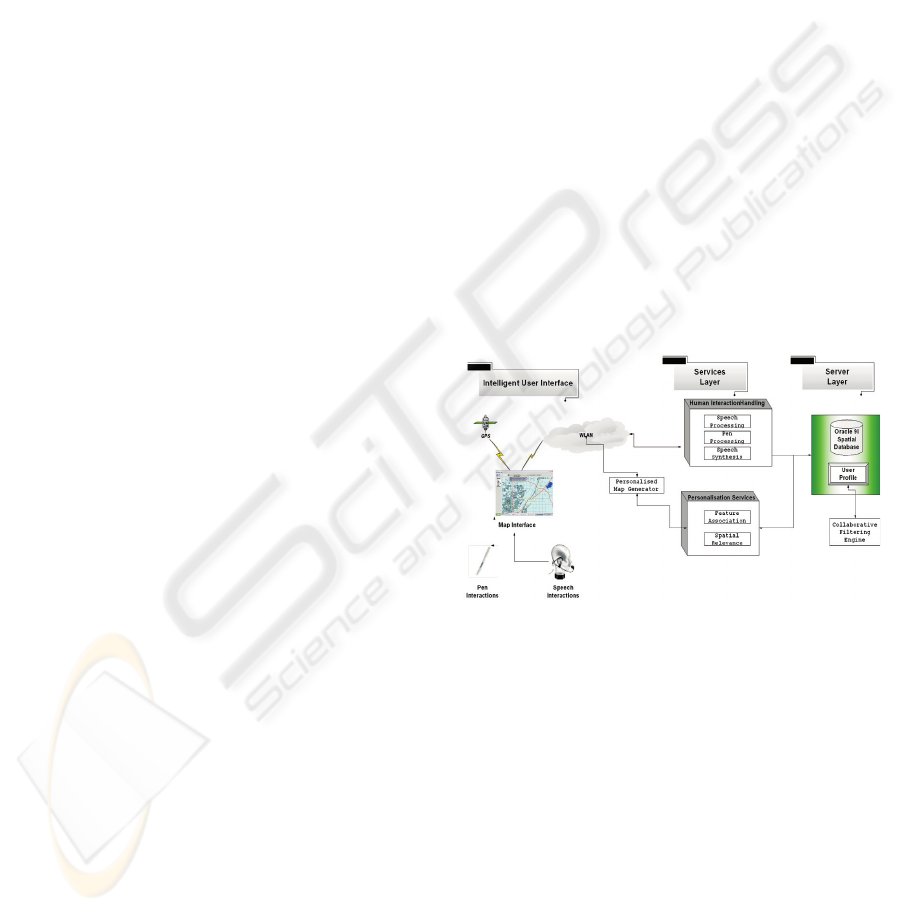
3 SYSTEM ARCHITECTURE
This section describes the system architecture of our
multimodal GIS prototype. The architecture, shown
in Figure 1, comprises three tiers: the intelligent user
interface layer (allowing users to view and manipulate
spatial data), a services layer (providing speech and
pen input processing and personalisation services)
and a server layer (containing spatial data and user
profiles). The functionality of each of the above lay-
ers is described in detail in the following subsections.
Figure 1: System Architecture.
3.1 The Intelligent User Interface
The functionality of the interface layer is threefold: 1)
allow users to visualise map content; 2) allow users to
interact with map features and 3) capture all of the
user’s explicit and implicit interactions so as to cre-
ate/update their user profile. Spatial data is stored as
vector data in the server and converted to GML (Ge-
ography Markup Language) file format, before being
transferred over a wireless network to the interface.
GML is a standard, non-proprietary format developed
by the Open Geospatial Consortium (OGC, 2005), for
the transport and storage of geographic information.
It allows spatial data to be exchanged freely between
users of different systems, regardless of the network,
A MULTIMODAL INTERFACE FOR PERSONALISING SPATIAL DATA IN MOBILE GIS
73

application or platform they are using. Therefore,
GML supports interoperability of spatial applications.
There are many benefits of using an interoperable
GIS and this is the motivation behind using GML in
our system. Collecting and editing data are labour-
intensive and time-consuming tasks. Most GISs use
specific data models and databases for storing and
processing large amounts of diverse data (Visser and
Stuckenschmidt, 2002). This implies that to use this
new data, it must be transferred into the system’s spe-
cific format. This tedious process can be overcome
through the use of GML, as GML provides a common
schema framework for the expression of geospatial
features. An application schema defines how data in
a class of objects should be marked up. GML further
supports interoperability by providing a set of geom-
etry tags.
GML represents geographic data in terms of prop-
erties and geometries of the objects that populate the
world around us. It does so independently of any par-
ticular visualisation of the data. Therefore, a method
is needed to represent GML data visually on a map.
We have developed a GML to Java transformation
that is generic, i.e. it will render any given GML
dataset visually as a Java representation. These Java
objects are then displayed within a mapping inter-
face, OpenMap
TM
(OpenMap, 2005). OpenMap
TM
is
a Java-based, open-source mapping tool that allows
users to develop applications and applets in their own
style.
Figure 2 shows a screenshot of our system inter-
face. Users can interact with the map using a combi-
nation of speech and pen input. Interfacefunctionality
includes navigation (panning and zooming), feature
manipulation (turning on/off feature layers, changing
feature colours), spatial querying and feature annota-
tion (creating and viewing annotations). Maps can be
queried in a number of ways. Users can highlight fea-
tures falling within a certain area on the map or within
a certain distance from a point on the map. They can
also highlight a specific number of features nearest
to a certain point and find the distance between two
points on the map. There is an information bar across
the bottom of the interface. When the user moves the
pen over a certain feature on the map, the spatial lo-
cation in terms of both latitude and longitude, and the
name of the feature the pen is over, are displayed in
the information bar. This prevents the interface from
being cluttered by text, which is particularly impor-
tant on mobile devices. If a user wishes to interact
via speech, they must press the ‘Speech On’ button.
An icon then appears on the interface, indicating that
the user can now issue voice commands. When in-
teracting using speech, if the user’s voice command
is recognised correctly, the command will be printed
on the information bar. Once the action has been car-
ried out, it too is printed on the information bar, e.g.
‘Local roads turned off’. This helps users when inter-
acting via speech as they know whether or not their
command has been recognised or whether they need
to repeat it. Moreover, the information is displayed
unobtrusively so it doesn’t distract the user from their
main task.
Users can choose which mode of interaction they
wish to use, depending on their current task and con-
text. Each user action executed can be associated with
a particular feature or feature set, and is recorded and
analysed so as to ascertain detailed information re-
garding a user’s spatial preferences. More details on
multimodal interaction handling, and personalisation
services provided by our system are outlined in the
following subsection.
3.2 The Services Layer
The services layer provides two services: 1) Human
Computer Interaction Handling, including pen and
speech recognition and 2) Personalisation based on
recorded speech and pen interactions. As pen-based
recognition is relatively self-explanatory, being inte-
grated into most mobile computers, we will focus
here on the speech recognition component of the HCI
handling service. To understand speech commands
voiced by our system users, we have integrated a com-
mercially available speech recognition software pack-
age, ViaVoice
TM
(IBM, 2005), into our mobile GIS in-
terface. Speech input can take two forms: commands,
consisting of one or two word phrases and dictation,
which can consist of multiple words. Commands
are associated with certain map actions and can be
used within our system for navigating (e.g. ‘zoom
out’, ‘pan west’), querying (e.g. ‘highlight lakes’),
manipulating map features (e.g. ‘lakes off’, ‘high-
ways blue’) and to view a list of all possible com-
mands (‘help’). When a user interacts with a map us-
ing a voice command, the spoken words are matched
against a rule grammar file, which contains a list of
all the possible words and phrases that can be spo-
ken and defines the abstract structure these words and
phrases can have. Using a rule grammar allows for
more accurate and robust recognition and interaction,
as a particular action will only be carried out on the
map interface if the voice command associated with
that action was recognised i.e. if it is in the rule gram-
mar. Once the command has been verified against the
rule grammar, the action is carried out and users can
view the outcome of their action on the interface.
Dictation can be used within our system to create
voice annotations about particular map features. In
contrast to processing voice commands, when a user
inputs a spoken annotation into the system the words
spoken are not matched against a rule grammar, but
rather a dictation grammar. Dictation grammars im-
pose fewer restrictions on what a user can say and so
ICEIS 2006 - HUMAN-COMPUTER INTERACTION
74
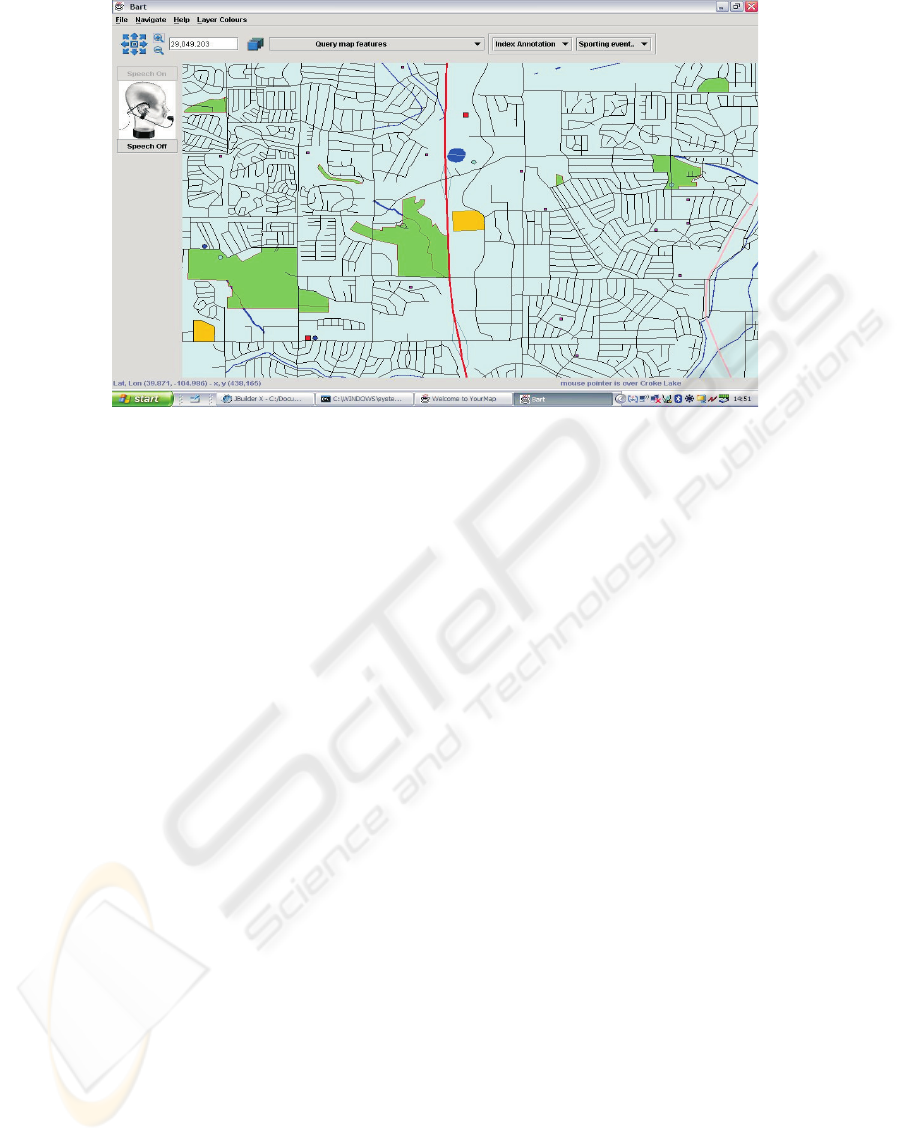
Figure 2: Multimodal Interface.
can ideally provide free-form speech input. However,
this comes at a cost, as dictation grammars require
higher quality audio input, more computing resources
and they tend to be more error-prone. Once a user
issues the command ‘Create Annotation’ to our inter-
face, the speech synthesis engine of the HCI Handling
service outputs a spoken message to the user, telling
them to enter their voice annotation and use the pen
to pick the point/feature on the map they wish to as-
sign this annotation to. This combined use of speech
and pen gesture is also used for querying the system.
For example, to highlight lakes a user would issue
the command ‘highlight lakes’. The system then re-
sponds by telling the user to ‘pick a point on the map
or draw a rectangle’, using the pen. Any lakes lying
within the area drawn by the user are highlighted. Re-
sults of our user evaluation show that all users found
querying and annotating using combined speech and
pen more efficient and more intuitive than solely us-
ing pen input. Hence multimodal interactions allow
for simpler interfaces to be built.
All of the user’s executed actions, whether entered
via speech or pen, are recorded and analysed in our
Personalisation service. When personalising map fea-
ture content, our system categorizes map features into
two groups: long-term features and short-term fea-
tures. Long-term features are those persistent map
features that users tend to view in all map sessions
and allow them to navigate the map successfully, e.g.
roads, rivers, rail lines. Short-term features are fea-
tures that tend to be at the centre of user mapping
tasks and hence form the focus of a map session, i.e.
point (buildings) and area (lakes) landmarks. The
question is how do we personalise map feature con-
tent, albeit long-term features or short-term features.
For any two features to be classified as long-term in-
terest features for a user, they must satisfy the fol-
lowing criteria: (1) they must both appear in at least
a specified percentage of total session map frames,
and (2) they must be sufficiently “similar”, i.e. they
must both be present together in a predetermined per-
centage of total session map frames. Ascertaining
long-term interest features in this manner allows us to
group map features, that individual users show prefer-
ence for, together. Similar users can now be grouped
together based on long-term feature interests.
Personalising short-term features is realized using
a different approach. Landmark interests are estab-
lished from interest map frames. Interest map frames
are extracted from user-session recordings and are
determined based on the following two conditions:
(1) the time lapse between successive frames exceeds
some value, and (2) the action that resulted in the first
of the two frames being generated is significant, e.g.
toggling a layer on or highlighting a layer. Clustering
interest map frames, based on attributes like frame
boundary, frame area, and the number of associated
map features, from one or more users allows us to de-
termine those landmark features that users show most
interest in. Once we have performed the clustering,
we can then analyze the various clusters to check for
trends in short-term feature presence. This allows us
to recommend landmark features and hence provide
personalised maps to users.
A MULTIMODAL INTERFACE FOR PERSONALISING SPATIAL DATA IN MOBILE GIS
75

3.3 The Server
The server layer stores (1) spatial data and (2) user
profile information. User profiles store the history
of users’ interactions with maps provided by our sys-
tem. All interactions between the users and maps are
recorded in log files. The log files are then analyzed
and relevant detail is propagated to the various user
profiles. Each user profile comprises a collection of
distinct user sessions involving that user. Information
in the user profiles is used to recommend map feature
content to new and existing users.
Users can be grouped together based on informa-
tion stored in their personal profiles. The following
information is recorded in the user model: (1) Ses-
sion frames: every single frame generated is recorded
in log files along with all the features present in the
frame. This detail is then extracted from the log
files and inserted into the user profile. Recording
all session frames allows us to establish long-term
feature interests for individuals and groups of users.
(2) Session actions: all actions executed by the user
are recorded in the log files. Once the session has
been terminated, all detail related to the sequence of
session actions is propagated into the user profile.
This enables trends in how different users manipulate
maps, to be established. (3) Session interest frames:
interest frames are extracted from the log files based
on time and action criteria and inserted into the user
model. Session interest frames provide the basis for
establishing short-term or landmark feature interests.
Clustering interest frames allows us to spot trends in
how one or more users interact with landmark fea-
tures. (4) Session tags: each user session is tagged
with a session definition that describes what that ses-
sion is about. Session tags are primarily based on in-
terest frame detail and thus on what landmark features
are at the centre of each task.
4 EVALUATION
We undertook a user study of our system, the main
focus of which was to determine the usability and in-
tuitiveness of our multimodal mobile GIS for non-
expert users. The evaluation focused on interaction
using combined speech and pen input as opposed to
just pen input. We were also interested in the effec-
tiveness of our system when recommending person-
alised, context-aware spatial information to individual
users. Eight subjects participated in our user study.
Each subject was of a computer science background,
but none had any previous experience using a GIS. All
users were mobile (i.e. walking) during the evaluation
which was carried out in noisy or relatively noisy en-
vironment (a canteen or an outdoor area). Individual
participants were assigned specific tasks that would
determine what features they would be interested in
for each of their sessions. A total of 15 sessions were
completed by each subject. During the first 5 sessions
it was requested that subjects would use solely pen
input for interaction. Multimodal (i.e. combined pen
and speech) interaction was to be used for sessions
6-10 and for the remaining 5 sessions users were ad-
vised that they could interact using either solely pen
input or combined speech and pen. As each subject
was unfamiliar with the system, a brief 10 minute
demonstration was given, highlighting the function-
alities of the system that would be important for com-
pleting tasks. This included demonstrations of how
actions were performed using both speech and pen.
Each individual subject was assigned a set of tasks,
each of which determined what feature(s) were the fo-
cus of each session. An example of a task might be:
“You work for the local water authority. You need to
take water samples from all major lakes and rivers.
Where are they located and what is the best route be-
tween them?” All subsequent tasks for this user would
focus on water features and the road network between
them. Each task was then broken down into a series
of subtasks: 1) Zoom and pan as required to navigate
to features of interest. 2) Ensure all features of inter-
est are turned on. 3) Turn off 2 non-relevant features.
4) Query the feature(s) of interest (highlight, find dis-
tance between features etc.) 5) Create an annotation
and assign it to a feature on the map.
These subtasks were carried out using the pen
(tasks 1-5), pen and speech (tasks 6-10) and the user’s
preferred mode (tasks 11-15). Each of the tasks re-
quired the user to carry out a set number of subtasks.
On average, the subjects performed 11 subtasks re-
gardless of whether they were interacting uni or mul-
timodally. This allowed us to quantify interaction
modes more accurately. Irrespective of which mode
of interaction was used, all of the users actions were
recorded and stored in log files. User profiles were
created from this data after a user’s first session and
modified based on their subsequent session interests.
Hence, the more the user interacted, the more person-
alised the maps returned to them became.
4.1 Results
As each subject was interacting, not only were their
actions implicitly recorded and logged for user profil-
ing, but the evaluators also monitored their actions,
the results of these actions and user’s responses to
these actions. We noted and recorded, for example,
the number of times it was necessary to repeat voice
commands (tasks 6-10) and the number of errors as-
sociated with pen input and combined pen and speech
input. We also recorded the time taken to complete
all tasks so as to ascertain if uni or multimodal inter-
ICEIS 2006 - HUMAN-COMPUTER INTERACTION
76
action was more efficient for such tasks. When each
participant had completed all their sessions, they were
asked to fill out a questionnaire covering various as-
pects of their interaction with the system. We were
interested in the user’s subjective experience of sys-
tem usability, intuitiveness of the multimodal inter-
action, their preference for one mode over the other
and in particular, in discovering if they felt interact-
ing multimodally enhanced their experience of using
the system in any way. This depended on a number
of factors including recognition rates and error rates
when using speech input. The necessity to keep re-
peating voice commands due to non-recognition can
be frustrating for users, as can the need to correct ac-
tions due to mis-recognitions. For this reason, sub-
jects were advised to issue a voice command no more
than 3 times, and if their command had still not been
recognised they were to perform the action using al-
ternative means.
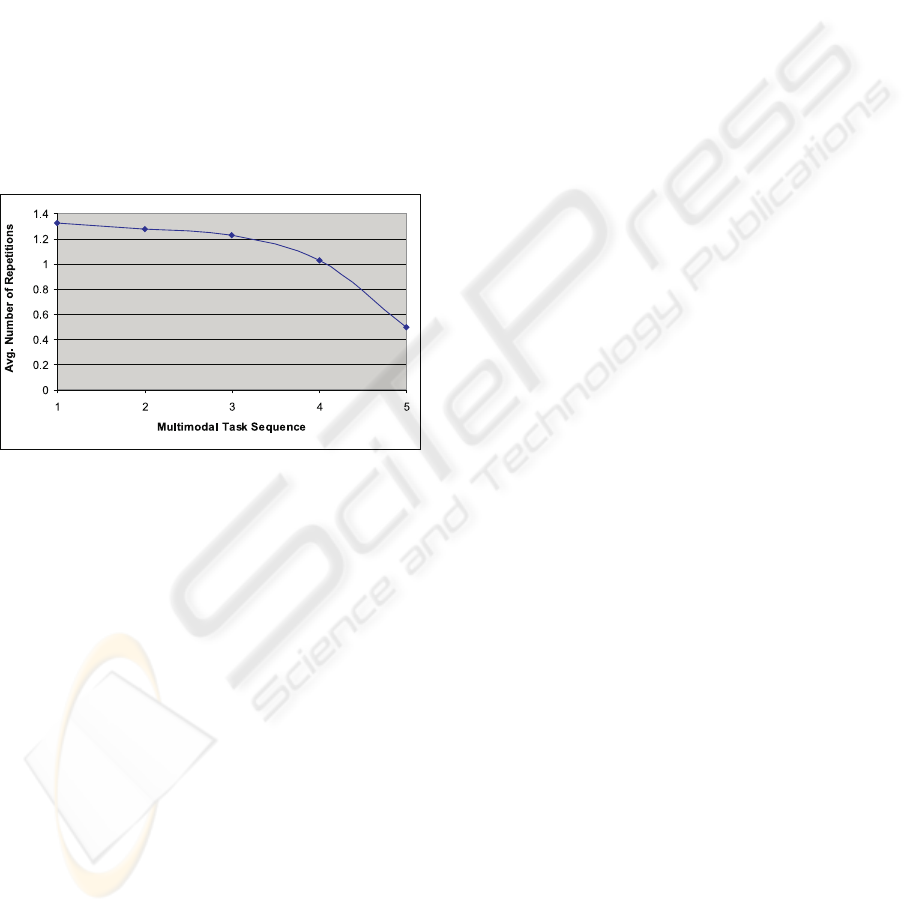
Figure 3: Average Number of Repetitions for Tasks 6-10.
Note that the task at position 1 in the multimodal task se-
quence on the graph corresponds to the 1st multimodal task
i.e. task 6.
Our results showed that the average number of
times, across all eight subjects, that it was necessary
to repeat voice commands during task 6 was 1.375.
However, by task 10 this number had decreased to 0.5
(Figure 3). The reason for this can be attributed to
many factors including (1) Even after only 5 sessions
using voice commands, the system had begun to learn
the users voice; (2) As the user interacted via speech
more, they became more accustomed to speaking in
a clear tone of voice so as to be understood by the
system; (3) Some subjects initially felt self-conscious
using voice commands in public and so spoke more
quietly. However, as they interacted, they became
more comfortable with the system and so spoke more
clearly and openly. The number of mis-recognitions
also decreased. Mis-recognitions occurred mostly
when the subject was unsure of the voice command
needed to execute a certain action and so paused too
long before saying the second word of the command.
For example, if a user pauses during the command
‘highways red’, the system will only hear the com-
mand ‘highways’ which will switch highways on/off.
This is also considered an error which the user must
correct using either speech or pen input. We noted
however, that as subjects became more familiar with
the voice commands the number of mis-recognitions
decreased. The above results highlight the fact that it
is feasible to incorporate off the shelf, untrained VR
techniques as part of a multimodal interface for these
types of tasks.
With regard to the efficiency of uni versus multi-
modal interaction for tasks, our results showed that
multimodal interaction using speech and pen was
faster, and therefore more efficient, than using the pen
as a single modality. Overall, there was an increase of
12.21% when subjects used a combination of speech
and pen input. This increase in efficiency whilst inter-
acting multimodally is made even more significant by
that fact that none of the subjects had previous expe-
rience using the multimodal interface of our system.
Therefore, they were not familiar with the voice com-
mands required to perform certain actions. We can
consequently expect that as users become more famil-
iar with the system efficiency rates will increase.
When filling out the questionnaire subjects were
asked if they felt the system was easy to learn and use
overall. All 8 subjects said that with minimal training,
they felt confident that they could interact effectively
with the system. Each of the subjects also stated they
recognised an improvement in performance for tasks
6 to 10. Initially, 5 of the 8 subjects stated they found
using solely pen input easier than combined speech
and pen. The reasons provided for this were that sub-
jects were not familiar with the voice commands and
felt slightly uncomfortable issuing voice commands
in public. However, again, as these subjects became
familiar with the system they agreed that multimodal
interaction was indeed intuitive and efficient. More-
over, all 8 indicated a preference for interacting mul-
timodally and chose to interact multimodally during
their final 5 sessions. Some of the reasons for this
included the fact that the pen could be awkward to
use for pointing precisely to small GUI components,
voice commands were both more intuitive to users
and also more efficient as the commands were brief
and it was easier to correct errors multimodally. All
subjects also stated that whilst mobile, it was easier
to use speech input to interact as it was easier to walk
and speak at the same time than walk and point/select
precisely with the pen. These results indicate that our
graphical interface, providing multimodal interaction,
is both easy to learn and intuitive.
With regard to the personalisation of spatial data
for individual users, as users interacted with the sys-
tem more, the system was able to learn their interests.
Therefore, their user profile became more detailed.
Less irrelevant data was returned to the user and hence
A MULTIMODAL INTERFACE FOR PERSONALISING SPATIAL DATA IN MOBILE GIS
77

less interactions were required of the user to perform
their specific tasks. More detailed results of the per-
sonalisation component of our system can be found in
other publications (Weakliam et al., 2005a), (Weak-
liam et al., 2005b). As expected, this reduced amount
of spatial content combined with multimodal interac-
tion resulted in an overall feeling of increased effi-
ciency and ease of use of the system for all subjects.
5 CONCLUSION
Multimodal interfaces are an exciting research para-
digm within the field of Human Computer Interac-
tion. Mobile GISs that process speech and pen input
have been shown to be more flexible, efficient, robust
and user-friendly. We have developed a multimodal
mobile GIS that can be used by both expert and non-
expert users in the field. Our system provides users
with the flexibility to choose their preferred mode of
interaction depending on their current task and envi-
ronment. Our evaluation showed a complete prefer-
ence for multimodal over unimodal interaction and
also that within a mobile environment it is easier to
walk and speak than walk and point. Moreover, we
have combined our multimodal interface with person-
alisation services, further improving the usability and
efficiency of our system. Providing users with per-
sonalised spatial data allows us to significantly reduce
the amount of information being sent to their mobile
client and reduces the complexity of the interface.
REFERENCES
Abowd, G., Atkeson, C., Hong, J., Long, S., Kooper,
R., and Pinkerton, M. (1997). Cyberguide: A mo-
bile context-aware tour guide. Wireless Networks,
3(5):421–433.
Blaser, A., Sester, M., and Egenhofer, M. (2000). Visualiza-
tion in an early stage of the problem solving process
in gis. Computers and Geosciences, 26(1):57–66.
Cohen, P., Johnston, M., McGee, D., Oviatt, S., Pittman,
J., Smith, I., Chen, L., and Clow, J. (1997). Quickset:
Multimodal interaction for distributed applications. In
5th ACM Conference on Multimedia, pages 31–40,
Seattle, Washington, USA.
Cohen, P., McGee, D., and Clow, J. (2000). The efficiency
of multimodal interaction for a map-based task. In
6th International Conference on Applied Natural Lan-
guage Processing, pages 331–338, Seattle, Washing-
ton, USA.
Fuhrmann, S., MacEachren, A., Dou, J., Wang, K., and
Cox, A. (2005). Gesture and speech-based maps to
support use of gis for crisis management: A user
study. In Auto-Carto 2005, Las Vegas, USA.
GoogleMaps (2005). http://maps.google.com/.
Goy, A. and Magro, D. (2004). Star: A smart tourist agent
recommender. In European Conference on Artificial
Intelligence (ECAI 04), pages 44–50, Valencia, Spain.
IBM (2005). http://www.ibm.com.
Jost, M., Haussler, J., Merdes, M., and Malaka, R. (2005).
Multimodal interaction for pedestrians: An evaluation
study. In 10th International Conference on Intelligent
User Interfaces, pages 59–66, San Diego, California,
USA.
OGC (2005). http://www.opengeospatial.org/.
OpenMap (2005). http://openmap.bbn.com/.
Oviatt, S. (1996). Multimodal interfaces for dynamic inter-
active maps. In SIGCHI conference on Human Fac-
tors in Computing Systems, pages 95–102, Vancouver,
Canada.
Oviatt, S. (1999). Mutual disambiguation of recognition
errors in a multimodal architecture. In The Conference
on Human Factors in Computing Systems (CHI ’99),
pages 576–583, Pennsylvania, USA.
Oviatt, S. and Cohen, P. (2000). Multimodal interfaces that
process what comes naturally. Communications of the
ACM, 43(3):45–53.
Rauschert, I., Agrawal, P., Sharma, R., Fuhrmann, S.,
Brewer, I., MacEachren, A., Wang, H., and Cai, G.
(2002a). Designing a human-centered, multimodal gis
interface to support emergency management. In 10th
ACM International Symposium on Advances in Ge-
ographic Information Systems, pages 119–124, Vir-
ginia, USA.
Rauschert, I., Sharma, R., Fuhrmann, S., Brewer, I., and
MacEachren, A. (2002b). Approaching a new multi-
modal gis-interface. In 2nd International Conference
on GIS (GIScience) , Colorado, USA.
Rugelbak, J. and Hamnes, K. (2003). Multimodal interac-
tion - will users tap and speak simultaneously. Telek-
tronikk, 2:118–124.
Visser, U. and Stuckenschmidt, H. (2002). Interoperability
in gis - enabling technologies. In 5th Agile Conference
on Geographic Information Science, pages 291–297,
Mallorca, Spain.
Weakliam, J., Bertolotto, M., and Wilson, D. (2005a). Im-
plicit interaction profiling for recommending spatial
content. In ACMGIS ’05 (in press), Bremen, Germany.
Weakliam, J., Lynch, D., Doyle, J., Bertolotto, M., and
Wilson, D. (2005b). Delivering personalized context-
aware spatial information to mobile devices. In 5th In-
ternational Workshop on Web and Wireless Geograph-
ical Information Systems (W2GIS ’05), pages 194–
205, Lausanne, Switzerland.
Zipf, A. (2002). User-adaptive maps for location-based ser-
vices (lbs) for tourism. In 9th International Confer-
ence for Information and Communication Technolo-
gies in Tourism (ENTER 2002), pages 329–338, Inns-
bruck, Austria.
ICEIS 2006 - HUMAN-COMPUTER INTERACTION
78
