
DISTANCE HISTOGRAM TO CENTROID AS A UNIQUE FEATURE
TO RECOGNIZE OBJECTS
Pilar Arques, Rafael Molina, Mar Pujol, Ramon Rizo
Group: ”Informatica Industrial e Inteligencia Artificial”
Universidad de Alicante
Keywords:
Feature extraction, Pattern Recognition, Histogram, Centroid.
Abstract:
The shape of objects plays an essential role among the different aspects of visual information. A 2D silhouette
often conveys enough information to allow the correct recognition of the original 3D object. Distance His-
togram to Centroid will be used as the unique feature to totally describe an object and to distinguish it from
all the other objects in the scene. The proposed system has been proved to be robust to discriminate between
classes in a given set of objects The main advantages are the elimination of the feature selection process and
avoiding the problem of dimensionality.
1 INTRODUCTION
The shape of objects plays an essential role among the
different aspects of visual information (Marr, 1982).
Therefore, it is a very powerful feature when used in
similarity search and retrieval. Unlike colour and tex-
ture features, the shape of an object is strongly tied
to the object functionality or identity. Unfortunately,
semantically meaningful shapes are not easy to ob-
tain from images, due to the poor performance of to-
days’ automatic segmentation algorithms. Moreover,
noise, occlusion and distortions introduced during the
image formation process, make object extraction and
similarity estimation a difficult task. Image formation
is basically a projection of the 3D world onto the 2D
space. A 2D silhouette often conveys enough infor-
mation to allow the correct recognition of the original
3D object.
A new method to characterize objects is presented.
It is based on the distance between the object centroid
and all its contour points. A frequency histogram
which characterizes the object is obtained from the
distance.
The paper is organized as follows. In section 2,
there is a brief description about desiderable proper-
ties for a shape representation method, and a short
shape representation methods review. Section 3 is fo-
cused on the definition of the distance histogram to
centroid. Section 4 shows several proves and exam-
ples of classification with our method. And, section 5
explains the conclusions and future work.
2 FEATURES USED IN IMAGE
INTERPRETATION
To find or recognize an object in a scene it is neces-
sary to extract its properties (colour, size, elongation
...) and keep them in a vector, namely feature vec-
tor. These feature vectors mathematically define and
represent an object. Any process which transforms
pixels in a more compact format of a superior level
is a representation of an object. For example, in a
first approximation the border of an object is defined
by all the pixels in the frontier. A more efficient rep-
resentation of the border is polygonal adjustment of
contour points. Sometimes the pixels are not trans-
formed; they form a representation which defines the
object.
Evaluating the quality of the shape description
method is a common problem in shape description re-
search. Each application domain requires a suitable
approximation. The chosen method depends on the
features used to describe the objects shape and the ap-
plication domain. Sometimes, the presence of noise in
the image determines the description method. There
is not a definitive method to evaluate the goodness of a
shape description approximation, although shape rep-
resentation schemes must have some desirable prop-
erties (Pitas, 2000):
• Uniqueness. It has a crucial importance in ob-
ject recognition, because each object must have a
unique representation.
492
Arques P., Molina R., Pujol M. and Rizo R. (2006).
DISTANCE HISTOGRAM TO CENTROID AS A UNIQUE FEATURE TO RECOGNIZE OBJECTS.
In Proceedings of the First International Conference on Computer Vision Theory and Applications, pages 492-497
DOI: 10.5220/0001370804920497
Copyright
c
SciTePress
• Completeness. This refers to unambiguous repre-
sentations. Invariance under geometrical transfor-
mations.
• Invariance under translation, rotation, scaling and
reflection is very important for object recognition
applications.
• Sensitivity. This is the ability of a representation
scheme to reflect easily the differences between
similar objects.
• Abstraction from detail. This refers to the ability of
a representation to represent the basic features of a
shape and to abstract from detail. This property is
directly related to the robustness of the representa-
tion under noise conditions.
Shape representation techniques are generally char-
acterized as being boundary-based or region-based.
The former represents the shape by its outline, while
the latter considers the shape as being composed of
a set of two-dimensional regions. Techniques in
both categories can be further subdivided into sub-
categories (Fontoura and Marcondes, 2001):
• Contour-based approaches: Spatial domain tech-
niques (Parametric contours, Set of contour points,
...) and Transform domain techniques (Fourier
transform of the parametric representation).
• Region-based approaches: Spatial domain tech-
niques (Region Decomposition, Boundary Re-
gions, ...) and Transform Domain Techniques (such
as Gabor filters).
Selecting a set of features from the shape represen-
tation to characterize an object for a certain applica-
tion is not easy, since the variability of the shapes and
the specific characteristics of the application domain
must be taken into consideration. Feature comparison
can be understood as a way of quantifying the sim-
iliarity/dissimilarity between corresponding objects.
This is a very difficult problem since it tries to mimic
the human perception of similarity between objects
(Papathomas, 1996).
3 DISTANCE HISTOGRAM TO
CENTROID
Distance Histogram to Centroid will be used as the
unique feature to totally describe an object and to dis-
tinguish it from all the other objects in the scene. The
process of calculation can be dramatically speeded up
using a unique property to characterize an object. The
problem of dimensionality would be also avoided.
The selection of an adequate classifier would even al-
low the system to recognize the shapes in real time.
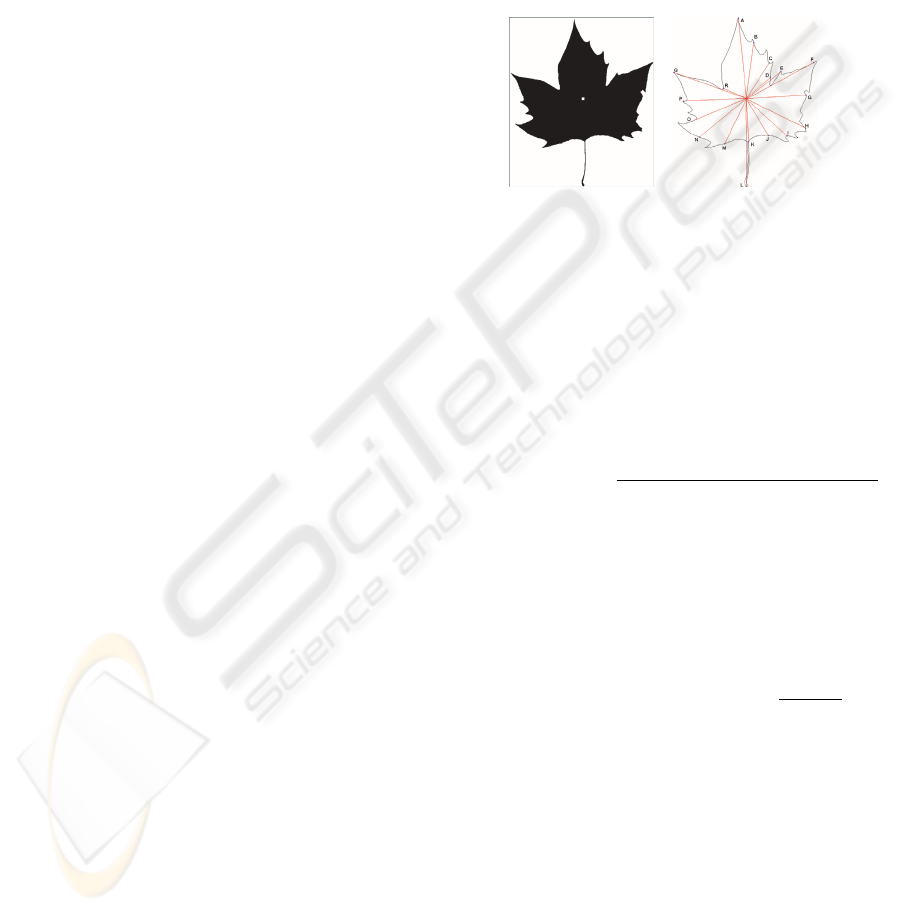
For each region in the scene, the centroid (Figure 1
A) and the distance from it to every perimeter point
(Figure 1 B) are calculated. The categories of the
histogram are defined by the user. Once the Euclid-
ean distance from the border points to the centroid is
calculated, it is assigned to the correct category bear
in mind the maximum distance from the border to
the centroid. So the obtained histogram is invariable
to rotation and to translation but not to scaling. To
achieve scaling invariance the histogram must be nor-
malize by dividing each histogram component by the
object perimeter.
A B
Figure 1: Centroid.
The Distance Histogram to Centroid is defined as
follows:
Let R be one region in the scene.
Let P be the perimeter of region R.
Let x =(¯x
R
, ¯y
R
) be the centroid of region R.
Let F
1
, ··· ,F
n
be the set of all the border points of
region R.
The Euclidean distance between each border point
and the centroid should be calculated by 1
distance(F
i
)=
(F
i
(x) − ¯x
R
)
2
+(F
i
(y) − ¯y
R
)
2
(1)
Let D
max
be the maximum distance from any border
point to the centroid in region R.
Let NCAT be the total number of categories in
which the histogram is divided.
The equation 2 calculates the category for this
distance.
cat(distance(F
i
)) = distance(F
i
) ∗
NCAT
D
max
(2)
Let H be the resulting histogram and let
H[1]..H[NCAT] be the different resulting val-
ues for each category.
The proposed algorithm is as follows:
For every F
j
do
Calculate distance(F
j
)
Calculate d = cat(distance(F
j
))
H[d]++
For i=1 to i=NCAT do
H[i]=H[i]/P
Figure 2 shows an object with several rotation,
translation and scaling transformations. The first ob-
tained histogram (figure 3 A) it is not invariable to
scaling.
DISTANCE HISTOGRAM TO CENTROID AS A UNIQUE FEATURE TO RECOGNIZE OBJECTS
493
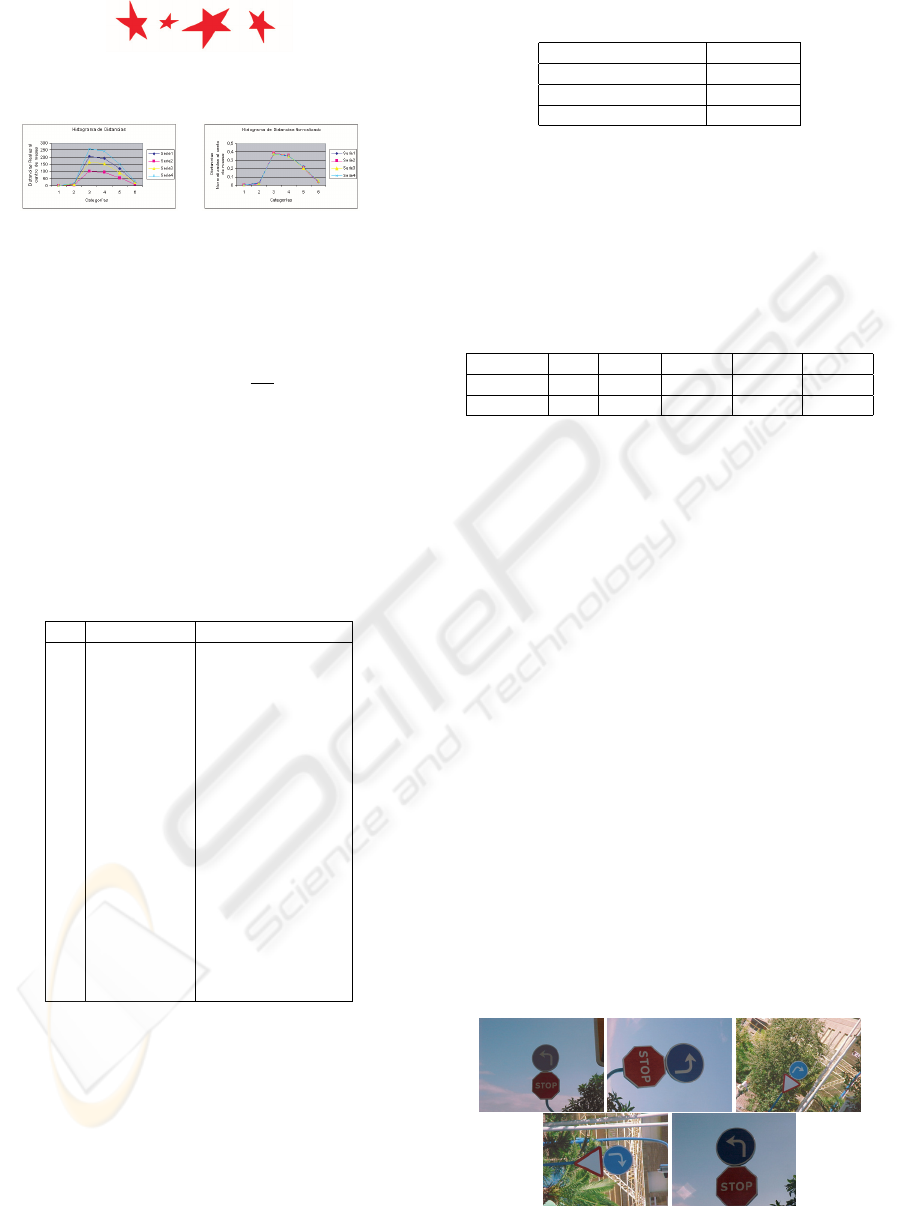
Figure 2: An object.
A B
Figure 3: Histograms of figure 2.
To achieve scaling invariability normalization is ap-
plied (see figure 3 B):
∀H
i
∈ HH
i
=
H
i
P
(3)
3.1 Example
Table 1 introduces the coordinates and the centroid
distance for the border points labelled A..R in figure
1B.
Table 1: Histogram Centroid Distance data useful.
Coordinates Centroid distances
A (225,1) 279
B (279,86) 194
C (336,157) 146
D (337,207) 109
E (375,186) 152
F (492,163) 264
G (465,269) 211
H (462,380) 231
I (395,408) 191
J (334,407) 151
K (262,427) 149
L (254,584) 305
M (175,435) 175
N (94,414) 210
O (65,356) 204
P (31,287) 223
Q (1,188) 269
R (172,246) 88
Table 2 shows de perimeter, centroid coordinates,
maximum and minimum centroid distance to calcu-
late the Distance Histogram to Centroid. In this case,
just some border points are randomly chosen, but all
the border points are actually needed to calculate the
correct histogram.
Once all the data of the perimeter have been calcu-
lated, we must obtain its related histogram.
Let us suppose that the categories number in which
we want to divide the histogram is 5, as the maximum
Table 2: Global data from figure 1 B.
Coord. Centroid (254,278)
Maximum Distance 305
Minimum Distancie 88
Perimeter 2339
distance is 305, each category groups the distances in
5 different intervals with value 61. For each category,
the table 3 shows the distance range and the frequency
for the labelled points in figure 1 B.
Table 3: Distance Frequency Histogram from points in fig-
ure1B.
Category 1 2 3 4 5
Interval 0-60 61-121 122-182 183-243 244-305
Frequency 0 2 5 7 4
The frequency histogram obtained in table 3 is rota-
tion and/or translation invariable, because all the con-
tour points are taken into consideration to calculate
it, and the initial contour point has no influence in
this histogram. However, this first histogram is totally
conditionated by the object size. Just suppose a large
object: it would have higher frequency values than the
same object with a smaller size. To achieve the scal-
ing invariability the frequency data are normalized by
dividing it by the object perimeter value.
4 EXPERIMENTS
To verify that the Distance Histogram to Centroid de-
fines a unique, robust, complete and invariable fea-
ture, real image proofs with different categories are
been made.
Two kinds of real images have been selected: im-
ages from traffic signals (figures 4 and 6) and from
library books (figure 10). To make the data base, the
object is extracted from the scene (figures 5, 7 and
11), and the histogram distance to centroid is calcu-
lated (figures 8, 9 and 12).
Figure 4: Traffic Signal. Original Image.
VISAPP 2006 - IMAGE ANALYSIS
494
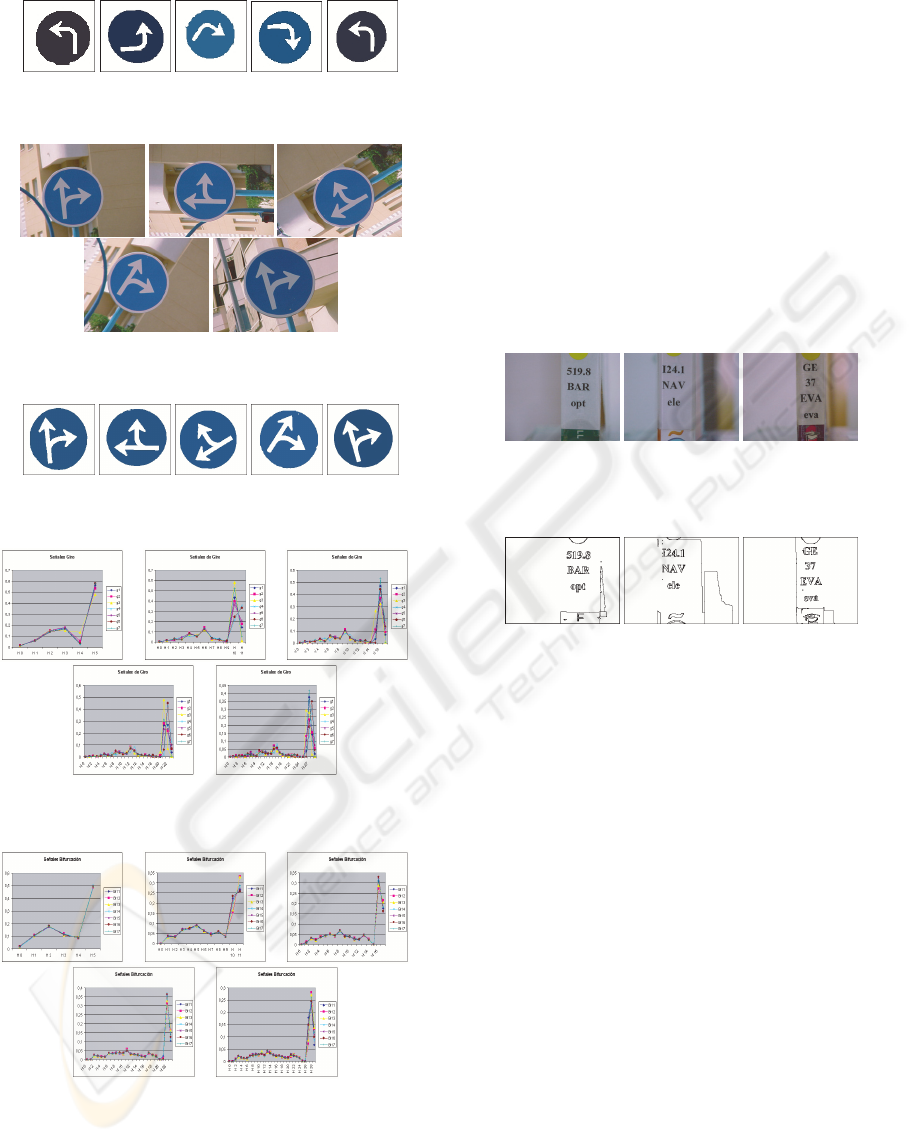
Figure 5: Traffic Signal 1. Extraction.
Figure 6: Traffic Signal. Original Image.
Figure 7: Traffic Signal 2. Extraction.
A B C
D E
Figure 8: Traffic Signal 1. Histogram.
A B C
D E
Figure 9: Traffic Signal 2. Histogram.
Histograms belonging to the same object have been
grouped in the same figure. Figure 8 shows the his-
tograms of traffic signal 1 (Figure 5) and figure 9
shows the histograms of traffic signal 2 (Figures 7).
Histograms have also been grouped by categories,
that is, figure 8 A and figure 9 A represents 6 cate-
gories, figure 8 B and figure 9 B represents 12 cate-
gories, and so on. So depending on the type of the
object in the database the number of categories for a
correct discrimination is studied.
To verify if the Distance Histogram to Centroid
characterizes univocally an object, we used another
kind of images, the digits in a library book.
In figure 10 there are several images with different
library books. Figure 11 shows the segmentation ob-
tained applying (Arques et al., 2005) algorithm. Tak-
ing this segmentation as a starting point, each seg-
mented region distance histogram to centroid is cal-
culated.
Figure 10: Library books. Original Image.
Figure 11: Library books. Segmented Image.
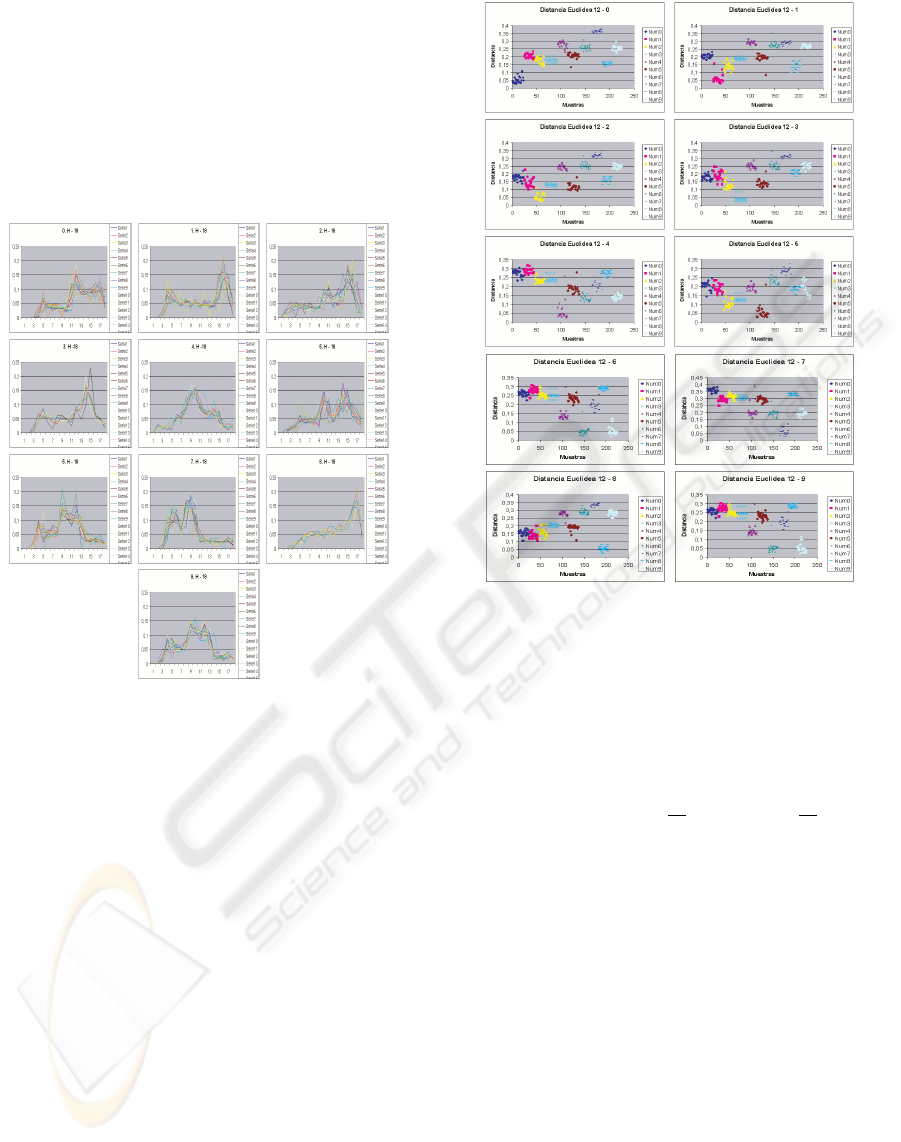
Figure 12 displays the Distance Histogram to Cen-
troid for the library books digits, in this case we work
with 18 categories, we used 20 samples of each digit.
The graphical results show a different graphic for
each digit except for 6 and 9 digits which have the
same shape. So this method could be useful to recog-
nize objects.
4.1 Classification
The task of a classifier in a full system is to use the
feature vector provided by the feature extractor to as-
sign the object to a category. Due to the fact that
perfect classification performance is often impossi-
ble, a more general task is to determine the proba-
bility for each of the possible categories. The abstrac-
tion provided by the feature-vector representation of
the input data enables the development of a largely
domain-independence theory of classification (Duda
et al., 2001).
The degree of difficulty of the classification prob-
lem depends on the variability in the feature values
for objects in the same category relative to the differ-
ence between feature values for objects in different
categories.
DISTANCE HISTOGRAM TO CENTROID AS A UNIQUE FEATURE TO RECOGNIZE OBJECTS
495
Given a classification task of M classes, w
1
, w
2
,
..., w
m
and an unknown pattern, which is represented
by a feature vector x, we form the M conditional
probabilities P (w
i
|x), i =1, 2, ··· ,M. Sometimes,
these are also referred to as ”a posteriori” probabil-
ities. Each of them represents the probability of the
unknown pattern to belong to the respective class w
i
,
given that the corresponding feature vector takes the
value x. Let µ
i
the average histogram of class i.
Figure 12: Library books. Histogram.
A method to verify the distance histogram to cen-
troid as a set of features to classify objects is pre-
sented. 10 different classes have been defined, one for
each digit, and the mean of each class is calculated.
Then, different discriminant functions to classify are
used:
Euclidean Distance:
d
∈
= x − µ
i
(4)
Thus, the feature vectors are assigned to classes ac-
cording to their Euclidean distance from the respec-
tive mean points.
Figure 13 shows the graphic results obtained us-
ing Euclidean Distance as a discriminant function be-
tween classes. Each graphic represents the Euclidean
Distance between the mean value of each class and all
samples in database. The lowest value corresponds to
samples which belong to µ
i
class. In this case we have
been used 12 categories.
Kullback-Leibler Distance:
The relative entropy or Kullback-Leibler distance
(which is closely related to cross entropy, informa-
tion divergence and information for discrimination) is
Figure 13: Euclidean Distance.
a measure of the distance between two distributions.
For a multiclass problem, the divergence (Kullback-
Leibler distance) is computed for every class pair w
i
,
w
j
. (Theodoridis and Koutroumbas, 1999)
d
KL
=
N
i=1
x
i
log
x
i
µ
i
+
N
i=1
µ
i
log
µ
i
x
i
(5)
Figure 14 shows the graphic results obtained using
Kullback-Leibler Distance as a discriminant function
between classes. Each graphic represents Kullback-
Leibler Distance between the mean value of each
class and all samples in database. The lowest value
corresponds to samples which belong to µ
i
class. In
this case we have been used 18 categories.
In both cases, Euclidean Distance and Kullback-
Leibler Distance all samples are grouped with differ-
ent distances to the mean of these case, so Euclidean
Distance and Kullback-Leibler Distance discrimines
all the classes.
4.2 Classification Examples
Figure 15, shows the pattern classification obtained
applying the distance Histogram to Centroid to a data
base of 28 classes with 20 pattern for each class. The
VISAPP 2006 - IMAGE ANALYSIS
496
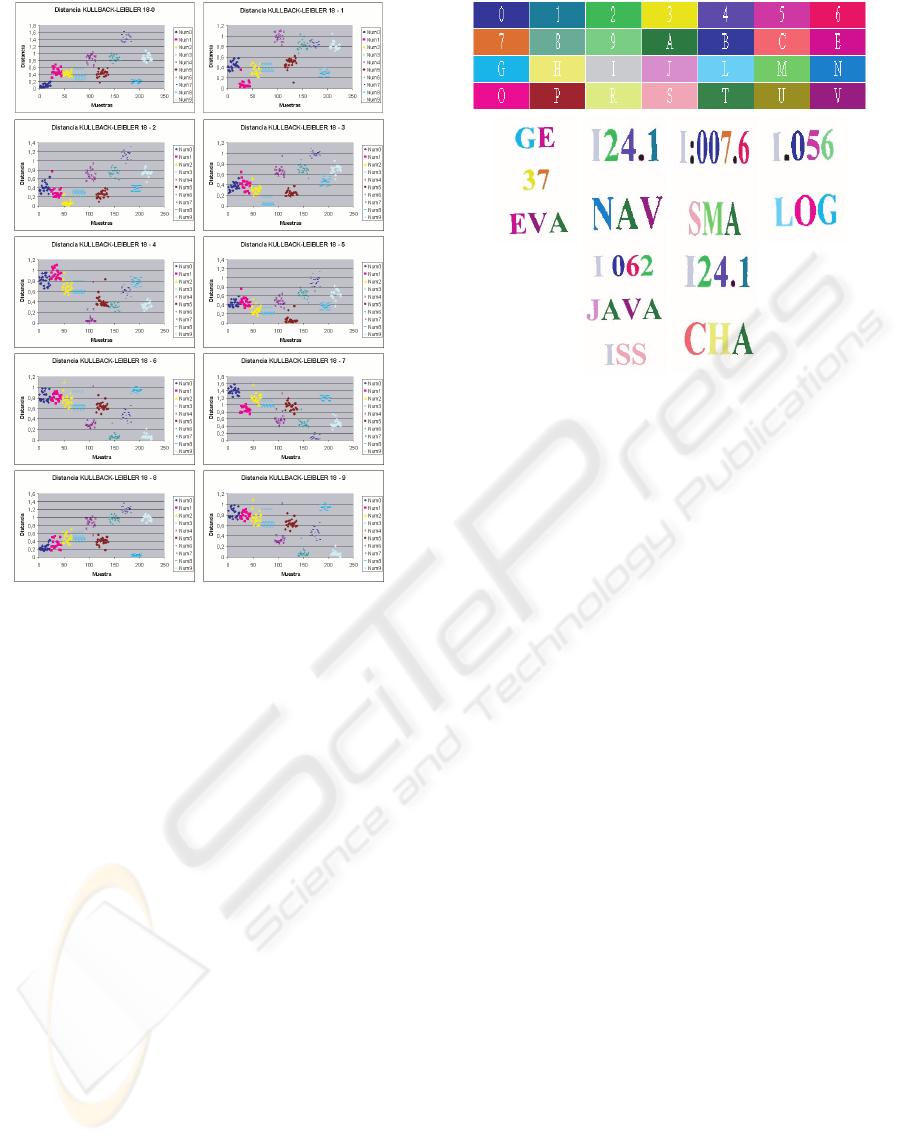
Figure 14: Kullback-Leibler Distance.
procedure for classification is k-nearest neighbour,
the original image are in figure 10. A different colour
is assigned to each class (figure 15 up) and the classi-
fication obtained is in figure 15 bottom.
As we can see, the digit 1 and the letter I are cor-
rectly recognized, and digit 6 and digit 9 have the
same shape. Several proves to verify the distance his-
togram to Centroid have been made. The other digits
and letters are correctly recognized.
5 CONCLUSION
A unique feature to recognize objects is defined. The
main advantages are the elimination of the feature se-
lection process and avoiding the problem of dimen-
sionality.
The proposed system has been proved to be robust
to discriminate between classes in a given set of ob-
jects. It could also be applied to other kind of objects
when a fast classification is needed.
As a future work, we propose studying the adequate
number of categories for each database case. We also
plan to design a new suitable classification method to
work in real time.
Figure 15: Recognized objects.
REFERENCES
Arques, P., Aznar, F., Pujol, M., and Rizo, R. (2005). Seg-
mentacin de imgenes en tiempo real mediante umbral-
izacin adaptativa. In In 11th Conference of the Spanish
Association for Artificial Intelligence.
Duda, R., Hart, P., and Strok, D. (2001). Pattern Classifica-
tion. John Wiley and sons, New York, 2nd edition.
Fontoura, L. D. and Marcondes, R. (2001). Shape Analysis
and Classification. Theory and Practice. CRC Press.
Marr, D. (1982). Vision. W.H. Freeman and Company.
Papathomas, T. (1996). Special issue on visual-perception:
Guest editorial. In In International Journal of Imaging
System and Technology.
Pitas, I. (2000). Digital Image Procession. Algorithms and
Applications. John Wiley and sons, New York, 1st
edition.
Theodoridis, S. and Koutroumbas, K. (1999). Pattern
Recognition. Academic Press, London.
DISTANCE HISTOGRAM TO CENTROID AS A UNIQUE FEATURE TO RECOGNIZE OBJECTS
497
