
OUTLIER DETECTION AND VISUALISATION IN HIGH
DIMENSIONAL DATA
Baya Lydia BOUDJELOUD, François POULET
ESIEA Recherche
38, rue des docteurs Calmette et Guérin
Parc Universitaire de Laval-Changé, 53000 Laval
Keywords: Data Mining, outlier detection, data visualisation, genetic algorithm, high dimensional data.
Abstract: The outlier detection problem has important app
lications in the field of fraud detection, network robustness
analysis, and intrusion detection. Such applications have to deal with high dimensional data sets with
hundreds of dimensions. However, in high dimensional space, the data are sparse and the notion of
proximity fails to retain its meaningfulness. Many recent algorithms use heuristics such as genetic
algorithms, the taboo search... in order to palliate these difficulties in high dimensional data. We present in
this paper a new hybrid algorithm for outlier detection in high dimensional data. We evaluate the
performances of the new algorithm on different high dimensional data sets, and visualise its results for some
data sets.
1 INTRODUCTION
The data stored in the world are rapidly growing. This
growth of databases has far outpaced the human ability to
interpret this data creating a need for automated analysis
of databases. Knowledge Discovery in Databases (KDD)
is the non-trivial process of identifying valid, novel,
potentially useful, and ultimately understandable patterns
in data (Fayyad & al. 1996). The KDD process is
interactive and iterative, involving numerous steps. Data
mining is one of the steps of KDD which has attracted a
lot of research. This paper focus on outlier detection, an
important part of data mining. An outlier is a data subset,
an observation or a point that is considerably dissimilar,
distinct, or inconsistent with the remainder of data. It may
seem that outliers are noise and must be identified and
eliminated. The outlier detection has many applications
such as the fraud detection, pharmaceutical research,
financial applications, marketing, etc. Let us consider for
example the problem of detecting credit card fraud. A
major problem that credit card companies face is illegal
use of lost or stolen credit cards. Detecting and preventing
such use is critical since credit card companies assume
liability for unauthorized expenses on lost or stolen cards.
Since the usage pattern for a stolen card is unlikely to be
similar to its usage prior to being stolen, the new usage
points are probably outliers. Detecting these outliers is
clearly an important task. The problem is then to define
this dissimilarity between objects, which is what
characterizes an outlier. Typically, this is estimated by a
function calculating the distance between objects, the
following task consists in determining the objects more
distant from the mass. Some difficulties appear when we
want to know the fact that some attribute (dimensions)
have importance in the detection of some outliers,
particularly in high dimensional data. Indeed, some
objects can be outliers for some dimensions, while these
same elements cannot be considered as outliers for other
dimensions. In the opposite case, some dimensions can be
relevant for an outlier, while these same features can be
irrelevant for another outlier. Many recent algorithms use
the concept of proximity in order to find outliers based on
their relationship to the rest of the data. However, in high
dimensional space, the data are sparse and the notion of
proximity fails to retain its meaningfulness. Indeed, the
sparsity of high dimensional data implies that every point
is an almost equally good outlier from the perspective of
proximity-based definitions. Consequently, for high
dimensional data, the notion of finding meaningful outliers
becomes substantially more complex and non-obvious.
Outlier detection is an integral part of data mining and has
attracted much attention recently; (Barnett & al. 1994,
Knorr & al. 1998, Aggarwal & al. 2001). We can find a
485
Lydia BOUDJELOUD B. and POULET F. (2004).
OUTLIER DETECTION AND VISUALISATION IN HIGH DIMENSIONAL DATA.
In Proceedings of the Sixth International Conference on Enterprise Information Systems, pages 485-488
DOI: 10.5220/0002656004850488
Copyright
c
SciTePress

synthesis of outlier detection in (Rock & al. 1999). We
propose in this paper, a hybrid algorithm for outlier
detection in high dimensional data, implying a genetic
algorithm for the selection of a subset of attributes, and a
distance-based approach for outlier detection in this subset
of attributes.
2 HYBRID ALGORITHM FOR
OUTLIER DETECTION
Genetic algorithms (Holland 1975) are stochastic search
techniques based on the mechanism of natural selection
and reproduction. GA starts with an initial set of random
solutions called population and each individual in the
population is called a chromosome representing a
combination of dimensions. Each chromosome is
composed of a set of elements called genes. At each
algorithm iteration called generation, all newly generated
chromosomes are evaluated by a fitness function to
determine their qualities. Good chromosomes are selected
to produce offspring chromosomes through genetic
operators: crossover and mutation. After several
generations, the algorithm converges to a chromosome
that is very likely to be an optimal or a solution very close
to the optimum. Our genetic algorithm starts with a
population of 30 individuals (chromosomes), every
individual is made of 4 genes (the number of genes can
vary from 2 to 8 or plus, according to the data set). The
individuals are made of a subset of dimensions (attributes)
that describe the data set. We evaluate each chromosome
of the population by an Euclidean distance-based
procedure. For a subset of attributes, we compute the
distance between every element and all the elements of the
data set (Procedure 1), and procedure 2, we determine the
gravity centre of the data set in the subset of attributes, and
then we calculate the distance between every element and
the gravity centre of the data set. These procedures get the
element that is far from the remainder of data, and the
distance that separates this point from the remainder of
data. Once the population is evaluated and sorted, we
operate a crossover on two parents chosen randomly.
Next, one of the children is mutated with a probability of
1/10, and an individual is substitute randomly in the
second part of population, under the median. The genetic
algorithm finishes after a maximum number of iterations,
or after a maximum number of crossovers or of mutations,
without improvement of the solution.
The algorithm complexity depends on the number of times
where we call the two procedures. We have 4 variants of
algorithm. AG_P1_Opt: Genetic algorithm using the
optimized cut-point crossover, and the procedure 1 as
evaluation function. AG_P2_Opt: Genetic algorithm
using the optimized cut-point crossover, and the procedure
2 as evaluation function. AG_P1_Ran: Genetic algorithm
using the random cut-point crossover, and the procedure 1
as evaluation function. AG_P2_Ran: Genetic algorithm
using the random cut-point, and the procedure 2 as
evaluation function.
3 TESTS AND VISUALISING
RESULTS
In order to test our algorithm, we compare the results of
the different versions of our algorithm. They were
implemented in C/C++ on a PC pentium IV, 1,7 GHz,
Linux. We tested the outlier detection on the following
data sets: Shuttle, Picture Segmentation, (from the UCI
machine learning repository) and Lung Cancer (from
Jinyan & al. 2002). These data sets are described in table
1. First, we evaluate these algorithms for D = 4, size of the
attributes subset (dimensions). The results are shown in
table 2.
Data sets classes Attributes data points
Shuttle 7 9 43500
Segmentation 7 19 2310
Lung Cancer 2 12533 32
Table 1: data sets description
data set Shuttle Segmen-
tation
Lung
Outlier - 1683
10
AG
_P1
Opt
Attri-
butes
subset
- 4-6-8-17
5936-3834
-8431-350
Outlier 26711 1683 10 AG
_P2
Opt
Attri-
butes
subset
0-2-4-8 5-6-7-8 2823-
11953
-5936-
12232
Outlier - 1683 10 AG
_P1
Ran
Attri-
butes
subset
- 4-5-6-8 2330-890-
5936-7230
Outlier 26711 1683 10 AG
_P2
Ran
Attri-
butes
subset
0-2-4-8 5-6-7-8 7408-202-
5936-
12307
Table 2: Results of the algorithms with D=4
There is no result for AG_P1 with Shuttle data set because
the number of data points is too large. Indeed, it is
necessary to calculate and store in memory the distances
between an individual and each of the others, for all the
individuals (objects). This requires a memory size larger
than the available one (even with virtual memory i.e. hard
disk swap file). In the case of the procedure P2, this
ICEIS 2004 - ARTIFICIAL INTELLIGENCE AND DECISION SUPPORT SYSTEMS
486
calculation is carried out once: all individuals are
compared with the gravity centre. We note that AG_P2
(randomly or optimised) detect the outlier point in the
same attribute subset, (0, 2, 4 and 8) for the Shuttle data
set and (5, 6, 7 and 8) for the Segmentation data set. For
the Lung cancer data set, we found the same outlier set,
but only one attribute (5936) is found in all cases. The
number of attributes of the Lung cancer data set (12533
attributes) can explain this result. The four algorithms
found the same outlier point in the same attributes subset
for all data sets (except lung, we explained why). Then we
tried to evaluate the importance of the attribute subset size
(D). The results are shown in table3 (Shuttle), table 4
(Segmentation) and table 5 (Lung).
Shuttle D=1 D=2 D=3 D=4 D=9
Attri-
butes
subset
4 2-4 0-2-4 0-2-
4-8
0-…-8
Outlier 26711 26711 26711 2671
1
26711
Segmen
tation
D=1 D=2 D=3 D=4 D=6
D=
19
Attri-
butes
subset
8 6-8 6-7-
8
5-6-
7-8
2-5-
4-6-
7-8
0-…-
18
Outlier 1683 1683 1683 1683 1683 1683
Lung D=1 D=2 D=4 D=6 D=
6000
D=
12533
Attri-
butes
sub
set
5936 5936
-
6038
5103-
3476-
5936-
2329
11472
3613-
3086-
10507
5936-
1430
5936
-….-
1730
0-…-
12532
Out-
lier
10 10 10 10 10 10
For all the data sets we can see the results are the same
whatever the subset dimension is. This is only this
particular value of one attribute that makes the point
significantly different from the other ones. There is no
need to compute the distance with all the attributes.
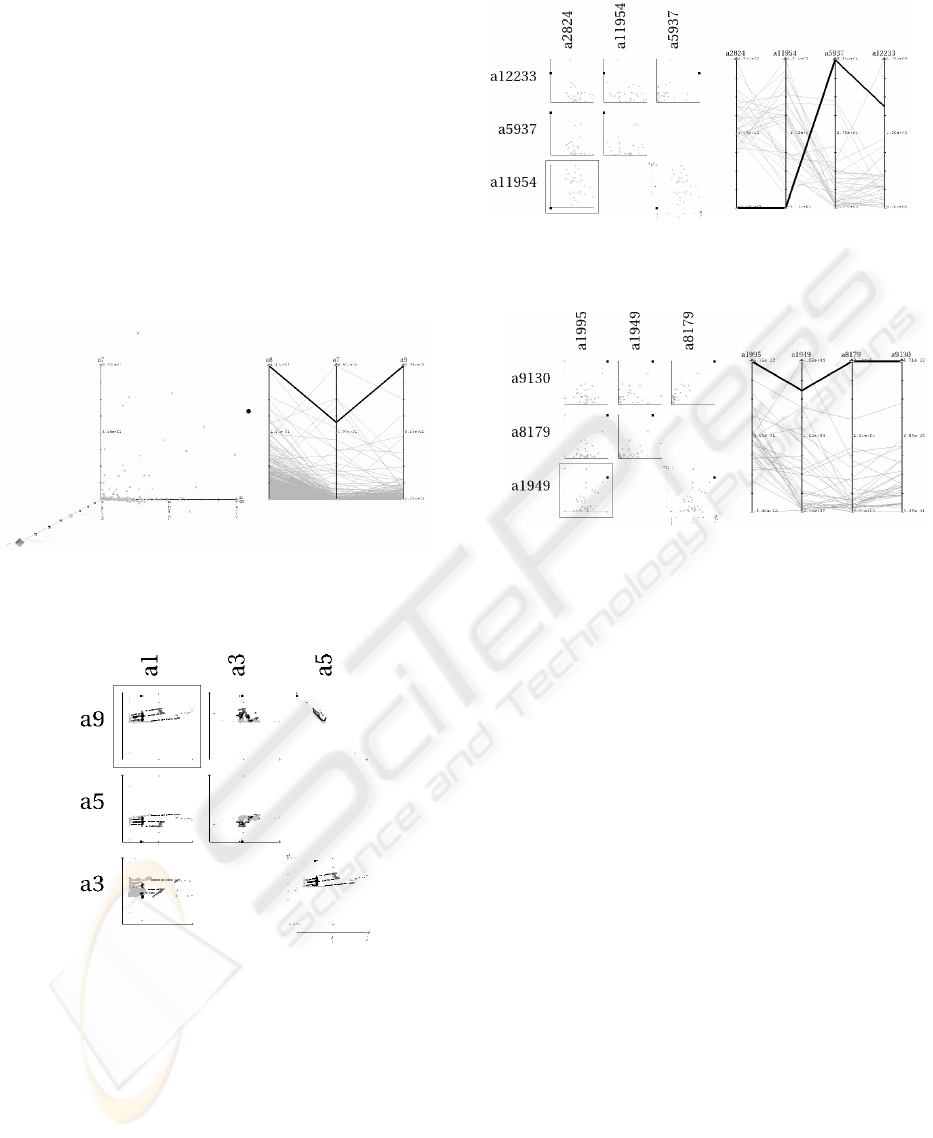
Then we visualise these results using both parallel-
coordinates (Inselberg, 1985) and 2D (Fig.3a and 3b) or
3D (Fig. 1) scatter-plot matrices (Becker, 1987), to try to
explain why these points are different from the other ones.
The 2D scatter-plot matrices are the 2D projections of the
data points according to all possible pairs of attributes and
the 3D scatter plot matrix is a 3D projection of the n-
dimensional data points.
These kinds of visualisation tools allow the user to see
how far from the others is the outlier. For example in
figure 3, we can easily see the outlier has extreme values
along three attributes (the left ones, the first two being
minimum values and the last one being a maximum
value).
4 CONCLUSION AND FUTURE
WORK
In this paper, we have presented a hybrid algorithm for
outlier detection, which is especially suited for high
dimensional data sets. Conventional approaches compute
the distance with the all the attributes and so are unable to
deal with large number of attributes (because of the
computational cost). Here, we have only to find the best
significant attribute subset to efficiently detect the outliers.
The main idea is to combine attributes in a reduced subset
and find the combination where we can detect the best
outlier point, the point that is farthest from the other ones
in the whole data set. Some numerical tests have shown
that the new algorithm is able to significantly reduce the
research space in term of dimensions without any loss of
quality result. Then we visualise the obtained results with
scatter-plot matrices and parallel coordinates to try to
explain the results and show the attributes relevant for
making a point an outlier. These visualisation tools show
the outlier point is farthest from the other ones. A first
forthcoming improvement will be to try to qualify the
outlier: is it an error or only a point significantly different
from the other ones? We also will try to extend this
algorithm for the clustering task in high dimensional data.
We think that it must be possible to find good clusters in
reduced dimensional data set. Another subject will be to
try to find a low cost evaluation function, like a function
evaluating the combination of attribute subset to improve
the execution time.
Table 3: AG_P2_Opt Results (Shuttle data set)
Table 4: AG_P2_Opt Results (Segmentation data set)
Table 5: AG_P2_Opt Results (Lung Cancer data set)
REFERENCES
Aggarwal C.C., Yu P.S., 2001. Outlier detection for high
dimensional data, ACM Press New York, NY, USA,
Periodical-Issue-Article, pp 37 - 46.
Barnett V., Lewis T., 1994. Outliers in statistical data,
John Wiley.
Becker, R., Cleveland, W. and Wilks, A. 1987 "Dynamic
graphics fordata analysis," Statistical Science, 2, pp
355-395.
Fayyad U. , Piatetsky-Shapiro G., Smyth P. , 1996. From
Data Mining to Knowledge Discovery in Databases, AI
Magazine Vol. 17, No. 3, pp 37-54.
OUTLIER DETECTION AND VISUALISATION IN HIGH DIMENSIONAL DATA
487
Holland J., 1975. Adaptation in Natural and Artificial
Systems. University of Michigan Press, Ann Arbor,.
Inselberg, A., 1985: The Plane with Parallel Coordinates,
Special Issue on Computational Geometry, The Visual
Computer, Vol.1, pp.69-97.
Jinyan L., Huiqing L., 2002. Kent ridge bio-medical dat
set repository, http://sdmc.-lit.org.sg/GEDatasets.
Knorr E., Ng R., 1998. Algorithms for mining distance-
based outliers in large data sets. VLDB Conference
Proceedings, September.
Rocke D. M. and Woodruff D. L., 1999. A Synthesis of
Outlier Detection and Cluster Identification, Working
Paper, University of California.
Figure 3a: Visualisation AG_P2_Opt Results
for Lung Cancer data set
Figure 1: Visualisation AG_P2_Opt Results
for Segmentation data set
Figure 3b: Visualisation AG_P2_Opt Result for
Lung Cancer data set
Figure 2: Visualisation AG_P2_Opt Results
for Shuttle data set
ICEIS 2004 - ARTIFICIAL INTELLIGENCE AND DECISION SUPPORT SYSTEMS
488
