
RELATIONAL SAMPLING FOR DATA QUALITY AUDITING
AND DECISION SUPPORT
Bruno Cortes
Instituto Politécnico do Cávado e Ave, Barcelos, Portugal
José Nuno Oliveira
Departamento de Informática da Universidade do Minho, Braga, Portugal
Keywords: Fuzzy logic, data sampling, estimation and data quality.
Abstract: This paper presents a strategy for applying sampling techniques to relational databases, in the context of
data quality auditing or decision support processes. Fuzzy cluster sampling is used to survey sets of records
for correctness of business rules. Relational algebra estimators are presented as a data quality-auditing tool.
1 INTRODUCTION
In the last few years, many companies around the
world have spent large amounts of resources on
process re-engineering encompassing both
applications and data. Voluminous data sets, in
particular those extracted from the Web, have
become a serious problem to those companies whose
intended information profit is eventually put at risk
because of data management costs.
As a matter of fact, it is hard to support and
maintain the quality of fast-growing data. These
very rapidly become infected with so-called “dirty”
data, a problem nowadays identified under the data
quality heading. The risk of deterioration, which is a
real menace, is worsened by the complexity of the
information contained in many legacy systems (with
many years of age) that are still in use today.
In this context, data quality auditing emerges as
a relevant business area. Even the most advanced
database management systems (DBMS) are still
unable to cope with subtle semantic dependences
that cannot be expressed in standard DBMS
languages and systems. Popularly known as business
rules, such dependencies can only be captured by
mathematical formulae over the target data. Such
(temporal) logic predicates are referred to as
datatype invariants in the literature of formal
methods for software design (Oliveira, 1997).
Data quality auditing of complex business rules
requires resource-consuming batch processing,
whose complexity is proportional to the volume of
the data under test, mostly because of the CPU
bandwidth needed to process the conjunction of
logical predicates – some of them complementing
themselves, others sharing the domain of analysis.
In the industrial world, sampling - a standard
strategy for ensuring the quality of manufactured
products - is easy to implement because the
manufacturing process itself can be analysed
independently of other processes in the organization.
In the database domain, however, data is always
inter-related and several processes can induce
mutual dependencies that are not explicit in the
database schema.
Until the last decade, there was a lack of
knowledge about how to build good samples in
databases (Olken, 1993). In creating samples, one
has to deal with factors such as existential and
referential integrity, data distribution and correlated
variables, among other issues.
Some auditing processes often find it useful to
consider closed and consistent samples (Bisbal and
Grimson, 2000), because they can report the
behaviour and performance of information systems
and applications. In most cases, however, what
auditors look for is the real state of data. Data
samples must therefore reflect the same errors, the
same behaviour and the same (lack of) quality as the
original database.
376
Cortes B. and Nuno Oliveira J. (2004).
RELATIONAL SAMPLING FOR DATA QUALITY AUDITING AND DECISION SUPPORT.
In Proceedings of the Sixth International Conference on Enterprise Information Systems, pages 376-382
DOI: 10.5220/0002630403760382
Copyright
c
SciTePress

This paper describes the data sampling
techniques developed as a basis for the data analysis
component of a data quality software system based
on formal methods (Ranito et al., 1998 and Neves,
Oliveira et al, 1999).
2 FUZZY CLUSTERING FOR
SAMPLING
Several methods can be used to approach sampling
in databases (Olken, 1993) but, in particular,
weighted and stratified sampling algorithms appear
to produce best results on data quality auditing.
Whenever processes are concerned with small
amounts of data exhibiting similar behaviour, the
exceptions and problems emerge in a faster way.
Fuzzy clustering is an interesting technique to
produce weights and partitions for the sampling
algorithms. The creation of partitions is not a static
and disjoint process. Records have a chance to
belong to more than one partition and this will
reduce the sampling potential error, since it is
possible to select a relevant record
1
during the
sampling of subsequent partitions, even when it was
not selected in the partition that shared more similar
values with it. The same probabilities can also be
used to produce universal weighted samples.
The Partition Around Method (Kaufman and
Rousseeuw, 1990) is a popular partition algorithm
where the k-partitions method is used to choose the
centred (representative) element of each partition,
whereupon the partitions’ limits are established by
neighbourhood affinity. The fuzziness introduced in
the algorithm is related with the dependency
between probability of inclusion in a partition and
the Euclidean distance between elements, not only
regarding the nearest neighbour but also other
partitions’ representatives.
2.1 K-partitions method
For a given population, each record is fully
characterized wherever it is possible to know every
value in all p attributes. Let x
it
represent the value of
record i in attribute t, 1 ≤ t ≤ p. The Euclidean
distance d(i,j)
2
between two records, i and j, is given
by:
22
11
)(...)(),(
jpipji
xxxxjid −++−=
1
Critical record in terms of data quality.
2
d(i,j) = d(j,i)
If necessary, some (or all of the) attributes must
be normalized to avoid that different domains affect
with more preponderance the cluster definition. The
common treatment is the calculation of the mean
value of an attribute and its standard deviation (or
mean absolute deviation as an alternative).
The k-partitions method defines as first
partition’s representative the element that minimizes
the sum of all the Euclidean distances to all the
elements in the population. The other representatives
are selected according to the following steps:
1. Consider an element i not yet selected as a
partition’s representative.
2. Consider element j not yet selected and denote
by D
j
its distance to the nearest representative of
a partition, already selected. As mentioned
above, d(j,i) denotes its distance to element i.
3. If i is closer to j than its closest representative,
then j will contribute for the possible selection i
as a representative. The contribute of j for the
selection of i is expressed by the following gain
function:
)0),,(max( ijdDC
jji
−
=
4. The potential of selection of individual i as
representative is then given by:
∑
j
ji
C
5. Element i will be selected as representative if it
maximizes the potential of selection:
∑
j
jii
Cmax
2.2 Fuzzy Clustering probabilities
After defining the partitions‘ representatives, it is
possible to set a probability of inclusion of each
element in each one of the k partitions established,
based on the Euclidean distance between elements.
A representativeness factor f
r
is set according to
the relevance of an element in the context of each
cluster. Empirical tests indicate this factor to be 0.9
when dealing with a partition’s representative and
0.7 for all the others (Cortes, 2002). The
algorithm’s definition is described below
3
:
3
For a full description see (Cortes, 2002).
RELATIONAL SAMPLING FOR DATA QUALITY AUDITING AND DECISION SUPPORT
377

1. Let D
i
be the sum of the Euclidean distances
d(i,m) of element i to all partition’s
representatives (1 ≤ m ≤ k) and j be its nearest
partition’s representative.
2. The probability of selection of i as an element of
the partition represented by j is given by:
⎟
⎟
⎠
⎞
⎜
⎜
⎝
⎛
−×=
i
j
D
jid
frP
),(
1
3. The probability of selection of i as an element of
any other partition v, v ≠ j, is given by:
⎟
⎠
⎞
⎜
⎝
⎛
⎟
⎠
⎞
⎜
⎝
⎛
−×−=
i
v
D
jid
frP
),(
11 ,
when k = 2
⎟
⎟
⎟
⎟
⎟
⎠
⎞
⎜
⎜
⎜
⎜
⎜
⎝
⎛
⎟
⎟
⎠
⎞
⎜
⎜
⎝
⎛
−−−
−
×
⎟
⎟
⎠
⎞
⎜
⎜
⎝
⎛
−=
i
j
i
v
D
jid
k
P
D
vid
P
),(
11
1
),(
1
when k > 2.
3 ESTIMATING ALGEBRA
OPERATIONS
Data quality auditing processes, including business
rules validation, can be implemented as a sequence
of algebra operations over large sets of data.
As a rule, these operations are chained according
to complex precedence graph. This is why auditing
is a high resource consuming process. When the
auditing reports are more concerned with relative
errors than with their actual identification, sampling
and estimation become less expensive alternatives to
be taken into account.
3.1 Estimating data quality with join
operations
Several studies have been made to try to determine
the query size of a join operation between two tables
(Lipton, Naughton et al., 1990), whether all the
parameters are available for analysis or not (Sun,
Ling et al, 1993), based on sampling analysis.
Join operation with key attributes
Starting with the work presented in (Lipton,
Naughton et al., 1990), a query result can be
analysed as a set of disjoint clusters, sharing the
same values in the joining attributes. The query size
equals the sum of the size of all clusters. If the join
of two tables R∞S resorts to key attributes of R then
the size of each cluster mentioned above depends on
the number of records in S that share the same
values in the joining attributes.
To estimate the query size α of such a join
operation, we treat the result as a set of n clusters
(there are n distinct values in the key attributes of
relation R), and α = Σ
i
a
i
, with 1 ≤ i ≤ n, where a
i
is
the estimation of the number of records in S that
share the same i key value of R.
Let b be a major limit of a
i
and A the equivalent
metric regarding α, the size of a cluster and the size
of the join itself. Set a confidence level of p to the
sampling process, with two limits, k
1
and k
2
,
determined by:
p
k
−
=
1
1
1
p
k
−
≥
1
1
2
Accuracy is established by two given parameters
δ and ε, while the error in the estimator  will be
limited by the maximum of A/δ and A/ε. The
estimation process is described as follows:
let s Å 0
let m Å 0
while (s<k
1
bδ(δ+1) ∧ m<k
2
ε
2
) do
s Å s + a
Sampling({1,…,n})
m Å m + 1
wend
 Šns / m
The calculation of k
1
and k
2
and the proofs of the
following theorems can be found in (Lipton,
Naughton et al., 1990).
Theorem 3.1: If the estimation process ended
because s < k
1
bδ(δ+1) then the estimation error in Â
if less then A/δ with a confidence level of p.
Theorem 3.2: If the estimation process ended
because m < k
2
ε
2
, then the estimation error in  if
less then A/ε, with a confidence level of p.
ICEIS 2004 - DATABASES AND INFORMATION SYSTEMS INTEGRATION
378

The major limit A of the operation is the actual
size of the operation (and it is supposed to have
existential and referential integrity problems, since
we dealing with legacy, dirty data). Since estimator
 represents the estimated size of a supposed join
operation with clean data, it is possible to assert,
with confidence level p, that the number of records
that must be ensured to guarantee the quality of a
rule implemented using this join operation lay within
the interval
[(A-(Â+err), A-(Â-err)]
when A-(Â+err)>0 and within the interval
[0, A-(Â-err)]
when A-(Â+err)<0, where err is A/δ or A/ε,
depending on the stop condition of the process.
Join with non-key attributes
Should non-key attributes be used in a join
operation R∞S then the query size will also depend
on the number of records in R that share the same
values in the join domain. In general terms, the
major limit A is now depending on the average
number of records in relation R that share the same
values in join attributes; in other words, to produce a
confident limit A, we must calculate the size of
relation S times the size of relation R and divide the
result by the number of distinct values in join
attributes of relation R.
To estimate the number of distinct values of a
population several estimators can be used, such as
Chao, Jackknife, Shlosser or Bootstrap, among
others (Hass, Naughton et al., 1995). From this set,
Jackknife and Shlosser usually produce the best
results
4
.
The Jackknife estimator can be calculated from a
sample of n records, with d
n
distinct values in the
sample, from an initial population with N records.
For each k element in the sample, 1 ≤ k ≤ n, let d
n-
1
(k) denote the number of distinct values in the
sample after removing the k element (if k is unique
d
n-1
(k)=d
n
-1, otherwise d
n-1
(k)=d
n
). Calculating d
n-
1
(k) for all the elements of the sample and dividing it
by the sample size n, yields:
()
n
kd
d
n
k
n
n
∑
=
−
−
=
1
1
1
)(
4
Limitations of the mentioned estimators are out of
the scope of this paper.
The first order of the Jackknife estimator is then:
))(1(
1 nnn
jk
ddndD −−−=
−
On the other hand, the Shlosser estimator is
given by:
∑
∑
=
−
=
×−×
×−×
+=
n
i
i
i
n
i
i
i
n
Shlosser
fqiq
fqf
dD
1
1
1
1
)1(
)1(
where q represents the n/N sampling probability
and f
i
is the number of values in the sample that
occur exactly i times.
To produce best results, the choice between the
Shlosser and the Jackknife estimators is determined
by a uniformity test χ
2
in the sampled population.
Considering a sample of size n with d distinct
values, let m = n/d and
()
2
0:
∑
>
−
=
j
nj
j
m
mn
u
For n > 0 and 0 < ϕ < 1, x
n-1,ϕ
is the real number
that satisfies P(χ
2
< x
n-1,ϕ
) = ϕ, with n-1 degrees of
freedom.
According with the χ
2
test, if u ≤ x
n-1,ϕ
, then the
sample is particularly uniform and the Jackknife
estimator should be used. The Shlosser estimator
should be used otherwise.
3.2 Estimating data quality with
selection operations
The implementation of business rules over a sample
of a selection operation σ
pr
(which will select all
records in the relation when pr ≡ true), is
transparent to the validation process
5
because
sampling and selection are commutative operations:
ψ(n,σ
pr
(R)) ≡ σ
pr
(ψ(n,R))
This holds because, in both situations, the
sampling probability for those records that do not
validate pr is null while the others share a
probability of p = n/Nσ
pr
when dealing with random
sampling.
5
When the selection is established for independent
variables.
RELATIONAL SAMPLING FOR DATA QUALITY AUDITING AND DECISION SUPPORT
379

The same criteria can be used for dependent
variables, namely those involved in a referential
integrity dependencies. In these cases, it is necessary
to look at the join operation as a unique independent
set prior to dealing with the selection operation
itself.
4 TESTS AND RESULTS
The theory presented in this paper has been
implemented and tested in industrial environments,
during the auditing and migration stages of decision
support solutions, under the edge of national funded
project Karma (ADI P060-P31B-09/97).
Table 1 refers to the auditing results in a
Enterprise Resource Planning System of a small
company, regarding its sales information.
In this database, although the relational model
was hard-coded in the application, the engine didn’t
implement the concept of referential integrity.
The referential integrity between the Orders
table and the OrderDetails table, as well as the
referential integrity between Orders and Customers
tables and between OrderDetails and Products
tables, have been tested using sampling auditing and
full auditing processes. To evaluate the samples’
behaviour when dealing with independent variables,
the mean value of a purchasing order as well as the
number of items in regular order were calculated for
the samples. These values were also compared with
real observations in the entire tables. From the final
results some conclusions were taken:
a) The validation of referential integrity over
samples using a classification of the population
presents poor results when dealing with small
samples, with estimations above the real values.
b) The validation of existential integrity (for
example the uniqueness), under the same
circumstances, presents poor results when
dealing with small samples, with estimations
bellow the real values.
c) Mean values and distribution results are also
influenced by the scope of the sample, and must
be transformed by the sample size ratio.
For the referential integrity cases, this is an
expected result since the set of records in the
referring table (say T
1
) is much larger than the strict
domain of the referred table (say T
2
). The error of
the estimator must be affected by the percentage of
records involved in the sample. Let:
• t
1
be the sample of the referring table T
1
;
• t
2
be the sample of the referred table T
2
;
• α
2
be the percentage of records of T
2
selected for
the sample (#t
2
/#T
2
);
• β(T
1
,T
2
) be the percentage of records in T
1
that
validates the R.I. in T
2
.
It would be expected that E[β(t
1
,t
2
)] = β(T
1
,T
2
),
but when dealing with samples in the referred table
(T
2
) the expected value will match E[β(t
1
,t
2
)] =
β(T
1
,T
2
) * α
2
. The estimated error is given by ε = 1-
β and therefore E[ε(t
1
,t
2
)] = 1-[1-ε(T
1
,T
2
)] * α
2
.
Table 1 and figures 1, 2 and 3 show the referential
integrity problems detected
ε(T
1
,T
2
), the sampling
error
ε(t
1
,t
2
) and the expected error value for each
case
E[ε(t
1
,t
2
)].
It is possible to establish the same corrective
parameter when dealing with existential integrity,
frequencies or distributions.
Several other tests were made in medium size
and large size databases, corroborating the results
presented above (Cortes, 2002).
Table 1: Referential integrity tests on a ERP database
(OD) OrderDetails, (O) Orders
(P) Products and(C) Customers tables
R.I.
ε(T
1
,T
2
) α
2
ε(t
1
,t
2
) E[ε(t
1
,t
2
)]
Sample I (90% confidence, 5% accuracy)
ODÆO 5.8% 25.3% 72.1% 76.1%
ODÆP 12.9% 77.3% 30.4% 32.6%
OÆC 4.7% 74.4% 27.2% 29.1%
Sample II (95% confidence, 5% accuracy)
ODÆO 5.8% 32.5% 66.6% 69.3%
ODÆP 12.9% 82.6% 23.0% 28.0%
OÆC 4.7% 81.1% 22.0% 22.8%
Sample III (98% confidence, 5% accuracy)
ODÆO 5.8% 40.4% 58.3% 61.9%
ODÆP 12.9% 86.6% 22.0% 24.5%
OÆC 4.7% 85.5% 19.0% 18.5%
Sample IV (99% confidence, 2% accuracy)
ODÆO 5.8% 83.7% 19.5% 21.1%
ODÆP 12.9% 97.3% 14.5% 15.2%
OÆC 4.7% 97.7% 7.5% 6.9%
Sample V (99.5% confidence, 1% accuracy)
ODÆO 5.8% 96.0% 9.4% 9.5%
ODÆP 12.9% 98.8% 14.4% 14.1%
OÆC 4.7% 98.8% 5.5% 5.8%
ICEIS 2004 - DATABASES AND INFORMATION SYSTEMS INTEGRATION
380
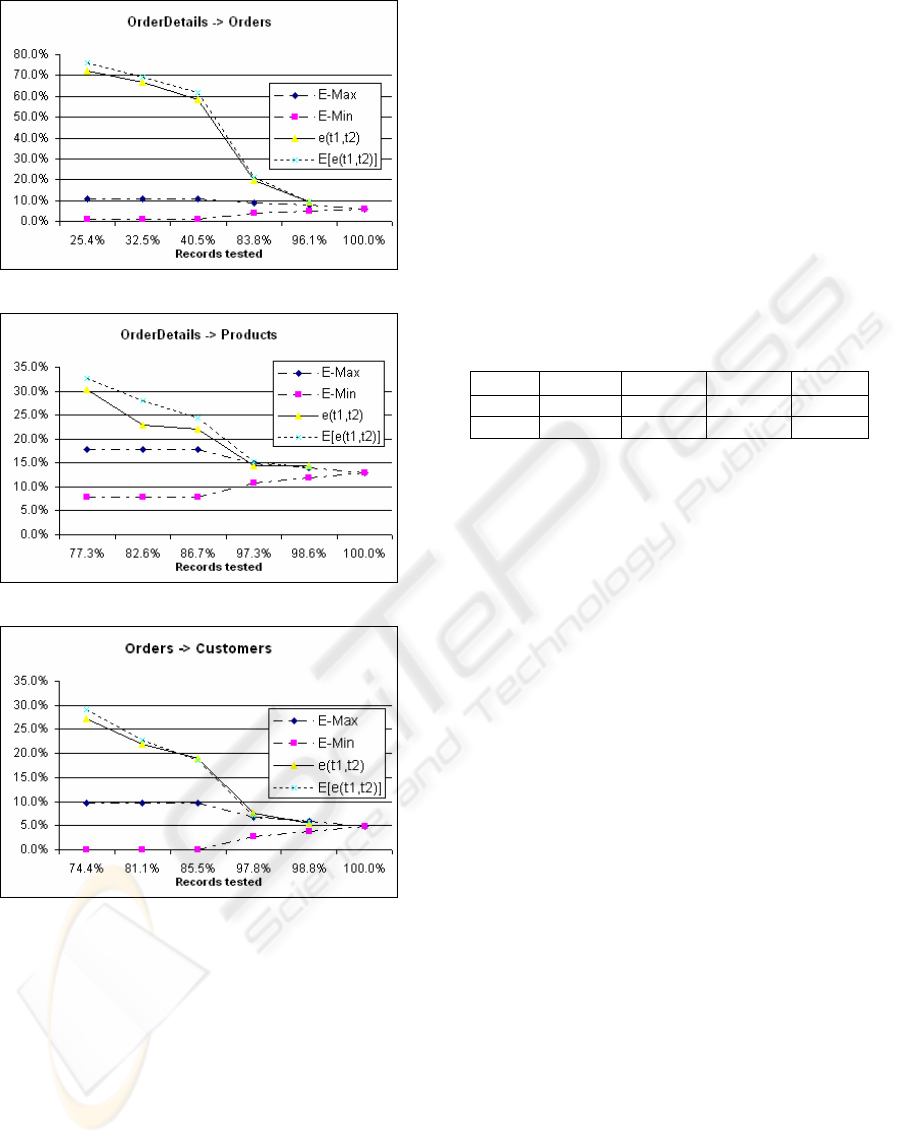
Figure 1: OrderDetailsÆ Orders dependency
Figure 2: OrderDetailsÆ Products dependency
Figure 3: OrdersÆ Customers dependency
The use of estimators to determine data quality
based on join and selection operations produces
good results, in particular when dealing with large
volumes of data. Table 2 indicates the results of
referential integrity estimations on an industrial
environment. The testing environment was a major
university database with data quality problems after
a partial database migration.
Since several records of students, courses and
grades were not completely migrated to the new
database, the RDBMS presented a poor behaviour in
terms of referential integrity, among other things.
To a more significant number of records
(between 700.000 to 1.000.000 or more), estimation
must be taken into consideration as a preliminary
auditing tool, saving time and resources. The
equivalent tests in the entire database universe took
several hours of CPU time in a parallel virtual
machine with 8 nodes.
In this particular case, the choice of the best
estimator was previously decided with an uniformity
test as describe in the previous chapter. Comparing
the number of students and courses in the university
with the number of grades, we might say that data is
contained within an almost uniform interval, which
makes it appropriate for the use of Jackknife
estimator. Several other tests were made and
reported in (Cortes, 2002).
Table 2: Integrity estimation on university IS
(G) Grades, (C) Courses and (S) Students tables
R.U. #T1
ε(T
1
,T
2
) ∞JK ε(t
1
,t
2
)
G-ÆS 711043 12.4% 563019 20.5%
GÆC 711043 59.4% 327185 55.0%
5 CONCLUSIONS AND FURTHER
WORK
The research described in this paper presents a
different strategy for data quality auditing processes
based on data sampling. Our strategy is particularly
useful if adopted at the earlier stages of an auditing
project. It saves time and resources in the
identification of critical inconsistencies and guides
the detailed auditing process itself. The
representative samples can further be used in
determining association rules or evaluating times
series, two areas more related with decision support
itself.
But even though the results achieved are
encouraging to proceed with this methodology, it is
important to be aware that:
• There is no perfect recipe to produce an universal
sample. Each case must be approached according
to the data’s profile – size, distribution,
dependencies among other issues – and auditing
purposes.
• Sampling will not produce accurate results, only
good estimators. It will give us a general picture
of the state of the art of a database, but more
accurate processes – such as data cleansing –
must involve an entire data set treatment.
The clustered analysis of data (“divide and
conquer”) maintaining data dependencies is an
efficient and accurate method and can be optimised
RELATIONAL SAMPLING FOR DATA QUALITY AUDITING AND DECISION SUPPORT
381

when implemented over parallel computing
platforms (Cortes, 2002).
Further research is under way to determine the
impact of incremental sampling of new data on the
previous analysis results. This is relevant because
information systems are living beings that evolve
through time. Another approach regards the
fuzziness of algebra operations (e.g. a selection is no
longer a true or false result, but will produce a
degree of selection (Andreasen, Christiansen et al.,
1997) and its impact on the overall sampling
analysis.
ACKNOWLEDGEMENTS
The work reported in this paper was funded by
research contract KARMA (ADI P060-P31B-09/97)
and Portuguese Governmental Institute (FCT
SFRH/BM/2358/2000)
.
BIBLIOGRAPHY
T. Andreasen, H. Christiansen and H. Larsen, “Flexible
Query Answering Systems”, ISBN 0-7923-8001-0,
Kluwer Academic Publishers, 1997
J. Bisbal and J. Grimson, “Generalising the Consistent
Database Sampling Process”. ISAS Conference, 2000
Bruno Cortes, “Amostragem Relacional”, MsC. Thesis,
University of Minho, 2002
P. Hass, J. Naughton et al., “Sampling-Based Estimation
of the Number of Distinct Values of an Attribute”, 21
st
VLDB Conference, 1995
Peter Haas and Arun Swami, “Sequential Sampling
Procedures for Query Size Optimization”, ACM
SIGMOD Conference, 1992
L. Kaufman and P. Rousseeuw, “Finding Groups in Data –
An Introduction to Cluster Analysis”, Wiley & Sons,
Inc, 1990
R. Lipton, J. Naughton et al., “Practical Selectivity
Estimation through Adaptative Sampling”, ACM
SIGMOD Conference, 1990
F. Neves, J. Oliveira et al., “Converting Informal Meta-
data to VDM-SL: A Reverse Calculation Approach”,
VDM workshop FM'99, France, 1999.
José N. Oliveira, “SETS – A Data Structuring Calculus
and Its Application to Program Development”,
UNU/IIST, 1997
Frank Olken, “Random Sampling from Databases”, PhD
thesis, University of California, 1993
J. Ranito, L. Henriques, L. Ferreira, F. Neves, J. Oliveira.
“Data Quality: Do It Formally?” Proceedings of
IASTED-SE'98, Las Vegas, USA, 1998.
A. Shlosser, “On estimation of the size of the dictionary of
a long text on the basis of sample”, Engineering
Cybernetics 19, pp. 97-102, 1981
Sun, Ling et at., “An Instant Accurate Size Estimation
Method for Joins and Selection in a Retrieval-Intense
Environment”, ACM SIGMOD Conference, 1993
Hannu Toivonen, “Sampling Large Databases for
Association Rules”, 22
nd
VLDB Conference, 1996
ICEIS 2004 - DATABASES AND INFORMATION SYSTEMS INTEGRATION
382
