METRICS FOR DYNAMICS: HOW TO IMPROVE THE
BEHAVIOUR
OF AN OBJECT INFORMATION SYSTEM
Jean -Louis Cavarero
Laboratoire CNRS / I3S, Sophia - Antipolis, France
María-José Escalona
Department of Languages and Computer Science. University of Seville
Keywords: Dynamic metrics, design and software evaluation, object oriented design, requirements costs, object design
measurement, events costs, system behaviour evaluation, optimisation tool
Abstract: If we ask about which is the main difference between modelling a system using a traditional model like the
entity relationship model or an object oriented model, from our point of view the answer is that, in the first
one, the processes are not located somewhere, and, in the second one, the processes (operations or methods)
are encapsulated in classes. The choice of the right classes to home every operation is essential for the
behaviour of the system. It is totally useless to design a well built system, according to a lot of statics
metrics, if the system does not run well after. In other words, dynamic metrics allowing to evaluate the
behaviour of a system when it runs are much more useful than any static metrics used to tell if the system is
correctly built or not. According to this, we propose in this paper, a new approach to evaluate a priori the
behaviour of a system, by taking into account the notion of event cost and the notion of time (which is
obviously essential). The final goal of this approach is to deliver information on the way operations have to
be placed in classes in order to get better performances when the system is running. However, the proposal
of metrics is of no value if their practical use is not demonstrated, either by means of case studies taken from
real projects or by controlled experiments. For this reason, an optimisation tool is being under construction
in order to provide solutions to this problem.
1 INTRODUCTION
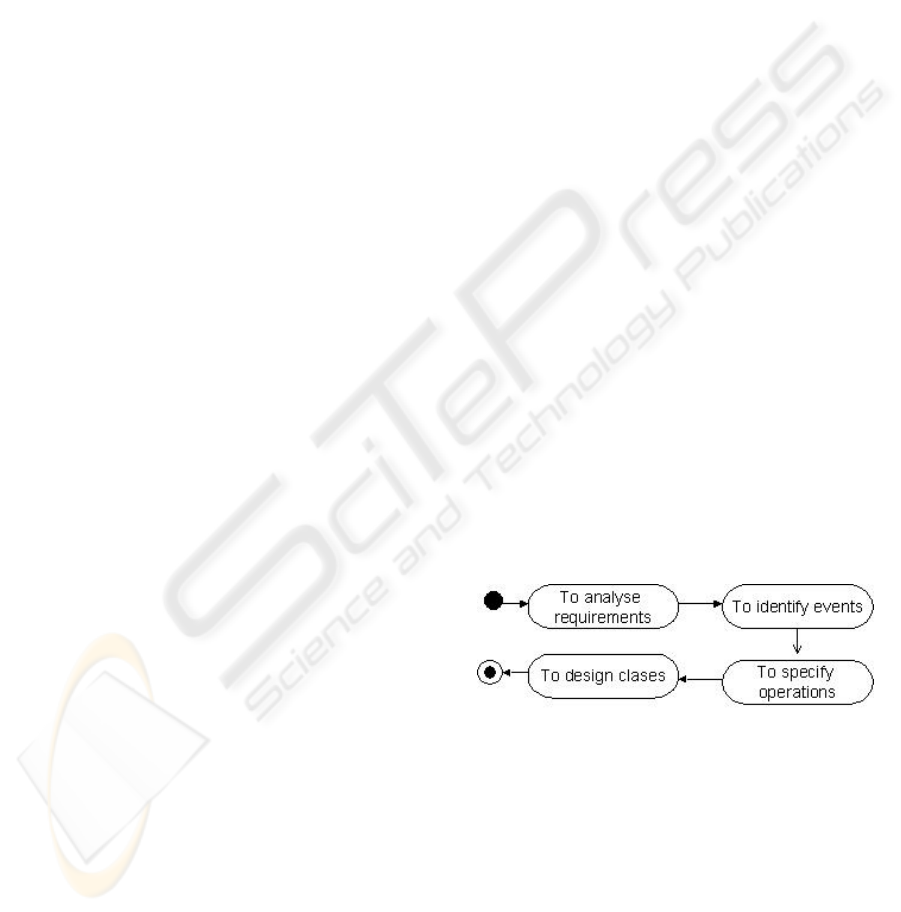
Basically the final goal of an object oriented design
is to build classes (and the best ones as possible).
There are a lot of different proposals of life cycles to
get them, but from our point of view, this process is
divided into four main steps as shown in figure 1
using an activity model (UML, 2003). The process
starts with the analysis of the requirements and from
this analysis, events must be identified. After,
operations must be specified and, finally, classes
will be designed.
Of course, there are a lot of others steps, but these
four steps seem to be the most important ones
because they are the most difficult ones whatever the
model is.
For instance, use cases provide a very
good approach to solve the first two steps, but it still
remains a tough work to do (Escalona, 2003).
Figure 1: The four mains steps of the class design
If we focus on steps 3 and 4, we can ask two
questions:
Step 3 : WHICH operations (methods) have to be
found out and specified to provide correct answers
to each event ?
Step 4 : WHERE are located these operations in
classes ?
We may note that the first three steps are not
specific to object oriented design. The first two ones
are exactly the same and the third one, which
344
Cavarero J. and Escalona M. (2004).
METRICS FOR DYNAMICS: HOW TO IMPROVE THE BEHAVIOUR OF AN OBJECT INFORMATION SYSTEM.
In Proceedings of the Sixth International Conference on Enterprise Information Systems, pages 344-349
DOI: 10.5220/0002598903440349
Copyright
c
SciTePress
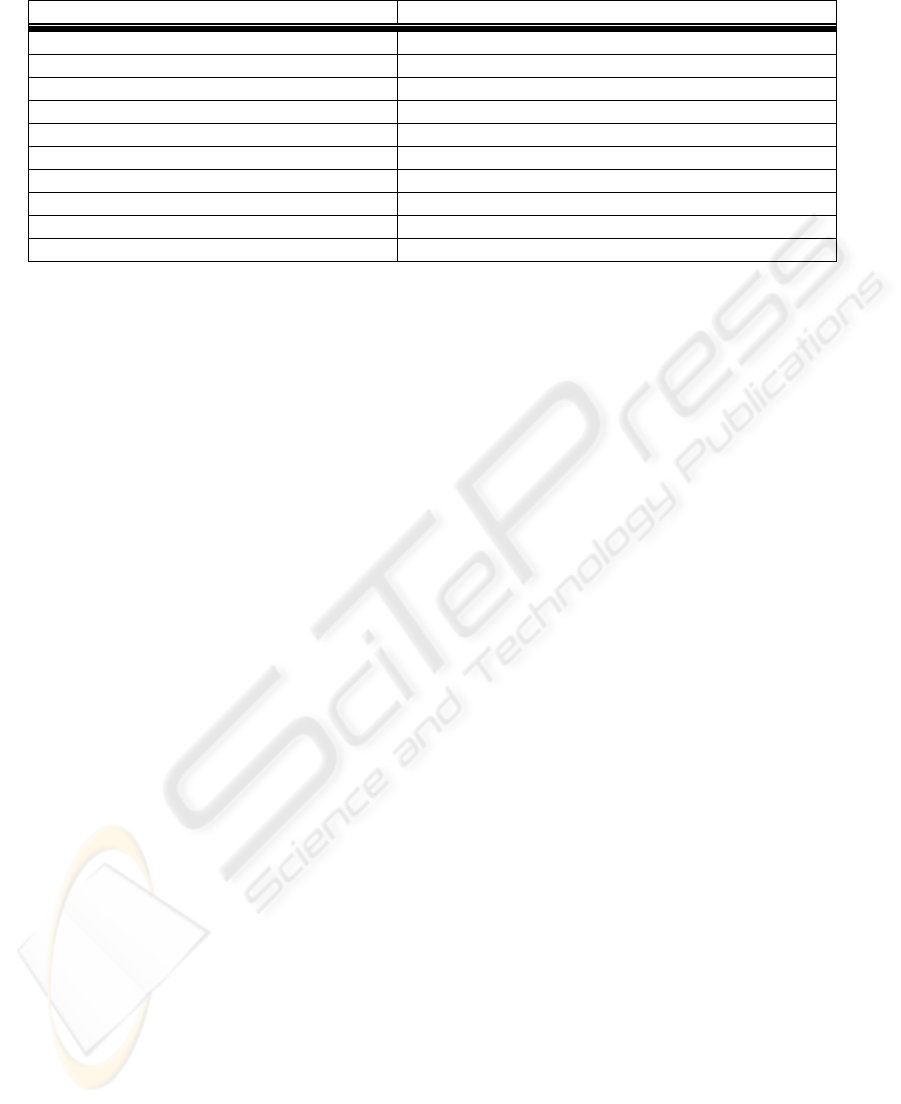
Table 1: Table of Metrics
Metric name Metric definition
Number of classes The total number of classes
Number of attributes The total number of attributes
Number of methods The total number of methods
Number of associations The total number of associations
Number of aggregations The total number of aggregations
Number of dependencies The total number of dependencies
Number of generalisations The total number of generalisations
Number of aggregations hierarchies The total number of aggregations hierarchies
Number of generalisations hierarchies The total number of generalisations hierarchies
Maximum DIT The maximum of the depths of inheritance trees
consists in finding out the right processes, is slightly
different because in one case we have to specify
programs or requests and in the other we have to
specify operations.
It means that the last step constitutes the main
difference between a traditional design and an object
design because in traditional design, processes are
not located and this fourth step does not exist. It also
means that to optimise the processes in a traditional
design we just have to check if they are well done, in
an object design we have, in addition, to check if
they are well placed.
2 OBJECT ORIENTED METRICS
A great lot of works have been done on metrics
(Briand, 1996; Genero, 2002,2001,2000; Lorenz,
1994; Chidamber, 1994), specially on static metrics.
The goal is to be able to say if a system has been
correctly built according to the rules implied by the
model which has been used.
Most of these metrics are based on criteria such as:
number of classes, number of links, number of
inheritance and composition relationships, ratios
attributes/operations in each class, depth of
inheritance hierarchies, etc. and even cyclomatic
number of the class diagram. The idea, of course, is
that a well built diagram, that is a good design, will
induce a good code and a very efficient system, and
it is true that a good design is always a key for a
successful implementation.
As example, Genero (Genero,2002) proposed the
table of metrics shown in table 1.
By applying these metrics the designer can evaluate
his class diagram and is able to re-build (some parts
or the whole of it) in order to guarantee that what he
has built is well built (Schuette,1998).
Unfortunately, the true finality of an information
system is not to be well built, but is to give entire
satisfaction when it runs, that means to give correct
answers to any event coming in, and the quickest as
possible. The proposal of metrics is useless if their
practical use is not demonstrated (Basili, 1996;
Olsina, 1999; Briand, 2001; Fenton, 1997; Poels,
2000; Schneidewind, 1992). Thus, their validation
must be carried out from two points of view; first the
empirical validation and then the formal validation
(Romero, 2002; Brito, 1999).
Dynamic metrics appeared then, to allow an
evaluation of the system behaviour (Melton, 1998).
Most of them are based on use cases and, of course,
on UML concepts from initial works of Marchesi
(Marchesi, 1998) and extended by Hendersons -
Sellers in (Herdersons, 1996, 2002) and Yacoub
(Yacoub, 1998).
Three primary metrics are suggested:
the total number of use cases
the overall number of communications between
actors and use cases
the total number of communications between actors
and use cases neglecting include and extend
structures
The following size measures are then added:
number of atomic actions in the main flow
number of atomic actions in each alternative flow
the longest path between the first atomic action of
the use case to the final atomic action of the use case
number of alternative flows (Withmire, 1997))
number of actors, etc.
Most of these metrics are metrics for requirements.
They are used to assess when a requirement is too
complex, at the wrong level, or too superficial
(Costello, 1995)(Zowghi, 2000). But to evaluate the
system behaviour the main notion to deal with is
time.
We have to be able to say if the system will run well
over a full period of time, we have to be able to take
into account what will happen during that period and
optimise the system performances over that period.
Of course, the result of this optimisation will give a
new arrangement of operations in classes, and the
best one if possible.
METRICS FOR DYNAMICS: HOW TO IMPROVE THE BEHAVIOUR OF AN OBJECT INFORMATION SYSTEM
345
3 HOW TO EVALUATE THE COST
OF AN EVENT
When an external event comes into the system, it
starts the performing of all the operations involved
in the process which must give the right answer.
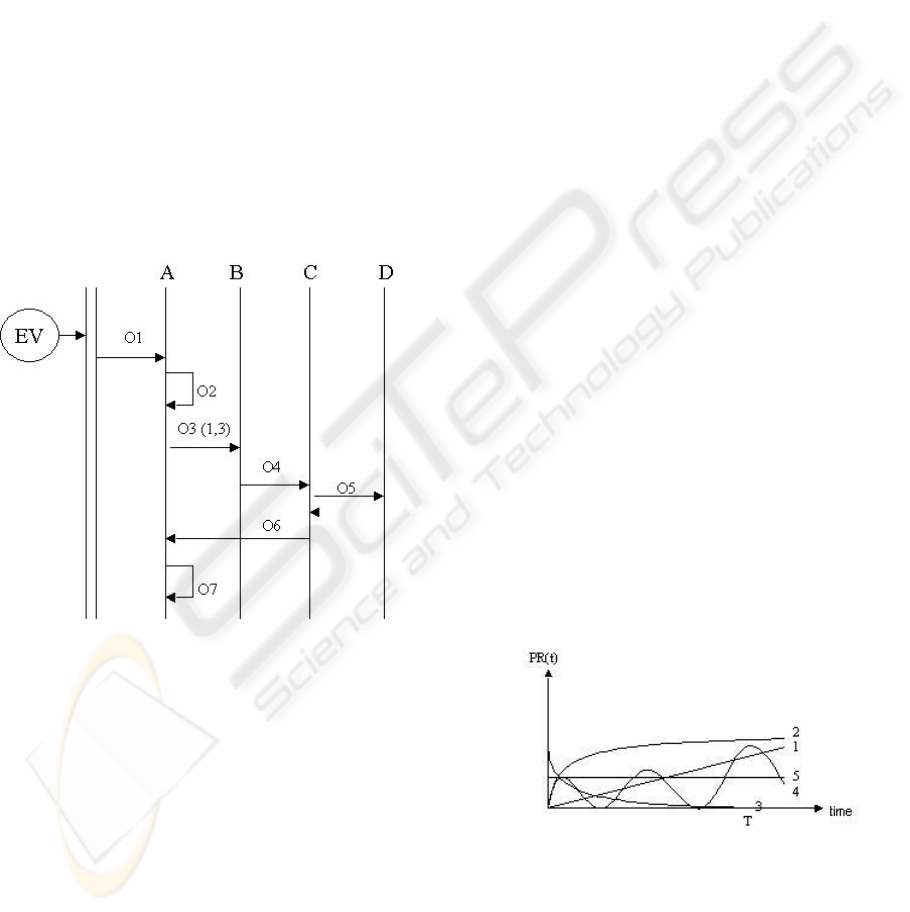
This process is clearly shown in the sequence
diagram of the event. For instance, the basic
sequence diagram in figure 2 shows that event EV
first activates the operation O1 in class A, then O2
still in A, after O3 in class B (3 times), then O4 in
class C which calls O5 in class D and, finally, O6
and O7 in class A.
The cost of each event is given by its sequence
diagram: it is the sum of the costs of all the
operations which are activated, that is the cost to
perform the code and the cost to get another object if
necessary, added to the costs of their calls, that is the
cost to go from one class to another. In the example
above, there are 7 operations activated, one of which
three times, and only 5 calls.
Figure 2: Sequence diagram of the event EV
When some operations are located in wrong classes
the cost of the event grows up because the number
of classes and also the number of calls involved is
too high, especially when there are deep inheritance
or aggregation hierarchies.
We may consider that:
the cost of the calls is more important than the cost
of operations, because it is more expensive to call an
operation, from one class to another one, than to
perform the code associated to an operation, which
is generally a very short bit of code,. In C++, the
cost of a call is between 2 or 3 times more important
than the average cost to perform a basic operation.
This is even more in JAVA.
the cost of operations performing is not optimisable.
That means even, when the operations are not well
located and are very expensive, the system has to
perform them anyway and wherever they are,
assuming that the analysis of the required operations
by the event has been done correctly.
For these two reasons, the cost of the calls is the
main factor entering in the computing of the event
cost, and the only one which is optimisable.
For the event Evi, the cost will be:
∑(j = 1 to N) Cost of Operation j
+∑(k = 1 to M) Cost of Call k
with N > = M because some operations are located
in the same classes, the second term being very often
more higher than the first one.
So the first conclusion is that to decrease the cost of
an event, we must minimize the cost of the calls by
moving some operations from one class to another.
The total cost, for all events, is given by:
∑(i = 1 to P) Cost Evi,
where P is the number of events.
4 EVALUATING THE COST OF
THE SYSTEM
All the events have not the same importance
according to their frequency.
Each event has its own probability of appearing, so
we have to weight each event by its probability.
The cost to run the system will then be:
C = ∑(i = 1 to P) PRi x Cost Evi
But the probability of an event is depending on time,
as it is shown in figure 3. Some events are very
frequent at the beginning of the life cycle of the
system and then become rare, others become more
and more frequent, and so on. That means, we have
to consider that the probability of each event is a
function of time: PRi(t).
Figure 3: Different types of functions PR (t)
Event 1 has a linear increasing probability (for
instance new client order)
Event 2 has a logarithmic increasing probability (for
instance new client registration)
Event 3 has a decreasing probability (for instance
new product registration)
ICEIS 2004 - INFORMATION SYSTEMS ANALYSIS AND SPECIFICATION
346
Event 4 has a cyclic probality (for instance new
client order for seasons products)
Event 5 has a constant probability (for instance
stocks daily updating)
Of course, knowing or estimating the function PR(t)
of each event is a very difficult task, but it is
definitely necessary if we want to evaluate correctly
the system behaviour through a long period of time,
because it allows to weight each event by giving
more importance to the most frequent ones (and not
the most complex ones which are perhaps very rare).
Actually, sizing use cases is totally useless if we
don’t take into account their appearance frequencies.
Then, the final and right formula to compute the cost
to run the system at the instant t is:
C(t) = ∑(i = 1 to P) PRi(t) x Cost Evi
The next step is to minimize this cost over a given
period [0,T] (usually 2 or 3 years to guarantee the
system stability).
The global cost, GC, to minimize is given by:
T
GC = ∫ ∑ (i = 1 to P) PRi(t) x Cost Evi
0
5 MINIMIZING THE GLOBAL
COST OF THE SYSTEM
Since the terms Cost Evi are not depending on time,
this integration becomes:
T
GC = ∑ (i = 1 to P) ∫ PRi(t) x Cost Evi
0
and then
GC = ∑ (i = 1 to P) Ai x Cost Evi
T
where Ai is equal to ∫ PRi(t),
0
which represents the weight of the probability on the
period.
This global cost has to be minimized by using the
only terms on which we can have an influence, (the
cost of operations calls), that is by modifying the
locations of operations.
In other words, we want to build the best class
diagram for the next two or three years, the one
which will be the most efficient, in regards to all
events, once coded.
The location of each operation in its class may be
represented by a matrix (classes, operations), where
a X means that operation i belongs to class j, similar
to the shown in figure 4. This matrix is equivalent to
the class diagram, but easier to handle.
Table 2: Matrix of classes and operations
Class
1
Class
2
Class
j
Class
n
Oper
1
Oper
2
Oper
i
x
Oper
m
This matrix has to be optimised on the period [0,T].
Unfortunately, it is not possible to solve this
problem by using a step by step method, such as
learning algorithms for instance, because we have no
predictive model and obviously because it would be
impossible to rewrite the code at each learning step.
It is neither possible to imagine an easy
mathematical solution, because we have to optimise
on a given period of time a function in which the
terms depending on time are given.
The only one solution is an oriented optimisation.
We have to optimise the performing of the system
over the chosen period in order to be able to say
which is the best matrix on that period and then code
it.
This optimisation will start with the highest terms,
by taking them one by one in a decreasing order. We
first take the highest Ai x Cost Evi and minimize it
by decreasing Cost Evi with a new arrangement of
operations in the matrix, and so on.
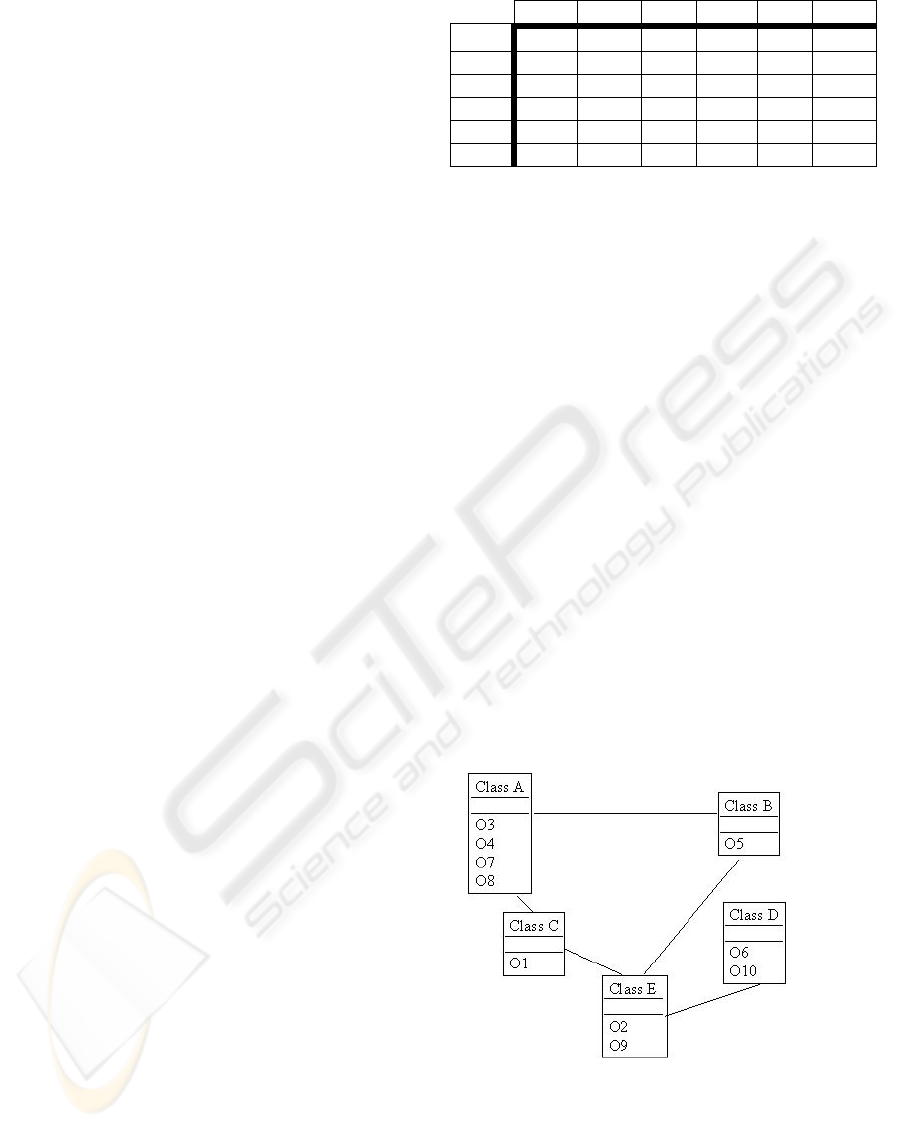
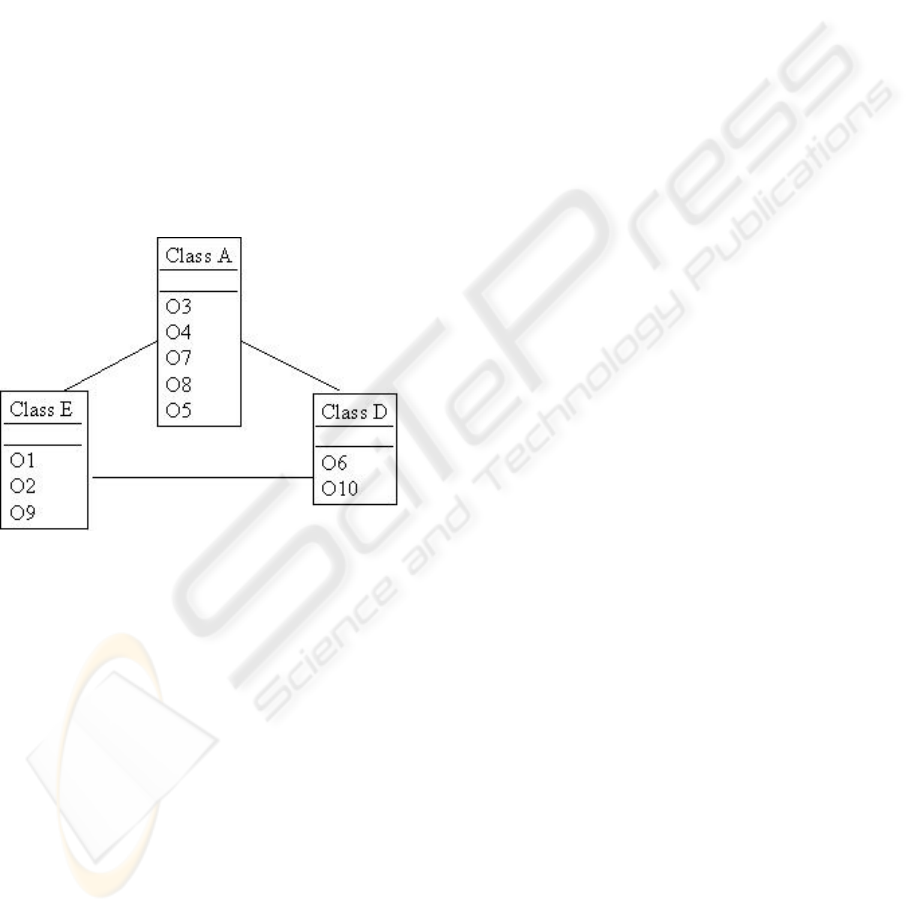
6 A BASIC EXAMPLE
Let us consider the initial class diagram in figure 4
where operations are distributed in this way.
Figure 4: Initial class diagram
Let us consider the 4 following events:
EV1 will activate O1, O2, O3
EV2 will activate O4, O5, O2, O6, O1
EV3 will activate O4, O7, O8
EV4 will activate O9, O3, O5, O7, O10, O6
Let us assume the following hypothesis:
METRICS FOR DYNAMICS: HOW TO IMPROVE THE BEHAVIOUR OF AN OBJECT INFORMATION SYSTEM
347
each operation’s performing costs 1
each operation’s call costs 2 (or more if there is no
direct link)
The cost of each event is then: EV1 3+6=9; EV2
5+10=15; EV3 3+2=5; EV4 6+10=16.
Let us suppose the following probabilities:
PR1(t) (the probability of event 1) is a constant
function
PR2(t) is a decreasing function
PR3(t) is a logarithmic increasing function
PR4(t) is a linear increasing function
The optimisation will show that the importance of
EV2 (high cost) is balanced by PR2, which is
decreasing, the term A2 is very low, and the
importance of PR3, which is increasing is balanced
by EV3, the operations of which being already
optimised. That means we will only take care of
EV4 and EV1, the two highest terms. In result, some
operations have to be moved from their initial
classes. The new class diagram will be as it is
presented in figure 5.
Figure 5: Final class diagram
In this new diagram, the cost of EV1 is 3+4=7
(instead of 9) and the cost of EV4 is 6+6=12 (instead
of 16). If we suppose that EV1 + EV4 have together
an average probability over the whole period of 0.7,
the cost gain being 6 for these 2 events (which
represents 24 %), the final cost gain will be 16%.
7 WA RN INGS
We never talked about what is happening to
attributes. Of course, it was deliberate. Actually, we
proposed (Cavarero, 2000) an algorithm to provide
the best arrangements « attributes/methods » in
classes. This algorithm is based on the encapsulation
principle which induce that when all the attributes an
operation deals with, are in the same class, the
operation is located in that class.
This principle is still respected here. It means that
the only operations which can’t be moved by the
optimisation are in the class of their attributes. In the
opposite case, when an operation is moved, the
attributes remain in their class because it won’t
change the number of calls.
8 CONCLUSIONS AND FUTURE
WORKS
Our dynamics metrics allow to evaluate the system
quality dynamically, but it is necessary to offer a
tool, which helps to the developer applies them. For
this reason, a tool is being under construction. Some
experiments have already been done from a
prototype and clearly show that this approach can
provide a great increase of the system performances
in some cases. The most significant example came
from an object information system composed of
more than three thousands operations (and 157
classes) where 324 operations where removed from
their initials classes, as a result of a 2 years period
optimisation.
The final goal of this research work is to provide the
best class diagram as possible (and so the best code)
for the future software, by taking into account what
the system will have to answer to, that is all the
coming in events.
The first quality of a software is its capability to
react to what it receives from the environnement and
this capability is deduced from the class diagram and
the location of each operation.
ACKNOWLEDGEMENTS
We wish to thank the CNEDI06 (Centre National
d’Etude et de Développement des Caisses
d’Allocations Familiales) for its financial support
and technical help in the implementation of the
optimisation tool and experiments.
REFERENCES
Basili V.R., Brian L. and Melo W. A validation of object
oriented design metrics as quality indicators. IEEE
Transactions on Software Engineering, N°10, 1996
Briand L., Bunse C. and Daly J. A controlled experiment
for evaluating quality guidelinescon the
maintainability of object oriented designs. IEEE
Transactions on Software Engineering, 513 – 530,
2001
Briand L., Morasca S. and Basili V. Property based
software engineering measurement. IEEE Transactions
on Software Engineering, 68 – 86, 1996
ICEIS 2004 - INFORMATION SYSTEMS ANALYSIS AND SPECIFICATION
348

Brito e Abreu F., Zuse H., Sahraoui H. and MeloW.
Quantitatives approaches in object oriented software
engineering. Object Oriented Technology :
ECOOP’99 Workshop Reader, Lectures notes in
Computer Sciences, Springer – Verlag, 326 – 337,
1999
Cavarero J.L. and Lecat R. La conception orientée objet :
évidence ou fatalité, Ed Ellipses, Paris, 2000
Chidamber S. and Kemerer C. A metric suite for object
oriented design. IEEE Transactions on Software
Engineering, 476 – 493, 1994
Costello R. and Liu D. Metrics for requirements
engineering. Journal of Systems Software, 39 – 63,
1995
Escalona M.J, Mejías M, Torres J, Reina A.M. The NDT
Development Process. Proceedings ICWE 2003.
LNCS 2003.
Fenton N. and Pfleeger S. Software metrics : a rigourous
approach. 2
nd
Edition. London, Chapman and Hall,
1997
Genero M. Defining and validating metrics for conceptual
models, PHD Thesis, University of Castilla La
Mancha, 2002
Genero M., Jimenez L. and Piattini M. Empirical
validation of class diagram complexity metrics. SCCC
2001, Chile, IEEE Computer Society Press, 95 – 104,
2001
Genero M., Piattini M. and Calero C. Early measures for
UML class diagrams. L’Objet, Hermes Sciences
Publications, 489 – 515, 2000
Genero M., Jimenez L. and Piattini M. A controlled
experiment for validating class diagram structural
complexity metrics, OOIS’02, Montpellier, 2002, 372
– 383
Hendersons – Sellers B. Object oriented metrics –
Measures of complexity. Prentice – Hall, Upper
Saddle River, New Jersey, 1996
Hendersons – Sellers B., Zowghi D., Klemola T. and
Parasuram S., Sizing use cases : how to create a
standard metrical approach, OOIS’02, Montpellier,
409 - 421
Lorenz M. and Kidd J. Object oriented software metrics :
A practical guide. Prentice – Hall, Englewood cliffs,
New Jersey, 1994
Marchesi M. OOA Metrics for the unified modeling
language. Proceedings of the 2
nd
Euromicro
Conference on Software Maintenance and
Reengineering, 67 – 73, 1998
Melton A. Software measurement. London, International
Thomson Computer Press, 1996
Olsina L. Metodología cualitativa para la evaluacióny
comparación de la calidad de sitios web. Ph. Tesis.
Facultad de Ciencias Exactas. Universidad de la
Pampa. Argentina. 1999
Poels G. and Dedene G. Distance based software
measurement : necessary and sufficient properties for
software measures, Information and Software
Technology, 35 – 46, 2000
Poels G. and Dedene G. Measures for assessing dynamic
complexity. 19
th
International Conference on
Conceptual Modeling (ER2000), Salt Lake City,
Lectures Notes in Computer Sciences, Springer –
Verlag, 499 – 512, 2000
Romero J., Pastor P. and Belenguer J. Methodological
approach to software quality assurance through high
level object oriented metrics, OOIS’02, Montpellier,
397 - 408
Schneidewind N. Methodology for validating software
metrics. IEEE Transactions of Software Engineering,
410 – 422, 1992
Schuette R. and Rotthowe T. The guidelines of modeling :
An approach to enhance the quality in information
models. International Conf. on the E/R approach,
Singapore, 1998
UML . Unified Modeling Language. Version 1.4, 2001.
www.omg.org
Yacoub S., Ammar H. and Robinson T. Dynamic metrics
for object oriented designs. 6
th
IEEE International
Symposium on Software Metrics, 1998
Whitmire S. Object oriented design measurement, John
Wiley and Sons, 1997
Zowghi D., Offen R. and Nurmuliani D. The impact of
requirements volatility on the software development
lifecycle. Procs International Conference on Software
(ICS 2000), IFIP World Computer Conference,
Beijing, China, 2000
METRICS FOR DYNAMICS: HOW TO IMPROVE THE BEHAVIOUR OF AN OBJECT INFORMATION SYSTEM
349
