
CDMA2000 1X CAPACITY DECREASE BY POWER CONTROL
ERROR IN HIGH SPEED TRAIN ENVIRONMENT
Simon Shin, Tae-Kyun Park, Byeung-Cheol Kim, and Yong-Ha Jeon
Network R&D Center, SK Telecom,
9-1, Sunae-dong, Bundang-gu, Sungnam City, Gyunggi-do, South Korea
Dongwoo Kim
School of Electrical Engineering & Computer Science, Hanyang Univ.
1271 Sa-dong, Ansan, Kyungki-do 425-791, South Korea
Keywords: CDMA2000 1X, Doppler shift, capacity, power control, Korea Train Express
Abstract: CDMA2000 1X capacity was analysed in the high speed train environment. We calculated the power
control error by Doppler shift and simulated bit error rate (BER) at the base station. We made the
interference model and calculated the BER from lower bound of power control error variance. The reverse
link BER was increased by high velocity although there was no coverage reduction. Capacity decrease was
negligible in the pedestrian (5 km/h), urban vehicular(40 km/h), highway and railroad(100 km/h)
environment. However, capacity was severely reduced in high speed train condition(300 km/h and 350
km/h). Cell-planning considering capacity as well as coverage is essential for successful cellular service in
high speed train.
1 INTRODUCTION
Cellular mobile telephone and data communication
services are very popular. Cellular service is usable
in anywhere, even though tunnel, sea, and
underground places. Railroads and highways are
main service area of cellular service because many
people move through them. Many countries adopts
the high speed train for transportation capability and
convenience for example TGV in France, ICE in
Deutschland. Korea also constructs the Korea Train
Express (KTX) between Seoul and Pusan. KTX
travels by 300 km/h speed and will be upgraded by
350 km/h speed.
High speed mobility can damage pilot
acquisition,
steady-state demodulation, code
tracking, and power control. We experimented the
CDMA2000 1X service quality using channel
simulator in Test-bed network. There was no quality
degradation such as MOS(mean of score), data
throughput, call drop, and call fail. We got the same
results in the KTX. Call origination, response, data
download, and data upload was successful in the
train with 300 km/h velocity. Received power,
transmitted power, and pilot chip energy to
interference ratio (Ec/Io) of mobile station were not
correlated with the mobile velocity. We could serve
successfully the CDMA2000 1X in the KTX by
existing cellular network.
Experimental results confirm that coverage is not
redu
ced by speed mobility. However, a few base
station and frequency assignment (FA) is established
in rural area. It makes the capacity shortage. One
KTX train is composed of 20 cars and one car seats
64 persons. It means more than 2000 calls can
connect one base station when two opposite trains
are in coverage of same base station. In the dense
urban area, heavy traffic cell is split for dividing
traffic. This method cannot be used for KTX
because traffic cannot be split in one train. We must
increase the FA for capacity improvement. Adjacent
cell uses same FA for smooth handoff. If one cell
increases the FA number, adjacent cells also
increase the FA number. Therefore we have to
estimate the capacity of one FA for efficient network
investment.
109
Shin S., Park T., Kim B. and Kim D. (2004).
CDMA2000 1X CAPACITY DECREASE BY POWER CONTROL ERROR IN HIGH SPEED TRAIN ENVIRONMENT.
In Proceedings of the First International Conference on E-Business and Telecommunication Networks, pages 109-113
DOI: 10.5220/0001398401090113
Copyright
c
SciTePress

Velocity does not influence the coverage, but it
does not mean that capacity is not varied by velocity.
Network performance can be changed with user
number because CDMA is the system limited by
interference. CDMA performance is influenced by
multi-user interference. CDMA capacity is limited
by Walsh code on the forward link and by cell
loading on the reverse link. Cell loading is the
received power increase by mobile station at the
base station receiver. High cell loading increases the
noise level at the base station receiver and it
degrades the bit energy to noise ratio (Eb/Nt). Low
Eb/Nt increases the transmitted power of mobile
station by power control and high transmitted power
degrades Eb/Nt repeatedly. CDMA2000 1X uses the
fast power control for corresponding to variable
radio channel. High velocity of mobile causes the
power control error due to Doppler shift and fast
radio channel environment variation. This paper
analysed the capacity decrease by power control
error. Section 2 will derive the calculation of power
control error and Section 3 will show the simulation
results.
2 POWER CONTROL ERROR
SIMULATION
2.1 Interference Model
We starts making interference model by followed
assumption.
- User o who is analysis target has the appropriate
received signal strength 0 dB.
- There are K+1 users including target user o.
- K+1 users are served in same cell.
- K+1 users are riding the KTX.
- There is no other user who is not riding KTX in
the analysed cell. That is to say, all of users in
the analysed cell are riding KTX.
- Other cell user K interference is assumed in-cell
user gK.
- There is no error in the power control procedure
of the other cell user.
Received signal in base station from interference
user i is as follows:
(dB)
iii
mS
ε
+
=
2.1
i
m
is the signal strength without power control error.
i
ε
is the random variable due to power control error
and has log-normal distribution with 0 dB expected
value and
dB variance. Expected value and
variance of random variable
measured by Watt-
unit are as follows.
2
i
σ
i
S
22
2
1
][
ii
m
i
eSE
σββ
+
=
2.2
(
)
1)(
2222
2
−=
+
iii
eeSVar
m
i
σβσββ
2.3
β
is (ln10)/10 in equation 2.2 and 2.3. Received
signal strength of user o is as equation 2.4.
(dB)
oo
S
ε
=
2.4
In equation 2.4, it is assumed
o
ε
has a log-normal
distribution with variance
.
(dB)
e
σ
Received power from other cell users must be
considered to analyse multi-cell environment.
Interference from other cell is represented by in-cell
interference. If there are K users in the each cell and
average propagation loss ratio of in-cell and other
cell is g, other cell interference is gK. Standard
deviation of received signal is the control function of
base station transmitted power because of fading.
Total interference considering both in-cell and other
cell interference is as equation 2.5
2
∑∑
==
+=
gK
i
oi
K
i
ei
SSI
11
2.5
ei
is signal power of in-cell user i with standard
deviation
ei
S
σ
.
oi
is signal power of other cell user i
with standard deviation
oi
S
σ
. Therefore, expected
value and variance of I is as follows
∑∑
==
+=
gK
i
oi
K
i
ei
SESEIE
11
][][][
2.6
∑∑
==
+=
gK
i
oi
K
i
ei
SVarSVarIVar
11
)()()(
2.7
Probability density function (PDF) of I can be
approximated by log-normal random variable
ξ
,
because I is sum of independent log-normal random
variables. Expected value and variance of
ξ
is as
follows
2
2
1
][
KK
m
eE
σ
ξ
+
=
2.8
(
)
1)(
22
2
−=
+
KKK
eeVar
m
σσ
ξ
2.9
It is assumed power control error variance of in-cell
users and other cell is
e
σ
and
o
, respectively.
Expected value and variance of I is defined with
2
2
σ
ICETE 2004 - WIRELESS COMMUNICATION SYSTEMS AND NETWORKS
110

expected value and variance of
using Wilkinson’s
Method.
ξ
22222
2
1
2
1
2
1
KKoe
mmm
egKeKe
σσββσββ
+++
=+
2.10
(
)
(
)
(
)
111
22
22222222
2
22
−=−+−
+
++
KKK
ooee
eeegKeeKe
m
mm
σσ
σβσββσβσββ
2.11
We get m
k
and
σ
k
from equation 2.10 and 2.11.
() ()
⎥
⎥
⎥
⎥
⎥
⎦
⎤
⎢
⎢
⎢
⎢
⎢
⎣
⎡
+
⎟
⎟
⎠
⎞
⎜
⎜
⎝
⎛
+
−+−
= 1
11
ln
2
2
1
2
1
2
2222
22222222
oe
ooee
geeK
egeee
K
σβσβ
σβσβσβσβ
σ
2.12
2
2
1
2
1
2
1
lnln
2222
KK
oe
geeKm
σ
σβσβ
−
⎟
⎟
⎠
⎞
⎜
⎜
⎝
⎛
++=
2.13
2.2 Mean BER Calculation
Bit energy to interference ratio of BPSK having
bandwidth W is given by equation 2.14.
⎟
⎟
⎠
⎞
⎜
⎜
⎝
⎛
++
=
+
∑∑
==
gK
i
oi
K
i
ei
beob
SS
W
N
RS
IN
E
11
0
00
1
/
2.14
N
o
is the power spectral density of background noise
and R
b
is the bit rate. BER of BPSK is given by
⎟
⎟
⎠
⎞
⎜
⎜
⎝
⎛
+
=
00
2
IN
E
QP
b
e
2.15
The received signal is log-normal random variable
due to imperfect power control and BER is given by
(
)
γ
eQP
e
=
2.16
γ
is the Gaussian random variable and its mean and
variance is given by
⎟
⎟
⎠
⎞
⎜
⎜
⎝
⎛
−=
K
b
m
R
W
m 2ln
2
1
γ
2.17
(
2222
4
1
Ke
σσβσ
γ
+=
)
2.18
With mean
γ
, mean BER is calculated by
(
)
∫
∞
=
0
)(
γγ
γ
dgeQP
e
2.19
Equation 2.19 is approximated to equation 2.20
using the expansion of central difference.
(
)
(
)
(
)
γγγγγ
σσ
33
6
1
6
1
3
2
−+
++≈
mmm
e
eQeQeQP
2.20
2.3 Variance of Power Control Error
Each base station controls the received power from
mobile station in cellular CDMA network. There is
four main error factor when tracking the received
power. They are the quantum(
σ
q
), decoding(
σ
d
),
measurement(
σ
m
), and propagation delay(
σ
p
) error.
Generally,
σ
m
and
σ
p
is much larger than
σ
q
and
σ
d
. If error factor is statistically independent,
22222
dqpme
σσσσσ
+++=
2.21
ν
is the maximum velocity of mobile. f
c
is the
carrier frequency. c is the light velocity. We assume
the bandwidth is narrow enough to neglect
bandwidth. Maximum Doppler shift is
cvff
cd
/
=
2.22
Propagation delay is 2d/c for closed loop power
control. d is the distance between mobile and base
station. Therefore, processing delay is
c
d
f
T
d
p
2
−<
α
2.23
We define the p
m
is measured received power in dB
scale.
is the received power in linear scale and p
0
p m
is
. If is variance of natural
logarithm(
) of
0
log10 p
2
1
m
σ
0
ln p
0
p
2
1
22
)log10(
mm
e
σσ
=
2.24
It is assumed that fluctuation of received power can
be neglected during measurement time T
m
.
Measurement period T
m
is the main factor of
processing delay T
p
. Power control error is due to
multi-user interference and white Gaussian noise.
We assume the power control makes received power
from any mobile to be almost same. It enables us to
CDMA2000 1X CAPACITY DECREASE BY POWER CONTROL ERROR IN HIGH SPEED TRAIN ENVIRONMENT
111
5 10 15 20 25 30
10
-6
10
-5
10
-4
10
-3
10
-2
10
-1
10
0
Bit error rate
Number of users
5km/h
40km/h
100km/h
300km/h
350km/h
determine the lower bound. Multi-user interference
is modelled Gaussian process that increases one-
sided power spectral density N
o
to N
t
.
)1(
0
0
gK
W
p
NN
t
++=
2.25
p
o
is K-1 interference signal power. W is the receiver
bandwidth. g is the interference constant that
represents other cell interference. Received signal is
)(
0
tsp
.
)(
2
exp)(
0
ts
y
tsp
⎟
⎠
⎞
⎜
⎝
⎛
=
2.26
y is lnp
o
in equation 2.26. Cramer-Rao bound
provides lower bound of lnp
o
variance. Equation
2.27 is obtained from this lower bound and equation
2.26.
1
0
2
2/2
1
)(
2
−
⎪
⎭
⎪
⎬
⎫
⎪
⎩
⎪
⎨
⎧
⎥
⎦
⎤
⎢
⎣
⎡
∂
∂
≥
∫
m
T
y
t
m
dttse
yN
σ
2.27
using equation 2.24 and 2.25
⎥
⎦
⎤
⎢
⎣
⎡
+
+≥
W
gK
p
N
T
e
m
m
)1()(log200
0
0
2
2
σ
2.28
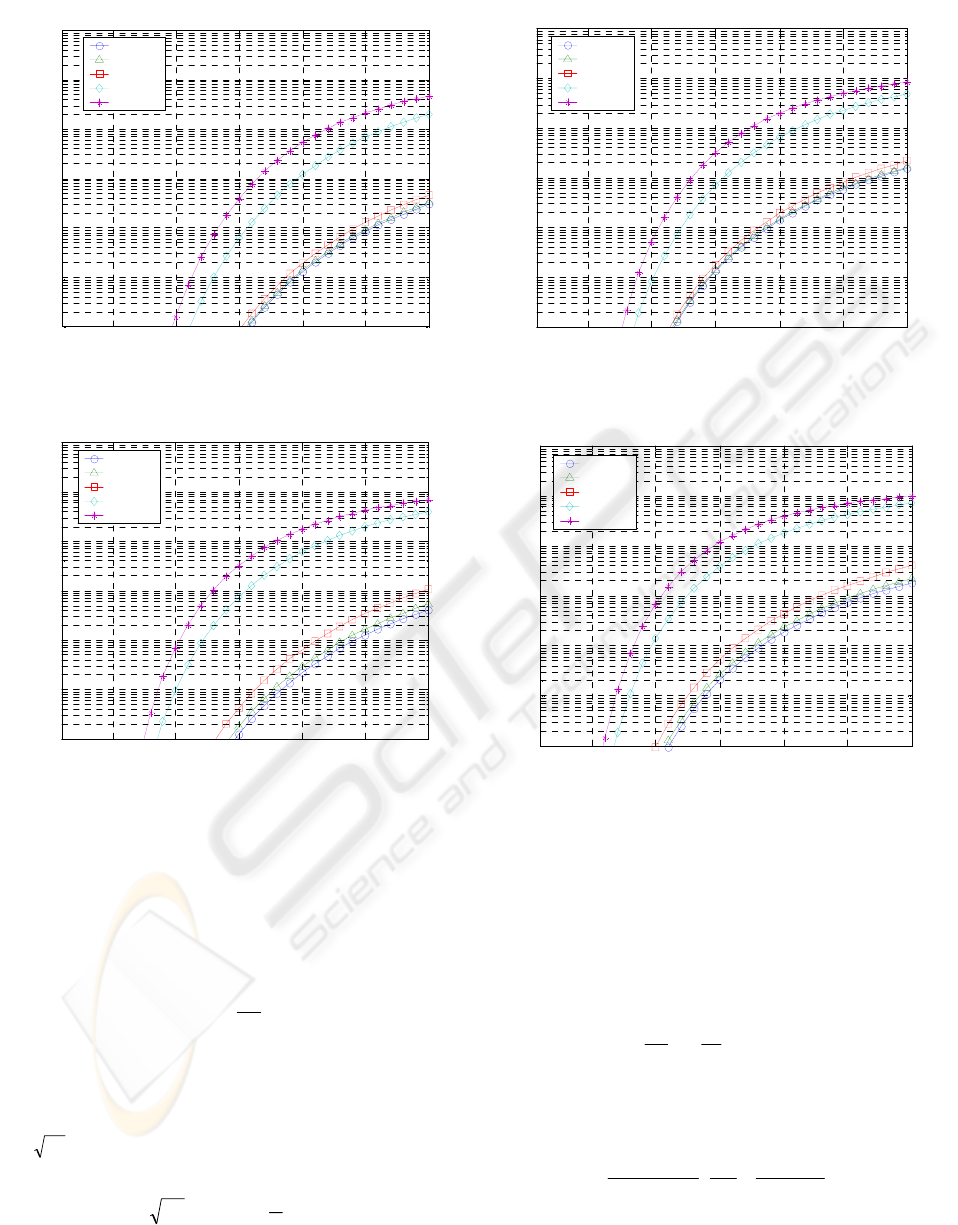
Figure 1(a): and
3.0=g
2222
)(5.0dB=++
dqp
σσσ
5 10 15 20 25 30
10
-6
10
-5
10
-4
10
-3
10
-2
10
-1
10
0
Bit error rate
Number of users
5km/h
40km/h
100km/h
300km/h
350km/h
5 10 15 20 25 30
10
-6
10
-5
10
-4
10
-3
10
-2
10
-1
10
0
Bit error rate
Number of users
5km/h
40km/h
100km/h
300km/h
350km/h
Figure 2(a):
634.0
=
g
and
2222
)(5.0dB=++
dqp
σσσ
Figure 1(b): and
3.0=g
2222
)(5.1dB=++
dqp
σσσ
5 10 15 20 25 30
10
-6
10
-5
10
-4
10
-3
10
-2
10
-1
10
0
Bit error rate
Number of users
5km/h
40km/h
100km/h
300km/h
350km/h
Figure 2(b):
634.0
=
g
and
2222
)(5.1dB=++
dqp
σσσ
ICETE 2004 - WIRELESS COMMUNICATION SYSTEMS AND NETWORKS
112

If we define
and use equation 2.23, we
obtain equation 2.29 from 2.21
mp
TTT −=
1
222
0
0
1
1
22
)1(2
)(log200
dqp
d
low
W
gK
p
N
T
c
d
f
e
σσσ
α
σ
+++
⎥
⎦
⎤
⎢
⎣
⎡
+
+
⎟
⎟
⎠
⎞
⎜
⎜
⎝
⎛
−−∆
−
2.29
3 SIMULATION RESULTS
We simulated the BER of received signal at base
station when user number was 5 ~ 30 persons.
Simulation circumstance was assumed to be
pedestrian(5 km/h), urban vehicle(40 km/h),
highway and railroad(100 km/h), KTX(300 km/h),
and upgraded KTX(350 km/h).
BER was calculated from equation 2.20. m
r
and
σ
r
of equation 2.20 was calculated from equation
2.17 and 2.18. m
k
and
σ
k
was calculated from
equation 2.12 and 2.13. We used the lower bound of
equation 2.28 when calculating equation 2.12 and
2.13. Figure 1 and 2 shows user number and BER
when mobile speed is 5 km/h, 40 km/h, 100 km/h,
300 km/h, and 350 km/h. We assumed R
b
= 4.8 kbps,
W = 1.2288 MHz, d = 4 km,
α
= 0.1, T
1
= 100 us,
N
o
/p
o
= 5 us,
σ
o
2
= 3.9 (dB)
2
. Figure 1 and 2 shows
increase of mobile speed degrades the BER of
received signal. This means the reverse link capacity
decreases to maintain the quality of service. Figure 1
and 2 shows the result when interference constant g
is 0.3 and 0.634, respectively. Larger interference
constant increases the receiver sensitivity with user
number. (a) and (b) of each Figure shows the results
in the case of
dqp
σ
and
dqp
. High speed enlarges the
Doppler shift in equation 2.22. Doppler shift
increases the lower bound of error variance in
equation 2.29. This increases the BER and degrades
the quality of service.
2222
)(5.0dB=++
σσ
σσσ
as well as
coverage for cellular network planning.
A.M
l. 42, No. 2/3/4,
B.
y users,” Pro. IEEE
N.C
unications, vol. 43, No. 12, pp. 2869-2873, Dec.
M.B
tions, vol. COM-25, No. 8, pp. 795-799,
J.M
munications, vol. 40, No. 3, pp.
C.C
Proc.-Commun., vol. 143, pp.
R.N s
D. network,”
internal communication.
2222
)(5.1dB=++
In urban vehicular (40 km/h) condition, BER
increase by Doppler shift was negligible. BER
degradation was not severe even though highway
and railroad (100 km/h) condition. We could plan
the cellular network assuming constant capacity with
mobile speed before KTX service. However, BER
was dramatically increased in KTX circumstance.
User number in KTX was limited to 17 ~ 26 persons
to maintain BER lower than 1 %.
4 CONCLUSION
We measured the coverage of CDMA2000 1X
network experimentally and simulated the capacity
in KTX condition. Although coverage was not
decreased, capacity was reduced severely in high
mobile speed of 300 km/h. We don’t have to
consider the mobile velocity in cell-planning
because capacity reduction is negligible in highway
and railroad. However, capacity is severely reduced
in KTX for its high velocity. We must consider the
number of passenger carried by KTX when opposite
train is met. Cell-planning without considering
capacity can make the burst error in high traffic
intensity. It causes not only quality degrade but also
call drop. We must consider capacity
REFERENCES
. Viterbi, A.J. Viterbi, and E. Zehavi, “Other-cell
interference in cellular power-controlled CDMA,”
IEEE Trans. on Communications, vo
pp. 1501-1504, Feb./Mar./Apr. 1994.
Hashem and E. Sousa, “Increasing the DS-CDMA
system reverse link capacity by equalizing the
performance of different velocit
ICC’98, Atlanta, Georgia, USA.
. Beaulieu, A.A. Abu-Dayya., and P.J. McLane,
“Estimation the distribution of a sum of independent
lognormal random variables,” IEEE Trans. on
Comm
1995.
. Pursley, “Performance evaluation for phase-coded
spread spectrum multiple-access communication –
part I : system analysis,” IEEE Trans. on
Communica
Aug.1977.
. Holtzman, “A simple, accurate method to calculate
spread-spectrum multiple-access error probabilities,”
IEEE Trans. on Com
461-464, Mar. 1992.
. Lee and R. Steele, “Closed-loop power control in
CDMA systems,” IEE
231-239, Aug. 1996.
. McDonough and A.D. Whalen, Detection of Signal
in Noise, 2nd ed. San Diego : Academic Press, 1995.
Torrieri, “Uplink capacity of a CDMA
CDMA2000 1X CAPACITY DECREASE BY POWER CONTROL ERROR IN HIGH SPEED TRAIN ENVIRONMENT
113
