
Attacks on Industrial Control Systems
Modeling and Anomaly Detection
Oliver Eigner, Philipp Kreimel and Paul Tavolato
University of Applied Sciences St. P
¨
olten, Matthias Corvinus-Straße 15, St. P
¨
olten, Austria
Keywords:
Industrial Control System, Modeling Procedure, Anomaly Detection, Machine Learning.
Abstract:
Industrial control systems play a crucial role in a digital society, particularly when they are part of critical
infrastructures. Unfortunately traditional intrusion defense strategies for IT systems are often not applicable
in industrial environments. A continuous monitoring of the operation is necessary to detect abnormal behavior
of a system. This paper presents an anomaly-based approach for detection and classification of attacks against
industrial control systems. In order to stay close to practice we set up a test plant with sensors, actuators and
controllers widely used in industry, thus, providing a test environment as close as possible to reality. First,
we defined a formal model of normal system behavior, determining the essential parameters through machine
learning algorithms. The goal was the definition of outlier scores to differentiate between normal and abnormal
system operations. This model of valid behavior is then used to detect anomalies. Further, we launched cyber-
attacks against the test setup in order to create an attack model by using naive Bayes classifiers. We applied
the model to data from a real industrial plant. The test showed that the model could be transferred to different
industrial control systems with reasonable adaption and training effort.
1 INTRODUCTION
Our society depends on various critical services such
as electricity, water purification and transportation, to
function properly. In recent years, Industrial Control
Systems (ICS) that supervised and controlled most of
these critical services were realized by specially con-
structed isolated devices. Most ICSs were designed to
meet availability and reliability requirements. There-
fore cyber security measures were often deemed no-
nessential and not implemented. Along with the rest
of our society, ICSs have evolved and are now often
delivered by complex interconnected IT solutions that
in one way or another are connected to the Internet
and subsequently open new points of exposure. These
systems often control and monitor critical infrastruc-
tures, which are essential for the functioning of a so-
ciety and economy. If these systems were compromi-
sed, it would have serious consequences.
However, the trend of interconnectivity and in-
tegration of standard computing devices into indus-
trial environments vastly increased the threat of cyber-
attacks on ICSs. This is reflected by the growing con-
cerns about attacks because ICS security has become
a top priority in recent years. Incidents like the cyber-
attacks against Estonia in May 2007 (Traynor, 2014),
the Stuxnet worm, which led to physical damage of
centrifuges at an Iranian uranium enrichment plant in
2009 (Falliere et al., 2011), the breach at Maroochy
Water Services in Queensland in 2000 (Slay and Mil-
ler, 2008), or the recent wave of denial of service at-
tacks on Israeli websites, including the national air-
line El Al and the Tel Aviv Stock Exchange (Dieterle,
2012) (Haaretz, 2017), have captured the attention of
the mainstream media and increased the awareness on
security.
To succeed at protecting these environments and
industrial devices, certain security controls that mo-
nitor the communications and operation processes,
must be implemented in order to detect any anomaly.
Besides, conventional intrusion defense strategies for
common IT systems are often not applicable and por-
table in industrial environments.
In this paper we present a prototype implementa-
tion with an anomaly-based approach to detect and
classify attacks near real-time (due to delays by cal-
culations) in industrial control systems. First, a mo-
del of normal system behavior is defined and the ano-
maly detection process is started to identify anoma-
lous data. Further, an attack model based on supervi-
sed cyber-attacks on industrial control systems is trai-
ned, in order to classify known and unknown attacks.
The system data was obtained from a custom-built
industrial testbed, a conveyor belt system, which uses
Eigner O., Kreimel P. and Tavolato P.
Attacks on Industrial Control Systems - Modeling and Anomaly Detection.
DOI: 10.5220/0006755405810588
In Proceedings of the 4th International Conference on Information Systems Security and Privacy (ICISSP 2018), pages 581-588
ISBN: 978-989-758-282-0
Copyright
c
2018 by SCITEPRESS – Science and Technology Publications, Lda. All rights reserved

industrial hardware in order to provide near real-time
data and ensures practicability of the approach.
The rest of the paper is structured as follows.
Section 2 gives a short overview of related work. In
Section 3 we describe our test environment. Section 4
presents the anomaly-based attack detection and clas-
sification approach. Section 5 describes experimental
classification results. In Section 6 our approach is tes-
ted on data from a real system. Section 7 concludes
the paper with some ideas for future work.
2 RELATED WORK
The domain of SCADA-specific anomaly detection
and intrusion detection systems is fairly active. Me-
dia attention to cyber-attacks on industrial control sy-
stems such as Stuxnet (e.g. Chen (Chen, 2010) and
Falliere et al. (Falliere et al., 2011)) has emphasized
the need for reliable detection systems. Various works
can be found in the field of attacks on industrial cont-
rol systems or anomaly detection. Keliris et al. (Keli-
ris et al., 2016) survey anomaly detection design prin-
ciples and techniques for ICSs. They categorize in-
dustrial attacks on the process and profile characteris-
tic disturbances, as well as follow a data-driven ap-
proach to detect anomalies that are early indicators of
malicious activity. Further, they performed two ex-
periments: one with simulated attack data to evaluate
the performance of the algorithms at various solution-
depths, and the other to evaluate data generated out of
exploits.
An intrusion detection system based on the pe-
riodicity and telemetry patterns of network traffic in
SCADA systems is proposed by Zhang et al. (Zhang
et al., 2016). The system analyzes periodicity cha-
racteristics in SCADA networks and tries to classify
them with their intrusion detection algorithm. They
can detect communication attacks such as response
injection attacks with their proposed system by com-
bining telemetric and periodic system data.
Garitano et al. (Garitano et al., 2011) presented
examples of anomaly detection systems in SCADA
environments in their survey. They present current
work and further outline the possibilities and con-
straints of the approaches. They evaluate various ano-
maly detection methods and found out that most sy-
stems are based on the analysis of network protocol
communications and do not factor in the system be-
havior.
Peng et al. (Peng et al., 2015) give an overview of
anomaly detection approaches for identifying finger-
printing attacks on industrial control systems. Furt-
her, they describe various attack vectors for ICSs and
how to enhance security for these systems.
A model-based intrusion detection approach is
presented by Cheung et al. (Cheung et al., 2007).
They construct models that specify the expected be-
havior of the system and detect attacks that cause the
system to behave outside of the models. Further they
implement a prototype for monitoring Modbus/TCP
networks that evaluate three model-based techniques.
The authors define protocol-level models based on
the Modbus/TCP application protocol and use custom
IDS rules to detect violations in the Modbus/TCP spe-
cification.
Jean et al (Jeon et al., 2016) proposed a novel met-
hod of passive fingerprinting for SCADA networks
without Deep Packet Inspection (DPI) and experience
on real environments. Their goal is to provide in-
formation as to which devices belong to the SCADA
part like field devices, by analyzing the network flow.
Further, they are able to identify devices in critical in-
frastructures and can import an initial rule to define
their normal behavior by using an anomaly-based In-
dustrial detection system (IDS).
A similar approach by Goldenberg and Wool is
proposed in (Goldenberg and Wool, 2013). Their ap-
proach is based on a key observation. The authors as-
sume that due to the nature of Modbus/TCP network
systems, communication between devices is highly
periodic. Further they present a model-based IDS spe-
cifically built for Modbus/TCP. Thus, each program-
mable logic controller (PLC) to human-machine inter-
face (HMI) channel can be modeled by its own uni-
que deterministic finite automaton (DFA). To prove
their proposed system, they tested their approach on
a production Modbus/TCP system. They achieved a
low false-positive rate and could successfully flag real
anomalies in the network.
3 TESTBED
We created a testbed of a simple industrial system, a
conveyor belt, using industrial hardware components
such as a Siemens PLC, HMI and infrared light bar-
rier sensors. The work flow of the conveyor belt is
controlled by the programmed logic on the PLC and
the input sensors provide process information which
is sent to the PLC. The operation of the system re-
sembles a real conveyor belt and therefore allows us
to gather realistic data that could represent an indus-
trial system.
In order to acquire and analyze data from the sy-
stem, we developed a prototype implementation of an
anomaly detection system, running on a Raspberry Pi
3, which was integrated into the testbed. The main

Figure 1: Lab environment for our testbed.
parts of the prototype IDS are the acquisition of data,
the extraction of features, the detection of anomalies,
classification of known anomalies and an alert system.
The whole work flow and all occurring events are con-
trolled and triggered by the PLC. A detailed descrip-
tion of the hardware and software implementation of
our testbed can be found in our previous work (Eigner
et al., 2016).
4 MODELING PROCEDURE
In order to apply anomaly detection in the automation
network of an industrial control system, a formal mo-
del of the problem domain is necessary. In our case,
we look at the connected network, the physical com-
ponents of a plant represented by sensors and actors
connected to the cyber-domain and the specialized
logic controllers running the control program. The
traffic on this network represents the domain. One
of the main driving factors for the modeling process
is the protocol, which defines the syntax and seman-
tics of this traffic. For our model implementation this
is Modbus/TCP a protocol widely used in industrial
control systems. Thus, the basic information is the
flow of data coming along the network. We assume
that we can retrieve or intercept this data flow and
analyze it in near real-time.
4.1 Data Acquisition
Modelling implies abstraction from the details of the
data flow. As Modbus/TCP is a synchronous proto-
col, the first step in modeling was the definition of an
adequate time acquisition interval ∆t. This is not a
complex task as the activities on the communication
network in an industrial control systems, as for ex-
ample a conveyor belt with various more or less sim-
ple processing elements, are essentially periodic and
the same sequence of data is transmitted over the net-
work again and again. Moreover, the processing times
for the work pieces do not differ very much. Nevert-
heless, it is advisable to choose ∆t in a way that it
comprises more than one cycle of processing to come
up for time differences in the processing cycles due
to physical limitations (industrial control systems in-
clude by definition physical components where single
actions cannot be guaranteed to last exactly always
the same time).
Having defined ∆t we now look at the network
traffic: this mainly consists of network packets con-
taining either sensor data transmitted from the sen-
sors to the control unit or commands transmitted from
the control units to the actors. First, we abstract from
syntactic details of the protocol, as they do not pro-
vide valuable information about the operation of the
plant. Looking at the contents of the packets, we find
either sensor data transmitted to the control unit or
commands from the control unit to the actors. The
data may be binary (e.g. motor on/off) or data with a
specific range (e.g. the values coming from a tempe-
rature sensor). Raw data from the network consists of
a vast amount of data with numerous identical values.
Let us call values with the same meaning (say ”motor
on” for a specific motor or ”temperature value” of a
specific temperature sensor) a variable.
4.2 Feature Extraction
For the model, we have to reduce the dimensionality,
i.e. the number of variables under consideration, by
selecting and/or aggregating them. Looking at all va-
riables from one ∆t we can extract various features in
order to achieve a set of features that can be handled
by machine learning algorithms. Candidates for fea-
tures are for example:
• the minimum value of a variable
• the maximum value of a variable
• the arithmetic mean of a variable
• the standard deviation of a variable
• the round-trip time of packets
• and many more
By experimentation we select a number of features.
Knowledge of the details of the protocol and of the
process of the plant can significantly improve and
speed up the feature extraction process. The set of fe-
atures should be defined with the overall goal in mind
to model the (normal) behavior of the system. The
result of this process is a vector v(a
1
, a
2
, a
3
, .,a
n
) of
features that can be calculated for every time interval.
It can be seen as a point in the n-dimensional space
representing the model. Within our model system n =
35 was chosen.

The next step in the modeling process is the de-
finition of a distance measure for these vectors. Va-
rious candidates were evaluated to select a definition
that achieved the best result. Using this distance mea-
sure normal behavior of the system can be defined as a
vector within a predefined distance from all other vec-
tors that were calculated from time periods taken from
the network traffic during normal operation of the sy-
stem. We tried several clustering algorithms to find a
procedure with highest accuracy. Finally, this leads to
a threshold t
v
for valid behavior of the system by ta-
king the average outlier value from the clustering and
adding a reasonable value to come up for slight diver-
gences which were not visible in the data used for the
clustering. Given a vector v
u
of measured features in
a time period ∆t and let f (v
u
) denominate the calcu-
lated distance (the outlier values) then the data from
time period modeled by v
u
is determined to represent
normal behavior of the system if:
f (v
u
) < t
v
(1)
4.3 Classification
In case an abnormal (invalid) time period is detected
the model can be augmented by defining not only
clusters of normal behavior but clusters of specific ab-
normal situations, too. These clusters may represent
specific attacks launched against the industrial control
system, such as Man-in-the-Middle attacks, Denial-
of-Service attacks, communication protocol attacks,
and others. They can be used to classify abnormal
behavior.
To put this modeling into practice for a specific
control system, i.e. to develop a model for this spe-
cific control system, a training phase must be carried
out that is used to find appropriate features. Data sets
gathered during normal operation of the system are
collected, the vectors for each time period are calcu-
lated and used as input to the machine learning al-
gorithms. For classification of abnormal behavior, it
is moreover necessary to have training data for each
class, which means for different kind of attacks.
Once an anomaly is detected, the classification
process is started and tries to identify whether the
anomaly is known from the trained database, i.e. a
probabilistic classifier, we used the naive Bayes clas-
sifier, which predicts an anomaly class with a suffi-
cient degree of certainty, or unknown, if no class mat-
ches the anomaly. We used multi-class classification,
which means that the data instance is assigned to the
class with the highest value that is calculated for all
classes. A labeled model represents the main part of
the classification process. It uses the normal behavior
model as basis and contains all training examples for
a certain behavior. All new attacks are classified and
imported to the attack model database, which is conti-
nuously updated. Training data has to be generated in
order to construct the attack model and evaluate the
performance of the classification process. This will
be discussed in the next section.
5 EVALUATION
After defining normal system behavior, we trained
an attack model based on supervised attacks which
were performed against our testbed, evaluated the per-
formance of the model-based anomaly detection and
classification technique of Section 4, we trained an at-
tack model based on supervised attacks and estimated
the statistical performance of the model by classifying
unlabeled data.
5.1 Learning the Attack Model
We executed various cyber-attacks under supervision
against our industrial testbed in order to train the
attack model. Each attack was performed multiple
times and the system behavior logged by the inte-
grated data logger from the prototype. The attacks
were performed using Kali Linux (Offensive Security,
2017), an advanced penetration testing Linux distri-
bution, and a self-developed Modbus/TCP communi-
cation client. The following list describes the trained
attacks, along with a brief explanation of the attack
flow.
5.1.1 Denial-of-Service (DoS) Attack
This attack was executed using the open source net-
work stress testing and Denial-of-Service attack tool
Low Orbit Ion Cannon (Batishchev, 2014) (LOIC)
and fping, which floods the system with packets. This
attack disrupts the PLC by flooding it with TCP and
UDP packets. Further, it also affected the HMI, which
froze or only received a small amount of data from the
PLC.
5.1.2 Man-in-the-Middle (MitM) Attacks
This type of attack was performed over Ethernet and
Wi-Fi between the prototype device and the PLC. The
entire traffic of these communication was intercepted
by the attacker. The round trip time (RTT) of the pac-
kets were increased, due to attacker activity.

5.1.3 Modbus/TCP Protocol Attack
We developed a Modbus/TCP protocol client that
overwrites the initialized memory addresses for the
Modbus/TCP variables. The request time was set to
20 ms in order to continuously overwrite the inter-
nal value of the temperature. Consequently, the data
logger collects fake data and the attacker is able to
modify occuring anomaly data to normal behavior.
5.1.4 Dictionary Attack
In order to execute a dictionary attack, the web login
interface is tested with several login attempts. This at-
tack targets the web login interface of the PLC, which
offers the ability to change and monitor values of this
industrial control device. The dictionary attack is star-
ted while processing single products, in order to in-
crease CPU performance and possibly cause logic er-
rors or system crashes. The CPU of the PLC was so
overloaded that the screen of the HMI froze, since
no further packets were sent to the HMI and only a
small amount were sent to the data logger. This CPU
flooding can also be compared to a DoS attack. Ho-
wever, the PLC is more vulnerable to web-login at-
tacks due to firmware upgrades regarding to DoS at-
tacks.
5.2 Training the Attack Model
Each of the previously mentioned attacks create a dif-
ferent system behavior of our conveyor belt system
and traffic data is logged using the prototype. In or-
der to start the anomaly detection process, features are
extracted and labels added to the data instances. The
example set contains 50 instances, 20 valid and five
for each performed attack, respectively.
Figure 2 demonstrates the supervised attacks. It
shows the RTT of the packets while normal system
behavior, a MitM attack against the PLC and a dictio-
nary attack against the PLC web interface occur. The
duration of the single packets represents that a MitM
attack increases the RTT to approx. 96 ms, whereas a
dictionary attack vastly increases it to a RTT value up
to 1 s. We used this data as training data for creating
the attack model. We finally implemented the naive
Bayes classifier, as it allows probabilistic classifica-
tion of unknown data by experimenting with several
classification algorithms. After performing a 10-fold
cross-validation on the training dataset in order to es-
timate the statistical performance of the learning ope-
rator, the process output a confusion matrix, as shown
in Table 1. The accuracy of the process was 96%, with
two misclassifications. It is important to note that the
valid class scored 100% class precision.
Table 1: Confusion Matrix of Cross-Validation Statistics.
a b c d e f g <– classified as
20 0 0 0 0 0 0 a = Valid
0 4 0 0 1 0 0 b = DoS-PLC
0 0 5 0 0 0 0 c = Modbus-Temp
0 0 0 4 1 0 0 d = MitM
0 0 0 0 5 0 0 e = MitM-WLAN
0 0 0 0 0 5 0 f = Dict-Web-Login
0 0 0 0 0 0 5 g = DoS-HMI
With this model we present a basis for classifying
unknown attacks against our testbed. New attacks,
known or unknown, will be imported to the attack
model and trained by the classifier. A more detailed
description about the classifier, trainings data as well
as classifying unknown attacks can be found in our
previous work (Kreimel et al., 2017).
6 TESTING THE APPROACH ON
REAL SYSTEM DATA
Our designed approach achieved very good results for
the collected data within the lab environment. There-
fore we established contact with a popular truck ma-
nufacturer, which provided us data from their pro-
duction plant. However, this data consists of only true
or false values and had to be elaborated and prepared
for the approach. The goal was to detect anomalies
based on results of our approach. To achieve this, se-
veral subgoals have been created:
• Detecting and subdividing the delivered data into
cycles in order to improve the processing of data
• Extracting features and defining a normal beha-
vior model
• Train valid data
• Performing simulated attacks
• Detecting these attacks
6.1 Data Acquisition
The data was delivered in form of a comma-separated
values (CSV) file, which contains about 1.1 million
data sets for each sensor and actor of the production
plant. The acquisition of the process data from the
plant was carried out over a period of approx. 6 hours
and should represent the normal system behavior wit-
hout any attacks. Furthermore, the provided data is
analyzed and prepared for defining cycles. For the ex-
traction of cycles, first the individual process data was
examined in order to be able to recognize dependen-
cies of the different switching states. Then the data
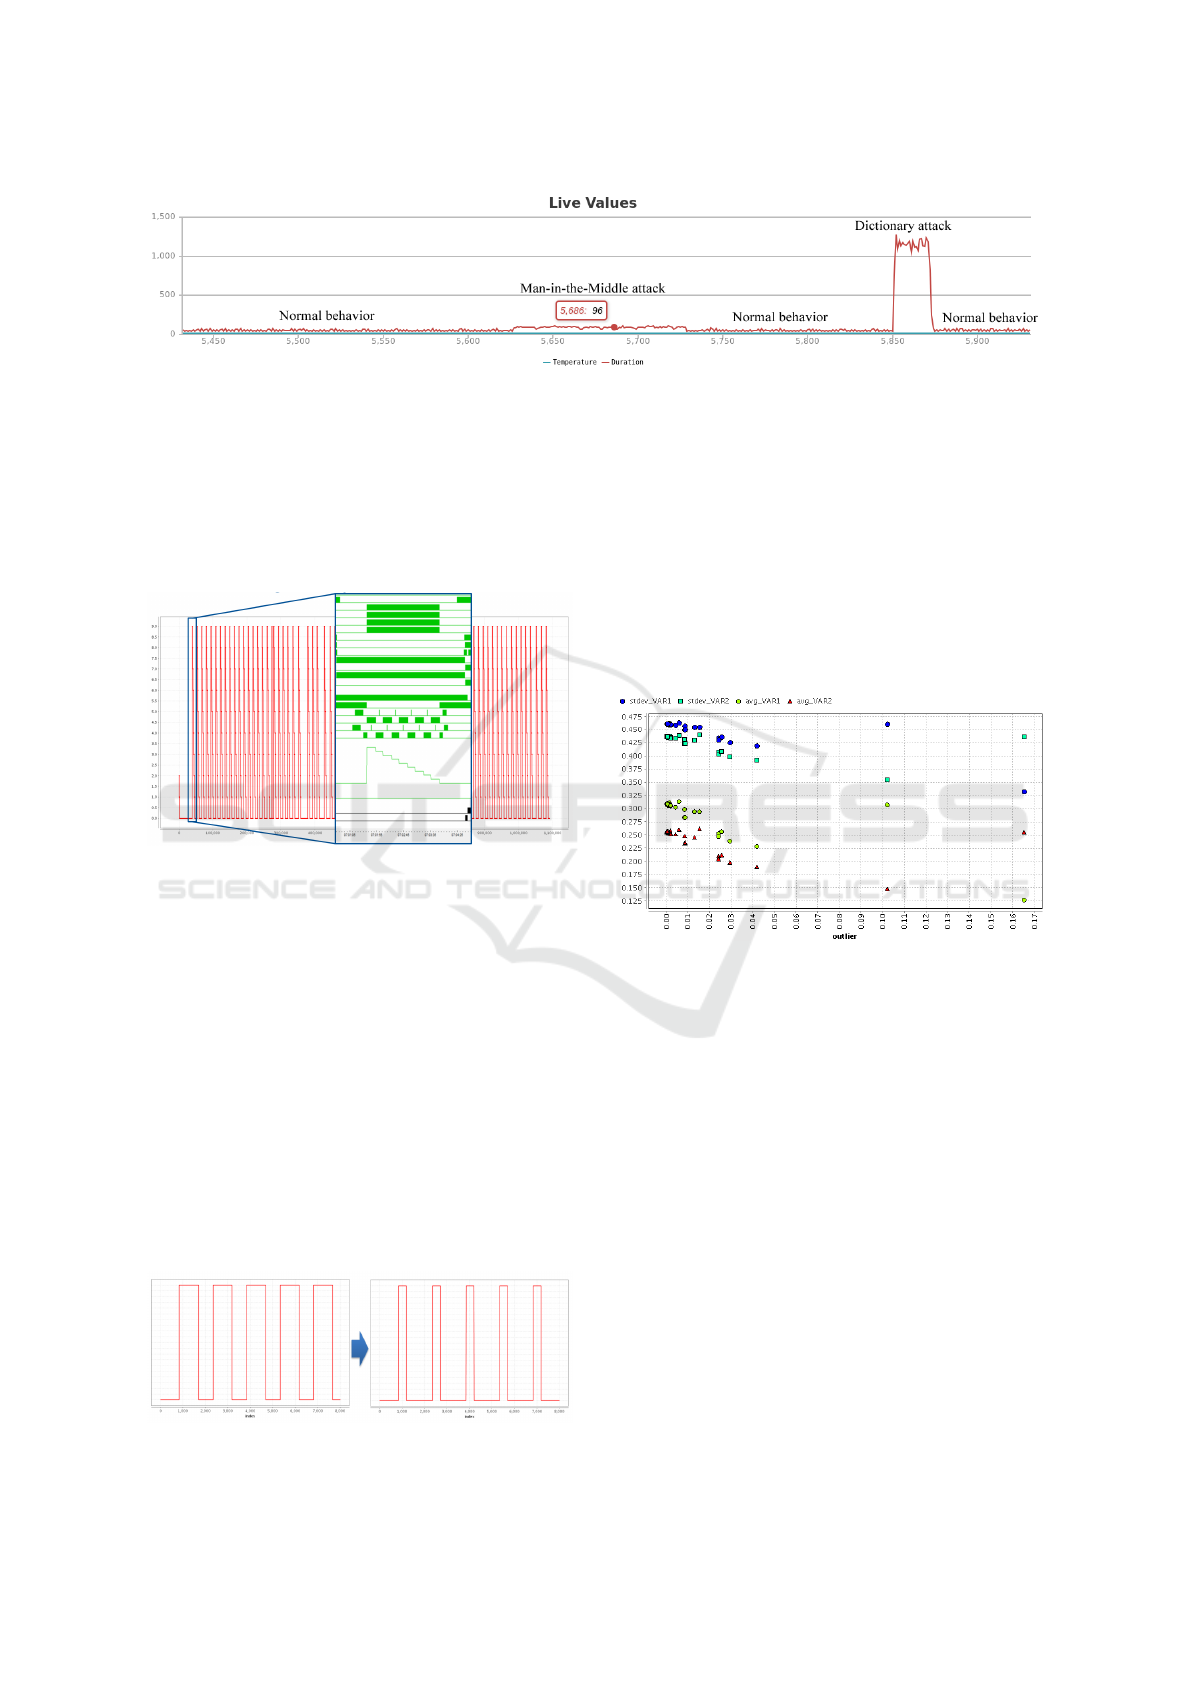
Figure 2: Supervised attacks in comparison.
was divided into smaller datasets and visualized after-
wards. As a result, we discovered that some switching
states were less important than others and the order of
the process flow. In Figure 3 a small abstract of the
data is visualized. It represents the subdivision of the
cycles. Further, the normal system behavior is trained
and attacks are performed to test our approach.
Figure 3: Extracting Cycles.
6.2 Simulation of Attacks
Before the anomaly detection process of our pro-
totype implementation is started, attacks have to be
simulated. For the simulation of attacks, individual
switching states from Figure 3 were analyzed in more
detail. We were able to detect several cycles with a
longer time lapse. Thus, for example, a denial-of-
service attack, in which process data arrives later or
not at all on the data logger, could be simulated by
modifying the timing of the process. An attack on the
engine of the production plant was carried out and the
switching states were delayed (Ren et al., 2016) (Gha-
leb et al., 2016). This generated process data can now
be used for our approach as test data. Figure 4 illus-
trates an attacker who increases the time interval of
Figure 4: Simulation of attacks.
these switching states in order to manipulate the en-
gine of the production plant.
6.3 Detection of Attacks
Before the anomaly detection was started, we adjus-
ted the feature selection to increase the information
gain and make it easier to detect deviations (Mantere
et al., 2012). Our approach provided us with accurate
outlier detection of individual variables, as shown in
Figure 5.
Figure 5: Outlier detection of calculated features.
Table 2 shows that two (simulated) attacks were
detected on the basis of the outliers. This table re-
presents a small output of the standard deviation and
average of two variables (switching states). The out-
lier value of both simulated attacks is above the de-
fined threshold value 0.05 and therefore is marked as
anomaly. The process data from the truck manufac-
turer showed that our approach also works for data
from operational plants, although the attack data is
being generated by us because it is difficult to carry
out attacks on a company system during operation.
7 CONCLUSIONS
In dealing with security challenges in industrial con-
trol systems, a second line of defense that monitors
the plants operations and can detect and classify ano-
malies is a must due to the critical nature of most of

Table 2: Outlier score for all data.
Label Outlier stdev VAR1 stdev VAR2 avg VAR1 avg VAR2
valid 0,0007 0,4612 0,4365 0,3068 0,2561
valid 0,0003 0,4614 0,4364 0,3073 0,2559
valid 0,0009 0,4614 0,4355 0,3074 0,2544
valid 0,0005 0,4623 0,4368 0,3095 0,2566
valid 0,0294 0,4262 0,3988 0,2385 0,1984
valid 0,0086 0,4507 0,4247 0,2834 0,2361
valid 0,0019 0,4611 0,4347 0,3066 0,2528
valid 0,0004 0,4622 0,4369 0,3093 0,2569
valid 0,0355 0,4252 0,4368 0,2888 0,2559
attack 0,1652 0,3333 0,4363 0,1272 0,2558
attack 0,1021 0,4614 0,3551 0,3073 0,148
such systems. In order to show the viability of ano-
maly detection and classification in industrial settings
a testbed with real industrial components was set up
data generated during normal operations was captured
to train a behavioral model.
Subsequently several cyber-attacks were launched
against the test setup. Based on these supervised at-
tacks, an attack model was trained using the naive
Bayes classifier. If an anomaly is detected, the classi-
fication process tries to classify the anomaly by ap-
plying the attack model and calculating prediction
confidences for trained classes.
We used this data as training data for creating
the attack model. We finally implemented the naive
Bayes classifier, as it allows probabilistic classifica-
tion of unknown data by experimenting with several
classification algorithms. The accuracy of the process
was 96%, with two misclassifications. New attacks,
known or unknown, will be imported to the attack mo-
del and trained by the classifier.
The results show clearly that attacks against indus-
trial control systems can be detected using our ano-
maly detection and classifying approach. Particularly
known attacks that have been trained by the classifier
can be classified with high accuracy. Furthermore, we
tested our approach on real data from a production fa-
cility. This process data from the truck manufacturer
showed that our approach also works for data from
real operational plants.
Further work will comprise the improvement of
the attack classification process by widening the
spectrum of anomaly detection to other types of
cyber-attacks.
ACKNOWLEDGEMENTS
Our project is funded by the KIRAS program of the
Austrian Research Promotion Agency (FFG). KIRAS
funds projects in the field of security, with IT security
being a subcategory in this context.
REFERENCES
Batishchev, A. (2014). Low Orbit Ion Cannon.
https://sourceforge.net/projects/loic/.
Chen, T. M. (2010). Stuxnet, the real start of cyber warfare?
[editor’s note]. IEEE Network, 24(6):2–3.
Cheung, S., Dutertre, B., Fong, M., Lindqvist, U., Skinner,
K., and Valdes, A. (2007). Using model-based intru-
sion detection for scada networks. In Proceedings of
the SCADA Security Scientific Symposium, Miami Be-
ach, Florida.
Dieterle, D. (2012). Israel’s Cyber Defenses Protect Go-
vernment Sites from 44 Million Attacks. CYBER
ARMS - Computer Security.
Eigner, O., Kreimel, P., and Tavolato, P. (2016). Detection
of man-in-the-middle attacks on industrial control net-
works. In 2016 International Conference on Software
Security and Assurance (ICSSA), pages 64–69.
Falliere, N., Murchu, L. O., and Chien, E. (2011). W32.
stuxnet dossier. White paper, Symantec Corp., Secu-
rity Response, 5.
Garitano, I., Uribeetxeberria, R., and Zurutuza, U. (2011).
A review of scada anomaly detection systems. In
Soft Computing Models in Industrial and Environmen-
tal Applications, 6th International Conference SOCO
2011, pages 357–366. Springer.
Ghaleb, A., Zhioua, S., and Almulhem, A. (2016). Scada-
sst: a scada security testbed. In 2016 World Congress
on Industrial Control Systems Security (WCICSS), pa-
ges 1–6.
Goldenberg, N. and Wool, A. (2013). Accurate modeling
of Modbus/TCP for intrusion detection in SCADA sy-

stems. International Journal of Critical Infrastructure
Protection, 6(2):63 – 75.
Haaretz (2017). Cyber Attack Against Israeli Websites
Used Local Computers, Security Expert Says. Haar-
etz.
Jeon, S., Yun, J.-H., Choi, S., and Kim, W.-N. (2016). Pas-
sive Fingerprinting of SCADA in Critical Infrastruc-
ture Network without Deep Packet Inspection. ArXiv
e-prints.
Keliris, A., Salehghaffari, H., Cairl, B., Krishnamurthy, P.,
Maniatakos, M., and Khorrami, F. (2016). Machine
learning-based defense against process-aware attacks
on industrial control systems. In 2016 IEEE Interna-
tional Test Conference (ITC), pages 1–10.
Kreimel, P., Eigner, O., and Tavolato, P. (2017). Anomaly-
based detection and classification of attacks in cyber-
physical systems. In Proceedings of the 12th Interna-
tional Conference on Availability, Reliability and Se-
curity, ARES ’17, pages 40:1–40:6, New York, NY,
USA. ACM.
Mantere, M., Sailio, M., and Noponen, S. (2012). Fea-
ture selection for machine learning based anomaly de-
tection in industrial control system networks. In 2012
IEEE International Conference on Green Computing
and Communications, pages 771–774.
Offensive Security (2017). Kali Linux. https://
www.kali.org/.
Peng, Y., Xiang, C., Gao, H., Chen, D., and Ren, W. (2015).
Industrial Control System Fingerprinting and Ano-
maly Detection, pages 73–85. Springer International
Publishing, Cham.
Ren, W., Granda, S., Yardley, T., Lui, K. S., and Nahrstedt,
K. (2016). Olaf: Operation-level traffic analyzer fra-
mework for smart grid. In 2016 IEEE International
Conference on Smart Grid Communications (Smart-
GridComm), pages 551–556.
Slay, J. and Miller, M. (2008). Lessons Learned from the
Maroochy Water Breach, pages 73–82. Springer US,
Boston, MA.
Traynor, I. (2014). Russia accused of unleashing cyberwar
to disable Estonia. The Guardian.
Zhang, J., Gan, S., Liu, X., and Zhu, P. (2016). Intru-
sion detection in scada systems by traffic periodicity
and telemetry analysis. In 2016 IEEE Symposium on
Computers and Communication (ISCC), pages 318–
325. IEEE.
