
The Effectiveness of Data Augmentation for Detection of Gastrointestinal
Diseases from Endoscopical Images
Andrea Asperti and Claudio Mastronardo
Department of Informatics: Science and Engineering (DISI), University of Bologna,
Mura Anteo Zamboni 7, 40127, Bologna, Italy
Keywords:
Data Augmentation, Deep Learning, Gastrointestinal Disease, Endoscopy, Kvasir.
Abstract:
The lack, due to privacy concerns, of large public databases of medical pathologies is a well-known and ma-
jor problem, substantially hindering the application of deep learning techniques in this field. In this article,
we investigate the possibility to supply to the deficiency in the number of data by means of data augmen-
tation techniques, working on the recent Kvasir dataset (Pogorelov et al., 2017) of endoscopical images of
gastrointestinal diseases. The dataset comprises 4,000 colored images labeled and verified by medical endo-
scopists, covering a few common pathologies at different anatomical landmarks: Z-line, pylorus and cecum.
We show how the application of data augmentation techniques allows to achieve sensible improvements of the
classification with respect to previous approaches, both in terms of precision and recall.
1 INTRODUCTION
Gastrointestinal diseases affect 60 to 70 million of
people every year in the United States (NID, 2017).
Diagnosis of such diseases has to be done by a trained
gastroenterologist. Such diagnosis often involves one
or more invasive and not invasive endoscopic exami-
nations enabling a direct and visual feedback of the
status of internal organs. In this case, it is essen-
tial to be able to perform a detailed image analysis
in order to diagnose the disease. For example, the
degree of inflammation directly affects the choice of
therapy in inflammatory bowel diseases (IBD) (Walsh
et al., 2014). In recent years, automatic elaboration
of digital images has seen an enormous increment
of research interest due to latest impressive results
on many computer vision sub-related tasks. Such
results almost always involved deep learning based
algorithms. Notoriously, deep learning techniques
frequently require a very large amount of training
examples, and the availability of several such large
datasets(Deng et al., 2009)(Krizhevsky et al., ) has
heavily contributed to the evolution of the field. To
make an example, ImageNet is composed of over 14
million images, spread over 22K different categories.
Since automatic detection, recognition and assess-
ment of pathological findings can provide a valid as-
sistance for doctors in their diagnosis, there is a grow-
ing demand for medical datasets, especially in rela-
tion with the application of deep learning techniques
in this field.
A recent example of such a dataset for gastroin-
testinal diseases is Kvasir (Pogorelov et al., 2017),
comprising about 4,000 colored images labeled and
verified by medical endoscopists (for details on the
dataset and the pathologies see Section 3).
Unfortunately, the dataset is quite small for the
purposes of deep learning. This is a well-known prob-
lem of this field: building large databases of labeled
information is not only an expensive operation, re-
quiring the supervision of an expert, but in the case
of medical pathologies, it is even more difficult due to
the privacy constraints preventing the publication of
sensible data.
In this article, following similar successful at-
tempts made on different datasets (see Section 2), we
show that data augmentation can provide a valid pal-
liative to the small dimension of the above mentioned
dataset, proving that the problem of automatic diag-
nosing of gastrointestinal diseases from images can be
successfully addressed by means of deep learning al-
gorithms. Specifically we make use of transfer learn-
ing (Bengio, 2012), Convolutional Neural Networks
(CNNs) (LeCun et al., 1989), data augmentation tech-
niques (see e.g. (Wong et al., 2016) for a recent sur-
vey) and snapshot ensembling (Huang et al., 2017a),
obtaining sensible improvements in the classification
with respect to previous approaches, both in terms of
Asperti, A. and Mastronardo, C.
The Effectiveness of Data Augmentation for Detection of Gastrointestinal Diseases from Endoscopical Images.
DOI: 10.5220/0006730901990205
In Proceedings of the 11th International Joint Conference on Biomedical Engineering Systems and Technologies (BIOSTEC 2018) - Volume 2: BIOIMAGING, pages 199-205
ISBN: 978-989-758-278-3
Copyright © 2018 by SCITEPRESS – Science and Technology Publications, Lda. All rights reserved
199
precision and recall.
The structure of the article is the following. In
Section 2 we discuss related works, especially from
the point of view of data augmentation. Section 3
contains a detailed description of the Kvasir dataset,
used for our experiments. In Section 4, we explain our
methodology. The experimental results are reported
in Section 5. Section 6 is devoted to our plans for fu-
ture research on this topic. Finally, a few concluding
remarks are given in Section 7.
2 RELATED WORK
Data augmentation is a key technique of machine
learning. It consists in increasing the number of data,
by artificially synthesizing new samples from existing
ones, usually via minor perturbations. For instance,
in the case of images, typical operations are rotation,
lighting modifications, rescaling, cropping and so on;
even adding random noise can be seen as a form of
data augmentation. Usually deployed as a means for
reducing overfitting and improving the robustness of
systems (see e.g. (Prisyach et al., 2016) for a re-
cent application to sound recognition), it frequently
proved to be also useful for improving the perfor-
mance of deep learning techniques, especially in pres-
ence of a low number of training data. In the field of
image processing, a sophisticated form of data aug-
mentation (the so called fancy PCA technique) was
a key ingredient of the famous AlexNet (Krizhevsky
et al., 2012). More recently, massive data augmen-
tation was exploited in (Farfade et al., 2015), where
for the first time a single deep architectural network
was trained to detect faces under unconstrained con-
ditions, and in a wide range of different orientations.
Similarly, addressing a problem of relational classi-
fication in Natural Language Processing, (Xu et al.,
2016) have been able to outperform previous shallow
neural nets by just augmenting the number of input
sentences by means of simple grammatical manipu-
lations. In the field of medicine, data augmentation
has been very recently applied in (Vasconcelos and
Vasconcelos, 2017) in relation with the ISBI 2017
Melanoma Classification Challenge (named Skin Le-
sion Analysis towards Melanoma Detection), success-
fully overcoming the small dimension and biased na-
ture of the biological database.
A large number of different augmentation tech-
niques has been recently compared in (Wang and
Perez, 2017), comprising sophisticated techniques
based on Generative Adversarial Networks (Goodfel-
low et al., 2014), using the CycleGan tool (Zhu et al.,
2017). According to this study, traditional augmenta-
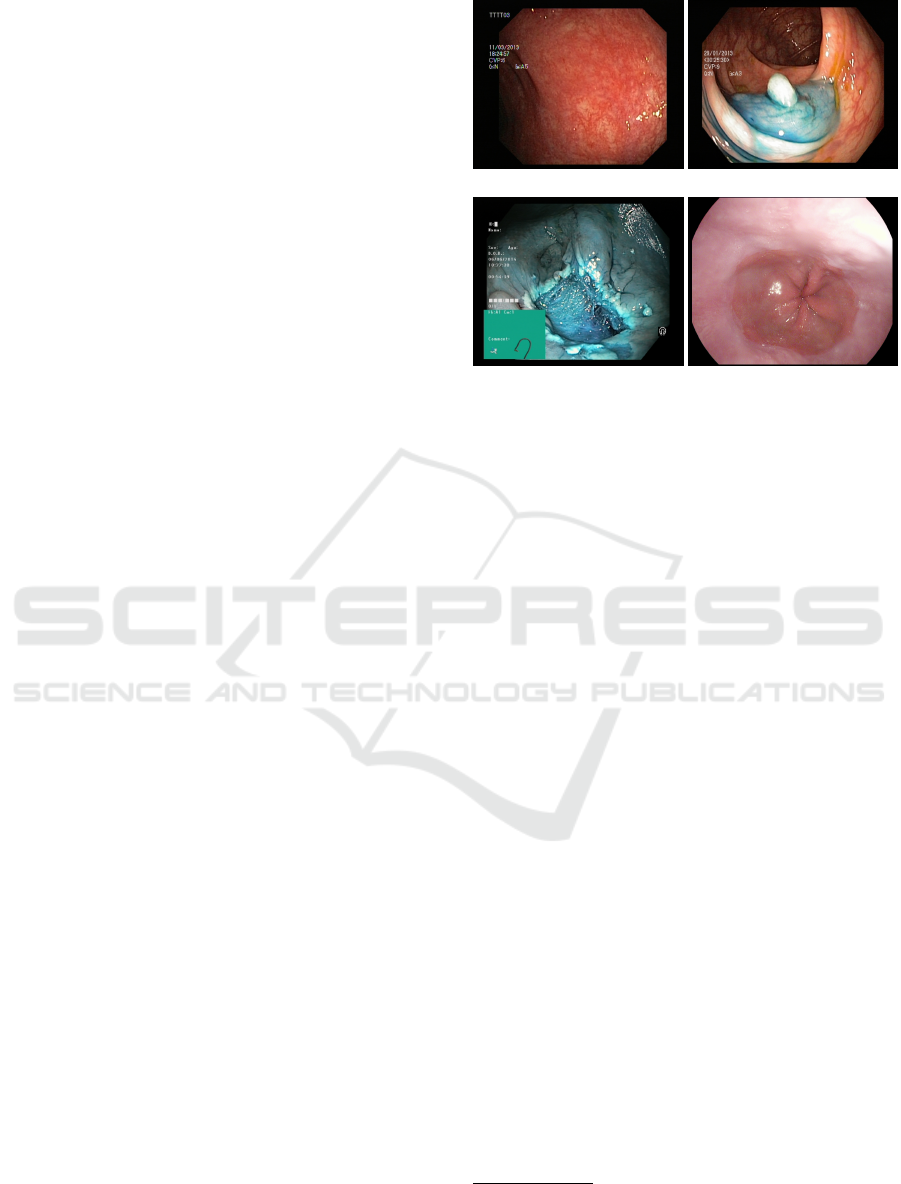
(a) Ulcerative colitis (b) Dyed lifted polyp
(c) Dyed resection margin (d) Normal z-line
Figure 1: Some images extracted from the KVASIR dataset.
tion techniques remain the most successful, motivat-
ing our choice of sticking to them in this work.
3 DATASET
For our experiments, we worked on the recently pub-
lished Kvasir dataset (Pogorelov et al., 2017). The
Kvasir dataset has been created in order to be used to
improve applications involving automatic detection,
classification and localization of endoscopic patho-
logical findings in images captured in the gastroin-
testinal tract. This new dataset comprises of 4,000
colored images
1
labeled and verified by medical en-
doscopists. It has 8 classes representing several dis-
eases as well as normal anatomical landmarks. The
dataset has 500 examples for each class, making it
perfectly balanced.
The anatomical landmarks are: Z-line, pylorus
and cecum. Diseases: esophagitis, polyps and ulcer-
ative colitis. There are also images representing dyed
and lifted polyps and dyed resection margins. Images
across the dataset have resolution from 720x576 up to
1920x1072 pixels. Some extracted images are shown
in Figure 1.
4 APPROACH
Our approach is an ensemble of models created by
using transfer learning from previously trained con-
1
We used the first version of the dataset. In date
17/10/2017 a second version of the Kvasir dataset has been
released. This new version has 8,000 images.
KALSIMIS 2018 - Special Session on Knowledge Acquisition and Learning in Semantic Interpretation of Medical Image Structures
200
volutional neural nets and data augmentation.
4.1 Transfer Learning
In order to save computation time and focus on the
high level representations learned by CNNs we used
a transfer learning approach(Bengio, 2012). We used
Inception v3 model(Szegedy et al., 2016) and Keras
library(Chollet et al., 2015) with Tensorflow(Abadi
et al., 2015) as backend. We loaded pre-trained
weights learned on the Imagenet(Deng et al., 2009)
dataset and cut the last dense layers. After the last
convolutional layer we added a global averaging pool-
ing layer, a dense layer with 1024 neurons with
ReLU(Nair and Hinton, 2010) as activation function
and finally a softmax layer of 8 neurons, one for every
class. All images have been resized to a resolution of
299x299 in order to be fed to Inception v3.
We froze all Inception’s already trained layers and
used Adam optimizer(Kingma and Ba, 2014) to tune
last dense layers’ weights. Categorical cross-entropy
has been used as the loss function.
After several epochs we started modifying both
last dense layers’ weights and convolutional layers
from the top 2 inception blocks from Inception v3.
We switched to stochastic gradient descent(Zhang,
2004) with momentum, enabling us to use a very
small learning rate (0.0001) in order to make sure
that the magnitude of the updates stays very small
and does not break previously learned features. We
trained for about 17 epochs (losses for the fine tuning
phase in Figure 5). In both fine-tuning phases a batch
size of 16 instances has been used.
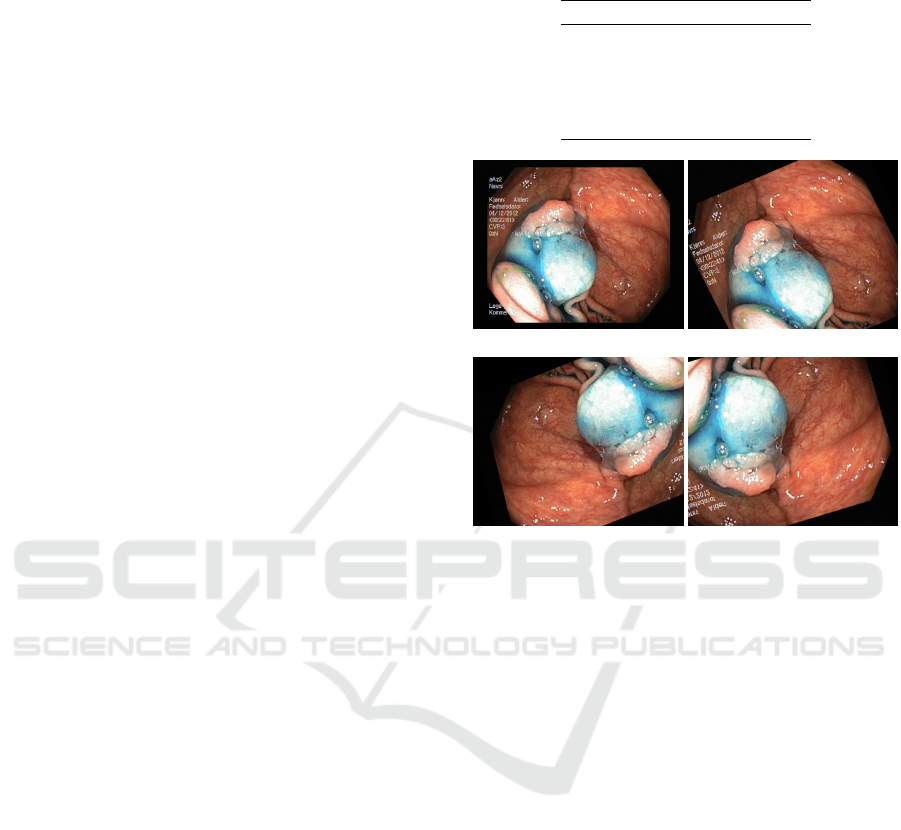
4.2 Data Augmentation
A key role in our results has been represented by us-
ing several data augmentation techniques. In order to
make our model more robust, prevent overfitting and
enabling it to generalize better we used Keras’ util-
ities to augment training instances by applying sev-
eral random transformations. Values for parameters’
based transformations have been picked randomly in
defined ranges. A list of data augmentation transfor-
mations (and their chosen range of action) used dur-
ing training is reported in the table 1.
Since images were black bordered we didn’t use
much of zooming out to prevent the generation of im-
ages having too much black component. When hav-
ing to fill pixels due to zooming out and shifting we
adopted a nearest pixel policy, repeating nearest pixel
value across the axis. Moreover we used random hor-
izontal flips and vertical flips.
Table 1: Data augmentation transformations and their range
values.
Type Range
Rotation [-30
◦
, +30
◦
]
Width shift 0.1
Height shift 0.1
Shear 0.2
Zoom [0.8, 1.1]
(a) Original image (b) Shearing and rotation
(c) Rotation and shifting (d) Rotation and zooming
Figure 2: Augmented examples.
To normalize both training and test data we di-
vided every pixel’s color value by 255 in order to have
all pixel values in the range [0,1].
During training we kept generating new images
following this data augmentation policy, never feed-
ing the same images to the network. Some examples
of augmented images are reported in figure 2.
4.3 Snapshot Ensembling
To improve classification precision and avoid to be
trapped in local minima, we adopted an ensembling
approach. In particular, we used Snapshot ensembling
(Huang et al., 2017a) allowing us to execute one train-
ing but getting several models. Snapshot Ensembling
is a method to obtain multiple neural networks at no
additional training cost. This is achieved by letting
a single model converge into several different local
minima along its optimization path on the error sur-
face. Saving network weights at certain epochs con-
stitutes saving several ”snapshots” (see Figure 3 for a
visual representation). Since, in general, there exist
multiple local minima, snapshot ensembling let’s the
current model dive into a minima using a decreasingly
learning rate value, save the snapshot at that minimum
and then increase the learning rate in order to escape
The Effectiveness of Data Augmentation for Detection of Gastrointestinal Diseases from Endoscopical Images
201
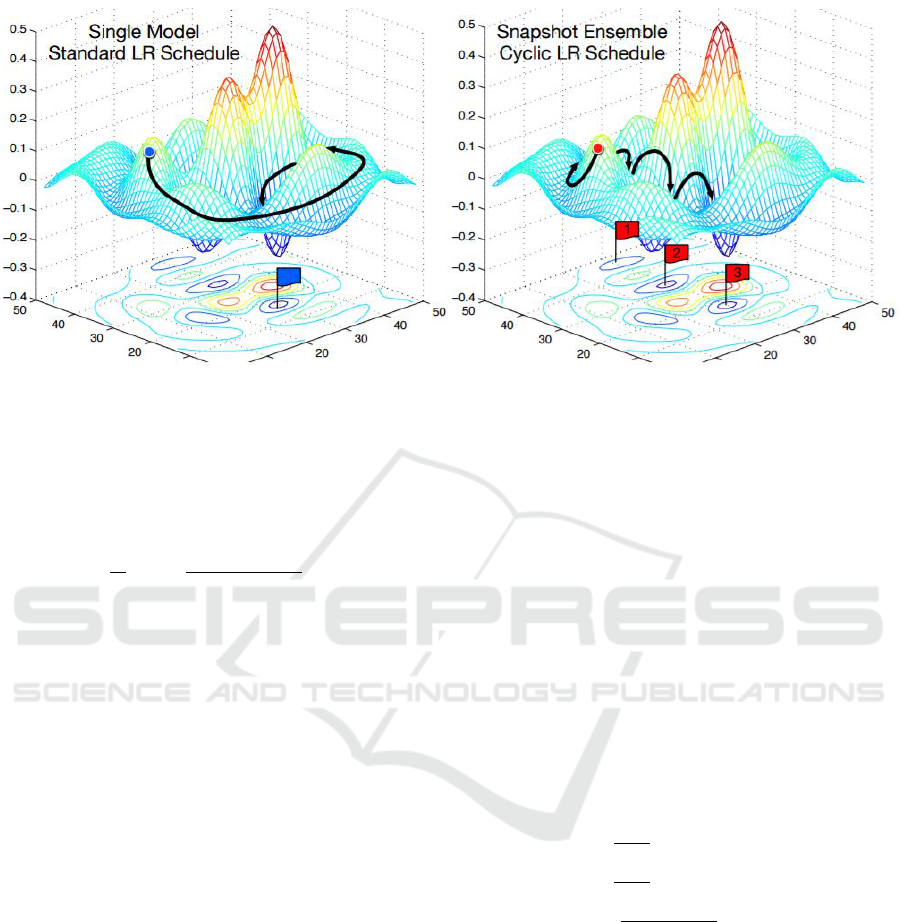
Figure 3: Left: Classic SGD. Right: Snapshot ensembling converging to several minima and taking snaphots. Image bor-
rowed from (Huang et al., 2017a).
the local minima and attempt to find another possi-
bly better minima. This repeated rapid convergence
is achieved taking advantage of cosine annealing cy-
cles as the learning rate schedule. The learning rate is
achieved by :
α(t) =
α
0
2
cos
π mod(t−1,
d
T /M
e
d
T /M
e
+ 1
where α
0
stands for the initial learning rate, t is the
current epoch, T is the total number of epochs and M
is the chosen number of models in the ensemble. For
our experiments we used an initial learning rate of 0.1,
we trained for about 22 epochs and we’ve chosen an
ensemble with 5 models (T = 5).
5 EXPERIMENTAL RESULTS
5.1 Classification Metrics
Following (Pogorelov et al., 2017), classification has
been tested using traditional metrics like precision, re-
call, F1 score and accuracy. Precision is the fraction
of relevant instances (True Positives) among the re-
trieved instances, while recall (or sensitivity) is the
fraction of relevant instances that have been retrieved
over the total amount of relevant instances; F1-score
is a simple combination of precision and recall ex-
pressed in terms of their harmonic mean; finally, ac-
curacy is simply the fraction of correctly classified
samples.
While the notions of precision and recall are clear
in the case of a binary classification problem, their
generalization to multiclass classification is not en-
tirely straightforward. There are several possible
ways to combine results across labels, and unfortu-
nately (Pogorelov et al., 2017) are not explicit about
the method they used. For this reason, we tested sev-
eral of them, whose precise definition is given below.
Fortunately, results are very similar, and we shall only
report them for the so called ”micro” averaging.
Let us introduce the following notation
• let y be the set of predicted (input, label) pairs
• let ˆy be the set of true (input, label) pairs
• let L be the set of labels
• let S be the set of samples
• let y
s
( ˆy
s
) be the subset of y (resp. ˆy) with sample
s
• let y
l
( ˆy
l
) be the subset of y (resp. ˆy) with label l
• let P(A,B) =
|A∩B|
A
• let R(A,B) =
|A∩B|
B
• let F
1
(A,B) =
P(A,B)×R(A,B)
P(A,B)+R(A,B)
In Figure 4, we give the formal definition of the
most typical forms of averaging.
5.2 Evaluation
We computed the metrics from the produced confu-
sion matrix (see 2), in order to compare our approach
to the previous ones (Pogorelov et al., 2017) splitting
the dataset into training and test sets.
Results are reported in table 3. All
metrics have been computed using the
precision_recall_fscore_support function
of scikit-learn (Pedregosa et al., 2011).
KALSIMIS 2018 - Special Session on Knowledge Acquisition and Learning in Semantic Interpretation of Medical Image Structures
202
Average Precision Recall F
1
micro P(y, ˆy) R(y, ˆy) F
1
(y, ˆy)
samples
1
|S|
∑
s∈S
P(y
s
, ˆy
s
)
1
|S|
∑
s∈S
R(y
s
, ˆy
s
)
1
|S|
∑
s∈S
F
1
(y
s
, ˆy
s
)
macro
1
|L|
∑
l∈L
P(y
l
, ˆy
l
)
1
|L|
∑
l∈L
R(y
l
, ˆy
l
)
1
|L|
∑
l∈L
F
1
(y
l
, ˆy
l
)
weighted
1
∑
l∈L
| ˆy
l
|
∑
l∈L
| ˆy
l
|P(y
l
, ˆy
l
)
1
∑
l∈L
| ˆy
l
|
∑
l∈L
| ˆy
l
|R(y
l
, ˆy
l
)
1
∑
l∈L
| ˆy
l
|
∑
l∈L
| ˆy
l
|F
1
(y
l
, ˆy
l
)
Figure 4: Typical averaging techniques for classification metrics.
Table 2: Confusion matrix produced by the ensem-
ble. A=Dyed lifted polyps, B=Dyed resection mar-
gins, C=Esophagitis, D=Normal cecum, E=Normal py-
lorus, F=Normal z-line, G=Polyps and H=Ulcerative coli-
tis.
Actual class
Predicted class
A B C D E F G H
A 46 8 0 0 0 0 0 0
B 4 42 0 0 0 0 0 0
C 0 0 39 0 0 7 0 0
D 0 0 0 50 0 0 1 0
E 0 0 0 0 50 0 1 0
F 0 0 11 0 0 43 0 0
G 0 0 0 0 0 0 47 1
H 0 0 0 0 0 0 1 49
(a) Training loss (b) Test loss
Figure 5: Categorical cross-entropy error in function of
training and test epochs.
Our model achieves better scores for precision, re-
call and f-measure while essentially preserving the
same accuracy with respect to the previous tested so-
lutions(Pogorelov et al., 2017). We found that the
model is particularly precise in classifying examples
belonging to normal cecum and normal pylorus.
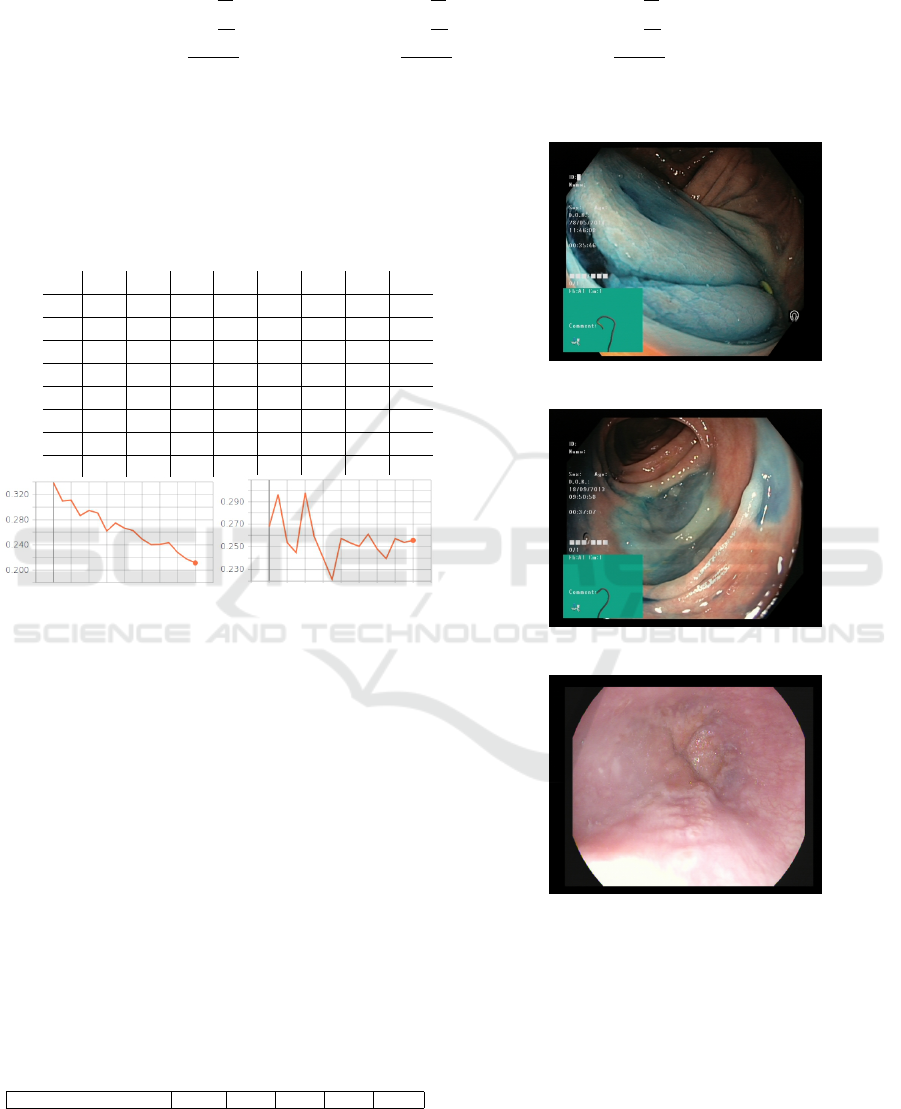
Misclassifications mostly involve dyed lifted
polyps and dyed resection margins (e.g. see figure
6 for some examples). In fact, these two classes are
made up of very similar images, having the same
amount of blue color. Moreover some other misclas-
sified instances belong to normal z-line and esophagi-
tis. This is reasonable since some cases of esophagi-
tis are not so clearly spotted in images, where it may
be confused with the gastroesophageal junction that
Table 3: Our metrics compared to the best ones reported in
(Pogorelov et al., 2017). All metrics are micro averaged.
Method PREC REC ACC F1 MCC
2 GF Logistic Model Tree 0.706 0.707 0.926 0.705 0.664
6 GF Random Forest 0.732 0.732 0.933 0.727 0.692
6 GF Logistic Model Tree 0.748 0.748 0.937 0.747 0.711
Ensemble of Inception+
fine tuning+
data augmentation 0.915 0.915 0.915 0.915 0.903
(a) predicted: lifted polyp
actual: resection margin
(b) predicted: resection margin
actual: lifted polyp
(c) predicted: esophagitis
actual: normal z-line
Figure 6: Some misclassified samples.
joins the esophagus to the stomach. An example is
reported in figure 6 (c) where the classifier predicted
esophagitis instead of z-line. This error might be re-
lated to specific z-line tissues being visually similar to
an esophagitis of grade A (Lundell et al., 1999) (low-
est inflammatory grade).
Misclassifications could be possibly overcame try-
ing to train the network for a greater number of
epochs, or working with the new extended version of
The Effectiveness of Data Augmentation for Detection of Gastrointestinal Diseases from Endoscopical Images
203

the dataset. Prediction confusion might be improved
increasing the number of samples from the dyed lifted
polyps and dyed resection margins as well as from z-
line and esophagitis classes.
6 FUTURE WORK
Several deep convolutional neural networks have been
published since Inception v3, such as (Huang et al.,
2017b), (He et al., 2015) (Zhu et al., 2017), (Wong
et al., 2016), (Xu et al., 2016). Experiments can be
done using these newly proposed architectures in con-
junction with data augmentation techniques.
Stacking additional dense layers can be another
direction worth to be investigated, as well as mak-
ing a more exhaustive experimentation with different
activation functions such ELU (Clevert et al., 2015),
LeakyRelu (Zhu et al., 2017), Swish (Ramachandran
et al., 2017) etc.
A different investigation might consist in visual-
izing high level learned features from the last convo-
lutional layers, in order to improve our grasp of the
discriminative characteristics learned by the network.
All our experiments have been conducted over the
first version of the Kvasir dataset; repeting training
and validation on the recently released extended ver-
sion would provide an important additional validation
of our methodology.
Finally, it would be particularly useful to further
extend the Kvasir dataset with new classes, in order to
meet diagnosis needs in the direction of several other
very known and diffused diseases such as Chron’s dis-
ease. We are currently exploring the possibility to co-
operate with the gastroenterology department of the
Sant’Orsola Hospital in Bologna to extend the dataset
along these lines.
7 CONCLUSIONS
In this work we addressed the problem of gastroin-
testinal disease detection and identification. By a sim-
ple combination of Convolutional Neural Networks,
transfer learning, and data augmentation we outper-
fomed previous techniques in terms of precision, re-
call, and f-measure, while essentially preserving the
same accuracy. Our experimentation confirms once
more that data augmentation is a viable technique for
boosting deep learning in presence of small dataset.
REFERENCES
(2017). Digestive diseases statistics for the united states.
Accessed: 2017-11-03.
Abadi, M., Agarwal, A., Barham, P., Brevdo, E., Chen, Z.,
Citro, C., Corrado, G. S., Davis, A., Dean, J., Devin,
M., Ghemawat, S., Goodfellow, I., Harp, A., Irving,
G., Isard, M., Jia, Y., Jozefowicz, R., Kaiser, L., Kud-
lur, M., Levenberg, J., Man
´
e, D., Monga, R., Moore,
S., Murray, D., Olah, C., Schuster, M., Shlens, J.,
Steiner, B., Sutskever, I., Talwar, K., Tucker, P., Van-
houcke, V., Vasudevan, V., Vi
´
egas, F., Vinyals, O.,
Warden, P., Wattenberg, M., Wicke, M., Yu, Y., and
Zheng, X. (2015). TensorFlow: Large-scale machine
learning on heterogeneous systems. Software avail-
able from tensorflow.org.
Bengio, Y. (2012). Deep learning of representations for
unsupervised and transfer learning. In Guyon, I.,
Dror, G., Lemaire, V., Taylor, G., and Silver, D., edi-
tors, Proceedings of ICML Workshop on Unsupervised
and Transfer Learning, volume 27 of Proceedings of
Machine Learning Research, pages 17–36, Bellevue,
Washington, USA. PMLR.
Chollet, F. et al. (2015). Keras.
Clevert, D., Unterthiner, T., and Hochreiter, S. (2015). Fast
and accurate deep network learning by exponential
linear units (elus). CoRR, abs/1511.07289.
Deng, J., Dong, W., Socher, R., Li, L.-J., Li, K., and Fei-
Fei, L. (2009). ImageNet: A Large-Scale Hierarchical
Image Database. In CVPR09.
Farfade, S. S., Saberian, M. J., and Li, L. (2015). Multi-
view face detection using deep convolutional neural
networks. CoRR, abs/1502.02766.
Goodfellow, I. J., Pouget-Abadie, J., Mirza, M., Xu, B.,
Warde-Farley, D., Ozair, S., Courville, A., and Ben-
gio, Y. (2014). Generative Adversarial Networks.
ArXiv e-prints.
He, K., Zhang, X., Ren, S., and Sun, J. (2015). Deep resid-
ual learning for image recognition. arXiv preprint
arXiv:1512.03385.
Huang, G., Li, Y., Pleiss, G., Liu, Z., Hopcroft, J. E.,
and Weinberger, K. Q. (2017a). Snapshot ensembles:
Train 1, get M for free. CoRR, abs/1704.00109.
Huang, G., Liu, Z., van der Maaten, L., and Weinberger,
K. Q. (2017b). Densely connected convolutional net-
works. In Proceedings of the IEEE Conference on
Computer Vision and Pattern Recognition.
Kingma, D. P. and Ba, J. (2014). Adam: A method for
stochastic optimization. CoRR, abs/1412.6980.
Krizhevsky, A., Nair, V., and Hinton, G. Cifar-10 (canadian
institute for advanced research).
Krizhevsky, A., Sutskever, I., and Hinton, G. E. (2012).
Imagenet classification with deep convolutional neu-
ral networks. In Pereira, F., Burges, C. J. C., Bottou,
L., and Weinberger, K. Q., editors, Advances in Neu-
ral Information Processing Systems 25, pages 1097–
1105. Curran Associates, Inc.
LeCun, Y., Boser, B., Denker, J. S., Henderson, D., Howard,
R. E., Hubbard, W., and Jackel, L. D. (1989). Back-
KALSIMIS 2018 - Special Session on Knowledge Acquisition and Learning in Semantic Interpretation of Medical Image Structures
204

propagation applied to handwritten zip code recogni-
tion. Neural Computation, 1(4):541–551.
Lundell, L. R., Dent, J., Bennett, J. R., Blum, A. L., Arm-
strong, D., Galmiche, J. P., Johnson, F., Hongo, M.,
Richter, J. E., Spechler, S. J., Tytgat, G. N. J., and
Wallin, L. (1999). Endoscopic assessment of oe-
sophagitis: clinical and functional correlates and fur-
ther validation of the los angeles classification. Gut,
45(2):172–180.
Nair, V. and Hinton, G. E. (2010). Rectified linear units im-
prove restricted boltzmann machines. In F
¨
urnkranz, J.
and Joachims, T., editors, Proceedings of the 27th In-
ternational Conference on Machine Learning (ICML-
10), pages 807–814. Omnipress.
Pedregosa, F., Varoquaux, G., Gramfort, A., Michel, V.,
Thirion, B., Grisel, O., Blondel, M., Prettenhofer,
P., Weiss, R., Dubourg, V., Vanderplas, J., Passos,
A., Cournapeau, D., Brucher, M., Perrot, M., and
Duchesnay, E. (2011). Scikit-learn: Machine learning
in Python. Journal of Machine Learning Research,
12:2825–2830.
Pogorelov, K., Randel, K. R., Griwodz, C., Eskeland, S. L.,
de Lange, T., Johansen, D., Spampinato, C., Dang-
Nguyen, D.-T., Lux, M., Schmidt, P. T., Riegler, M.,
and Halvorsen, P. (2017). Kvasir: A multi-class im-
age dataset for computer aided gastrointestinal disease
detection. In Proceedings of the 8th ACM on Multime-
dia Systems Conference, MMSys’17, pages 164–169,
New York, NY, USA. ACM.
Prisyach, T., Mendelev, V., and Ubskiy, D. (2016). Data
augmentation for training of noise robust acoustic
models. In Analysis of Images, Social Networks and
Texts - 5th International Conference, AIST 2016, Yeka-
terinburg, Russia, April 7-9, 2016, Revised Selected
Papers, pages 17–25.
Ramachandran, P., Zoph, B., and Le, Q. V. (2017). Search-
ing for activation functions. CoRR, abs/1710.05941.
Szegedy, C., Vanhoucke, V., Ioffe, S., Shlens, J., and Wojna,
Z. (2016). Rethinking the inception architecture for
computer vision. In 2016 IEEE Conference on Com-
puter Vision and Pattern Recognition, CVPR 2016,
Las Vegas, NV, USA, June 27-30, 2016, pages 2818–
2826.
Vasconcelos, C. N. and Vasconcelos, B. N. (2017). Increas-
ing deep learning melanoma classification by classical
and expert knowledge based image transforms. CoRR,
abs/1702.07025.
Walsh, A., Ghosh, A., Brain, A., Buchel, O., Burger, D.,
Thomas, S., White, L., Collins, G., Keshav, S., and
Travis, S. (2014). Comparing disease activity indices
in ulcerative colitis. Journal of Crohn’s and Colitis,
8(4):318–325.
Wang, J. and Perez, L. (2017). The effectiveness of data
augmentation in image classification using deep learn-
ing. Technical report, Stanford University.
Wong, S. C., Gatt, A., Stamatescu, V., and McDonnell,
M. D. (2016). Understanding data augmentation for
classification: when to warp? CoRR, abs/1609.08764.
Xu, Y., Jia, R., Mou, L., Li, G., Chen, Y., Lu, Y., and Jin, Z.
(2016). Improved relation classification by deep recur-
rent neural networks with data augmentation. CoRR,
abs/1601.03651.
Zhang, T. (2004). Solving large scale linear prediction prob-
lems using stochastic gradient descent algorithms. In
Proceedings of the Twenty-first International Confer-
ence on Machine Learning, ICML ’04, pages 116–,
New York, NY, USA. ACM.
Zhu, J., Park, T., Isola, P., and Efros, A. A. (2017). Unpaired
image-to-image translation using cycle-consistent ad-
versarial networks. CoRR, abs/1703.10593.
The Effectiveness of Data Augmentation for Detection of Gastrointestinal Diseases from Endoscopical Images
205
