
White Blood Cells Counting Via
Vector Field Convolution Nuclei Segmentation
Simone Porcu, Andrea Loddo, Lorenzo Putzu and Cecilia Di Ruberto
University of Cagliari, Italy
Keywords:
WBC Count, Detection, Segmentation, Vector Field Convolution, Mathematical Morphology.
Abstract:
Haematological procedures like analysis, counting and classification of White Blood Cells (WBCs) are very
helpful in the medical field, in order to recognize a pathology, e.g., WBCs analysis leukaemia correlation.
Expert technicians manually perform these procedures, therefore, they are influenced by their tiredness and
subjectivity. Their automation is still an open issue. Our proposal aims to replicate every single step of
the haematologists’ job with a semi-automatic system. The main targets of this work are to decrease the
time needed for an analysis and to improve the efficiency of the procedure. It is based on the Vector Field
Convolution (VFC) to describe cells edges, going beyond more classic methods like the active contour model.
This approach is crucial to face the WBCs clumps and overlaps segmentation issue. To sum up, we defined
a system that is able to recognise the leukocytes, to differentiate them from the other blood cells and, finally,
to divide the overlapping leukocytes. Experimental results obtained on three public datasets showed that the
method is accurate and robust, outperforming the state of the art methods for cells clumps identification and
cells counting.
1 INTRODUCTION
Blood is a body fluid deliver. It contains and trans-
ports many of the nutrients substances that humans
need to live. Blood is mainly composed of two ele-
ments: cells and plasma. The blood cells are the red
blood cells (RBCs) and white blood cells (WBCs).
Haematology is the field related to the study of blood
conditions in order to measure the health status of the
patients. Nowadays the analysis work flow is a ma-
nual process. Every single blood slide is analysed by
an expert haematologist that counts and extracts the
needed information for the requested analysis. Ho-
wever it is a very delicate procedure and it is error-
prone. For this reason, having an automatic or semi-
automatic system would be useful to avoid issues.
The main contribute of this work is a semi-automated
method that can extract all the WBCs from the pe-
ripheral blood smear images and count every single
WBC in order to obtain their exact count. The pro-
posed system is based on a segmentation algorithm
especially designed for this purpose. No machine le-
arning approach has been used in our method, either
to increase the performances in detection and to avoid
the learning phase, that is slow and focused on a parti-
cular training set. Thus the proposed algorithm is not
tuned to a specific training set and it could be used
for whichever dataset of peripheral blood images. In
the literature there are a lot of methodologies devoted
to the identification and counting of single cells, but
only few works addressed clumped cells separation
and counting issues. For this reasons, this work is fo-
cused on the clumped cells separation issue. The rest
of the paper is organized as follows. Section 2 pre-
sents the related works about peripheral blood image
analysis. Section 3 illustrates the proposed method.
Section 4 presents the obtained results on the consi-
dered datasets. Discussions, conclusions and future
aspects are finally given in Section 5.
2 STATE OF THE ART
Commonly, blood cells images segmentation can be
performed with two different approaches: the first one
works at a cell level and the last one aims to do an
intra-cell segmentation. The purpose of the first one
is to discriminate foreground from background, while
the second one has the target to divide the different
components contained inside the cells, such as nu-
cleus from cytoplasm or intracellular parasites. For
example, Madhloom (Madhloom et al., 2010) imple-
Porcu, S., Loddo, A., Putzu, L. and Ruberto, C.
White Blood Cells Counting Via Vector Field Convolution Nuclei Segmentation.
DOI: 10.5220/0006723202270234
In Proceedings of the 13th International Joint Conference on Computer Vision, Imaging and Computer Graphics Theor y and Applications (VISIGRAPP 2018) - Volume 4: VISAPP, pages
227-234
ISBN: 978-989-758-290-5
Copyright © 2018 by SCITEPRESS – Science and Technology Publications, Lda. All rights reserved
227

mented an automated system to localise and segment
WBC nuclei based on arithmetical and threshold ope-
rations. Sinha (Sinha and Ramakrishnan, 2003) and
Kovalev (Kovalev et al., 1996) tried to differentiate
the leukocytes types typically contained in cell ima-
ges. Sinha used k-means clustering based on the HSV
colour space for WBCs segmentation. Kovalev firstly
identified the nuclei and then detected the entire mem-
brane by means of region growing techniques. A low-
pass filter has been employed (Scotti, 2006) in order
to remove background and, after that, WBCs segmen-
tation is approached with different threshold opera-
tions and image clustering. Piuri’s approach (Scotti
and Piuri, 2004) is based on edge detection for WBCs
segmentation. Halim (Halim et al., 2011) proposed
an automated blast counting method to detect acute
leukaemia in blood microscopic images that identifies
WBCs through a thresholding operation performed
on the S component of the HSV colour space, fol-
lowed by morphological erosion for image segmen-
tation. Mohapatra (Mohapatra et al., 2013) investi-
gated the early diagnosis of ALL in blood microsco-
pic images. The identification and segmentation of
WBCs is realised through image clustering followed
by the extraction of different types of features, such
as shape, contour, fractal, texture, colour and Fourier
descriptors, from the sub-image. Moving to the pro-
blem of clumped cells separation, some methods are
included in the process of segmentation, while others
are specifically dedicated to overlapping cells separa-
tion.The Watershed transform is certainly one of the
most common methods. Putzu (Putzu et al., 2014)
used the distance transform and the watershed algo-
rithm to separate cells agglomerates. The separation
is less influenced by cells shape, but it works only
for small or simple cells agglomerates. On the other
hand, Ghane (Ghane et al., 2017) used K-means al-
gorithm for nuclei segmentation and morphological
operators to remove small objects, obtaining an en-
hancement of the segmentation results. Finally, he
used the Watershed transform to split touching cells
and nuclei. Mahmood and Alomari (Mahmood et al.,
2013), (Alomari et al., 2014), differently from the pre-
vious, proposed two WBCs count methods based on
the circular Hough transform (CHT). Mahmood ap-
plied the CHT on binary images obtained from the
Lab colour space, while Alomari modified the CHT
in order to reduce the number of cells candidates by
choosing the one with the highest probability of being
a circle. A different approach has been proposed by
Alilou (Alilou and Kovalev, 2013), where a detection
phase using grey level co-occurrence matrix has been
applied directly on the original images without a pre-
vious segmentation. As it can be guessed, it produces
a significant amount of false positives since it works
without restrictions on the area of interest. Finally, Di
Ruberto (Di Ruberto et al., 2016) and Loddo (Loddo
et al., 2016) applied the CHT to recognize circular
shapes inside the clumped cells obtained in the seg-
mentation phase. To sum up, every non-classifier ba-
sed method typically works with the following stra-
tegy: first a threshold methodology is used to extract
the cells and then the clumped cells separation is re-
alized by using another method, e.g., the Watershed
transform. Our work aims to use a different appro-
ach. It performs the clumped cells separation along
with the segmentation step so that every identified re-
gion is obtained in only one computational step.
3 PROPOSED METHOD
The main target of our proposed method is to segment
all the WBCs nuclei by using Vector Field Convolu-
tion (VFC) strategy and to divide potential clumps
by using an analysis of the real cells boundaries,
overcoming the use of Watershed transform. The
system is composed of the following phases: pre-
processing, binary edge map generation, VFC (Bing
and Scott, 2007) application, grades transformation,
external energy computation, black and white dis-
tance calculation and, finally, skeletonizing and re-
gion merging application. Figure 1 shows the of pro-
posed method flow diagram. It starts with a contrast
stretching on the RGB colour space’s G channel. The
regions boundaries are extracted by means of a gra-
dient operator which permits to obtain a binary edge
map. Subsequently the VFC is computed with the
initialization of the kernel vector field and the edge
map creation. A first WBCs detection has been so far
obtained with the previous steps and a first nuclei seg-
mentation can be consequently obtained by applying
the skeleton function on the overlap between the ex-
ternal force and the binary distance transform ima-
ges. The final segmentation result is described in de-
tail further on.
3.1 Pre-processing
It is the first step of the proposed technique and it is
needed to extract all the information for WBCs areas
detection. WBCs nuclei has been highlighted by stret-
ching the histogram of RGB colour space’s G channel
(Figure2). The purpose is to obtain only the cells of
interest in order to create the best possible edge map.
The high spacial frequency regions, correspon-
ding to the edges, have been highlighted thanks to
the Sobel operator. It is a kind of orthogonal gradient
VISAPP 2018 - International Conference on Computer Vision Theory and Applications
228
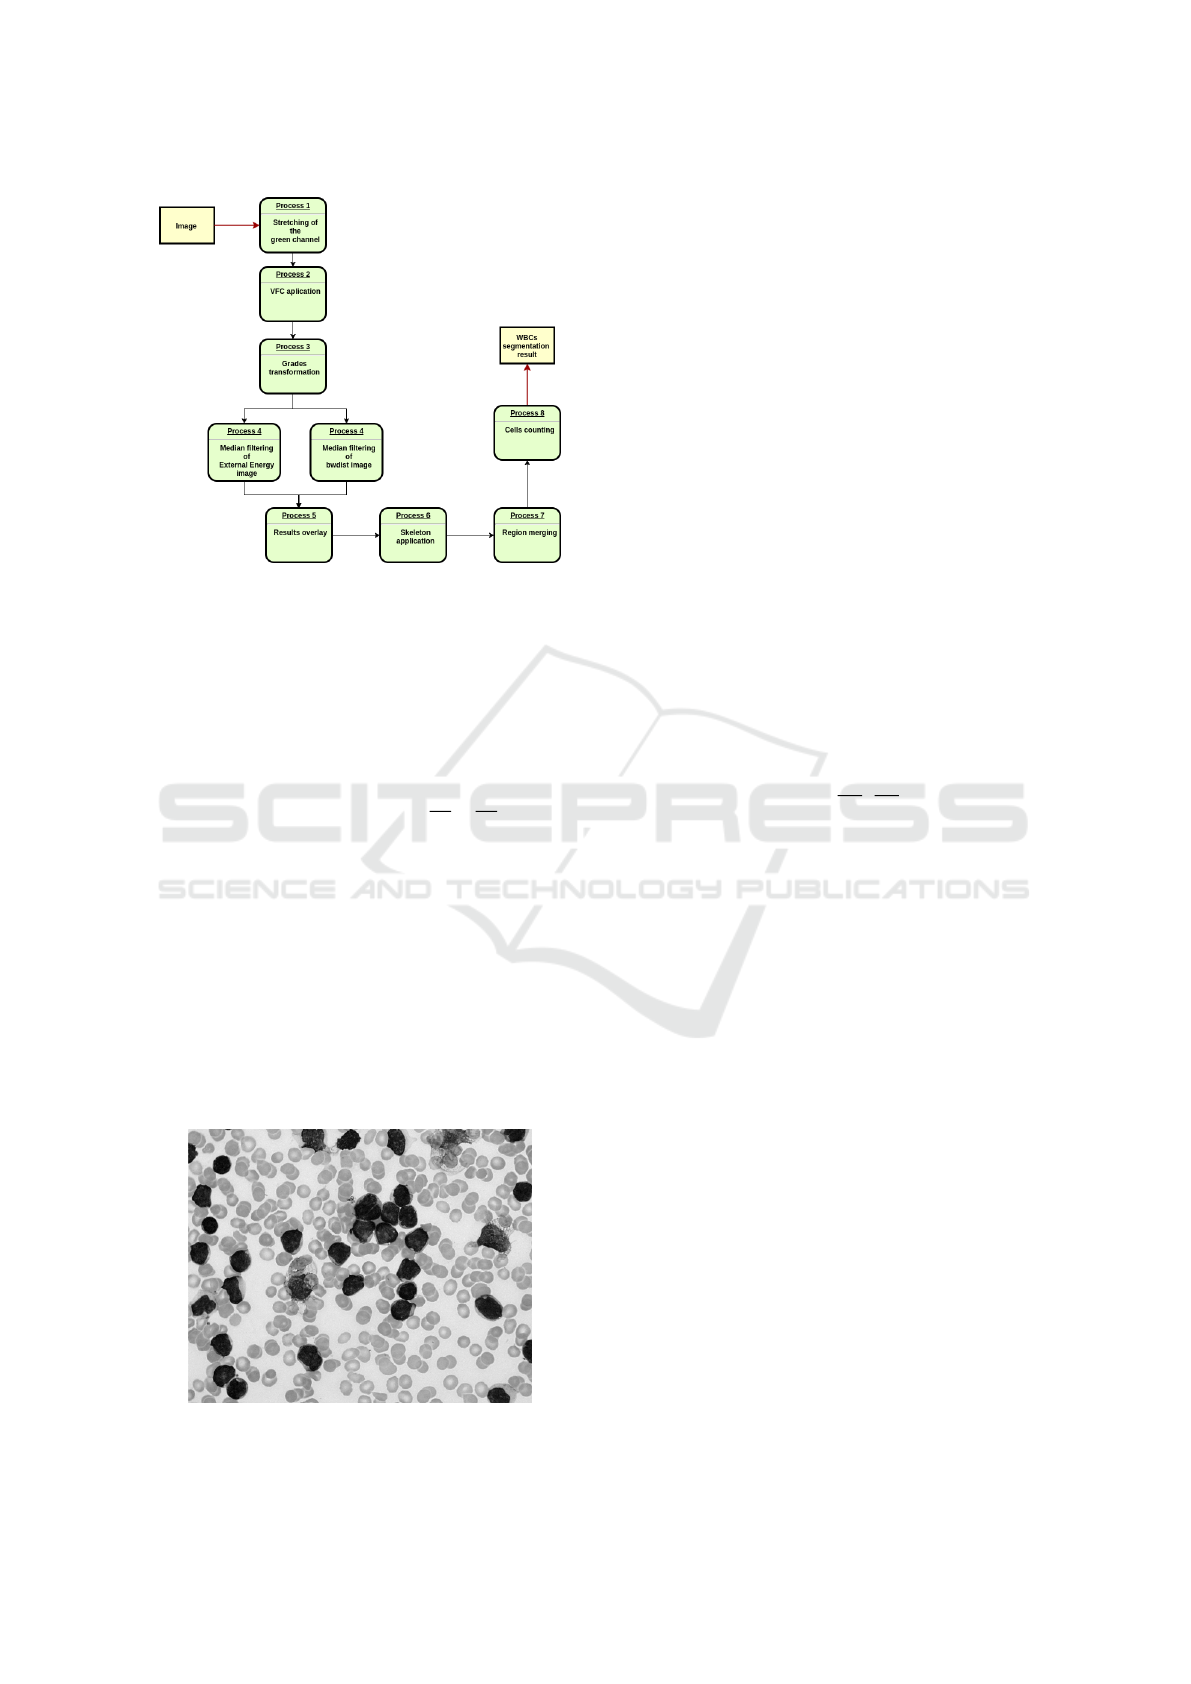
Figure 1: Diagram of WBC image recognizer.
operator and it has the advantage to produce a smoo-
thing effect to the image’s random noise (Gao et al.,
2010). Gradient corresponds to first derivative, there-
fore gradient operators are derivative. For a continu-
ous function f (x, y), in the position (x, y), its gradient
can be expressed as a vector:
∇ f (x,y) =
G
x
G
y
T
=
δ f
δx
δ f
δy
(1)
This operator applies two kernels in the two prin-
cipal directions. Calling G
x
and G
y
the horizontal and
vertical derivative approximations and I the image,
the computation is described as follows:
G
x
=
+1 0 −1
+2 0 −2
+1 0 −1
× I (2)
G
y
=
+1 +2 +1
0 0 0
−1 −2 −1
× I (3)
Figure 2: RBC image’s G channel extraction. The WBCs
are highlighted with respect to the other regions.
where the × operator indicates the convolution ope-
ration.
3.2 VFC Segmentation
An external force, namely the VFC, can be obtained
by convolving a vector field with the edge map de-
rived from the image (Bing and Scott, 2007). Active
contours using the VFC external force are called VFC
snakes. Differently from the GVF (Xu and Prince,
1998) snakes, that are formulated using the stan-
dard energy minimization framework, VFC snakes
are constructed from a state of equilibrium between
the forces. Furthermore, VFC snakes have a lot of ad-
vantages, e.g., a wide capture range, they are able to
grab the concavities, they are better resistant to noise
images, they have the ability to adapt the force field
and to reduce drastically the computational cost. Be-
fore going into detail, it is useful to define the Vector
Field Kernel (VFK). It is computed using the follo-
wing equation:
k(x, y) = m(x,y)n(x,y) (4)
where n is the unit vector that points to the origin of
the kernel
n(x,y) = [
−x
r
,
−y
r
] (5)
and m is the magnitude of the vector. Potentially,
every single pixel in an image may be attracted to the
edge of its region (Bing and Scott, 2007). This fact
could be compared to the gravity effect on every sin-
gle object in Earth: it is attracted to the Earth surface.
Consequently, if we consider the origin as the point
of interest, VFK has the desirable property that a free
particle placed in the vectorial field is able to move to
a point of interest. The external force that works in
the VFC is defined in this way:
f
v f c
(x,y) = u
v f c
(x,y),v
v f c
(x,y) (6)
Since the edge map is non-negative and wider near
the edges of the image, the VFC acts more on the
edges than to homogeneous regions. Therefore, the
free particles of homogeneous regions will be attrac-
ted to the edges. If we use a complex-valued range,
the VFC acts as a filter on the edge map, which does
not depend on the origin of the kernel. The VFC field
highly depends on the magnitude of the VFK in such
a way that it is directly proportional to the VFK(x, y).
The farther is the figure of interest (FOI) (Bing and
Scott, 2007), the less powerful is the force and, the-
refore, the magnitude must be expressed as a positive
function that decreases with respect to the distance of
the origin. Two types of magnitude functions are de-
fined as follows:
White Blood Cells Counting Via Vector Field Convolution Nuclei Segmentation
229

Figure 3: VFC right and left component.
m
1
(x,y) = (r + ε)
−γ
(7)
m
2
(x,y) = exp(−r
2
ζ
2
) (8)
where γ and ζ are positive parameters to control the
decrease rate, ε is a small positive constant which pre-
vents division by zero at the origin, while m
1
(x,y) is
inspired by Newton’s universal gravitation law. Furt-
hermore, the pixels in the edge map can be considered
as objects of mass proportional to the strength of the
edges and the VFC would be the gravitational field
generated by all objects. m
2
(x,y) is a Gaussian shape
function, and ζ can be viewed as the standard devia-
tion. The influence of FOI is strongly dependent from
γ and ζ because it increases if the first one decreases or
the second one increases. In general, the influence of
FOI should be increased (or decrease) as the signal-
to-noise ratio is decreased (or increased) (Bing and
Scott, 2007).
The VFC uses the two components of the external
force u
v f c
(x,y),v
v f c
(x,y) to describe the field of the
image and its magnitude. These two components are
very useful to describe all the edges, both from single
leukocytes and from cell clumps. VFC’s right and left
components can be computed as follows:
u
v f c
= ExtF(x)/
q
ExtF(x)
2
+ ExtF(y)
2
(9)
v
v f c
= ExtF(y)/
q
ExtF(x)
2
+ ExtF(y)
2
(10)
where ExtF is the External force of the Field. u and
v are two intensity images with values range in −pi
and +pi. They need to be combined and converted in
degrees values so that the orientation of every image
pixel can be described, as shown in Fig. 3.
VFC application typically generates some arte-
facts. In order to delete them all, this method applies
the distance transform. It assigns a number that is the
distance between each pixel and the nearest non-zero
pixel of the image. As a result, the entropy of the
image is reduced as well as the noise even though it
does not distinguishes if the edge is a RBC’s edge or
Figure 4: Distance transform image.
a WBC’s edge. As a consequence, the application of
the External Energy is needed to overcome this pro-
blem.
For an image I(x,y) the general formulation of the
image Energy is:
E
image
= w
line
E
line
+ w
edge
E
edge
+ w
term
E
term
(11)
where w
line
,w
edge
,w
term
are weights of the features.
Line Functional: the line functional, also known as
the image intensity, is the attracted value of the dark
lines to the light lines. It is possible to choose this
value by selecting a positive or negative value of the
force
E
line
= f ilter(I(x,y)) (12)
Edge Functional: The edge functional bases its work
on the image gradient.
E
edge
= −
|
∇I(x,y)
|
2
(13)
This formula defines the strategy by which the met-
hod gets rid of the local minima that are not object
of interest. The energy functional using scale space
continuation is
E
edge
= −
G
σ
× ∇
2
I
2
(14)
where G
σ
is a Gaussian with standard deviation σ.
Termination Functional: The lines curvature in an
image is used to detect corners and terminations. Put
C(x, y) = G
σ
× I(x,y) (15)
we derive a gradient angle
θ = arctan
C
y
C
x
!
, (16)
the unit vectors that move along the gradient direction
n = (cos θ,sin θ), (17)
and the unit vectors perpendicular to the gradient di-
rection.
n
⊥
= (−sin θ,cos θ). (18)
VISAPP 2018 - International Conference on Computer Vision Theory and Applications
230
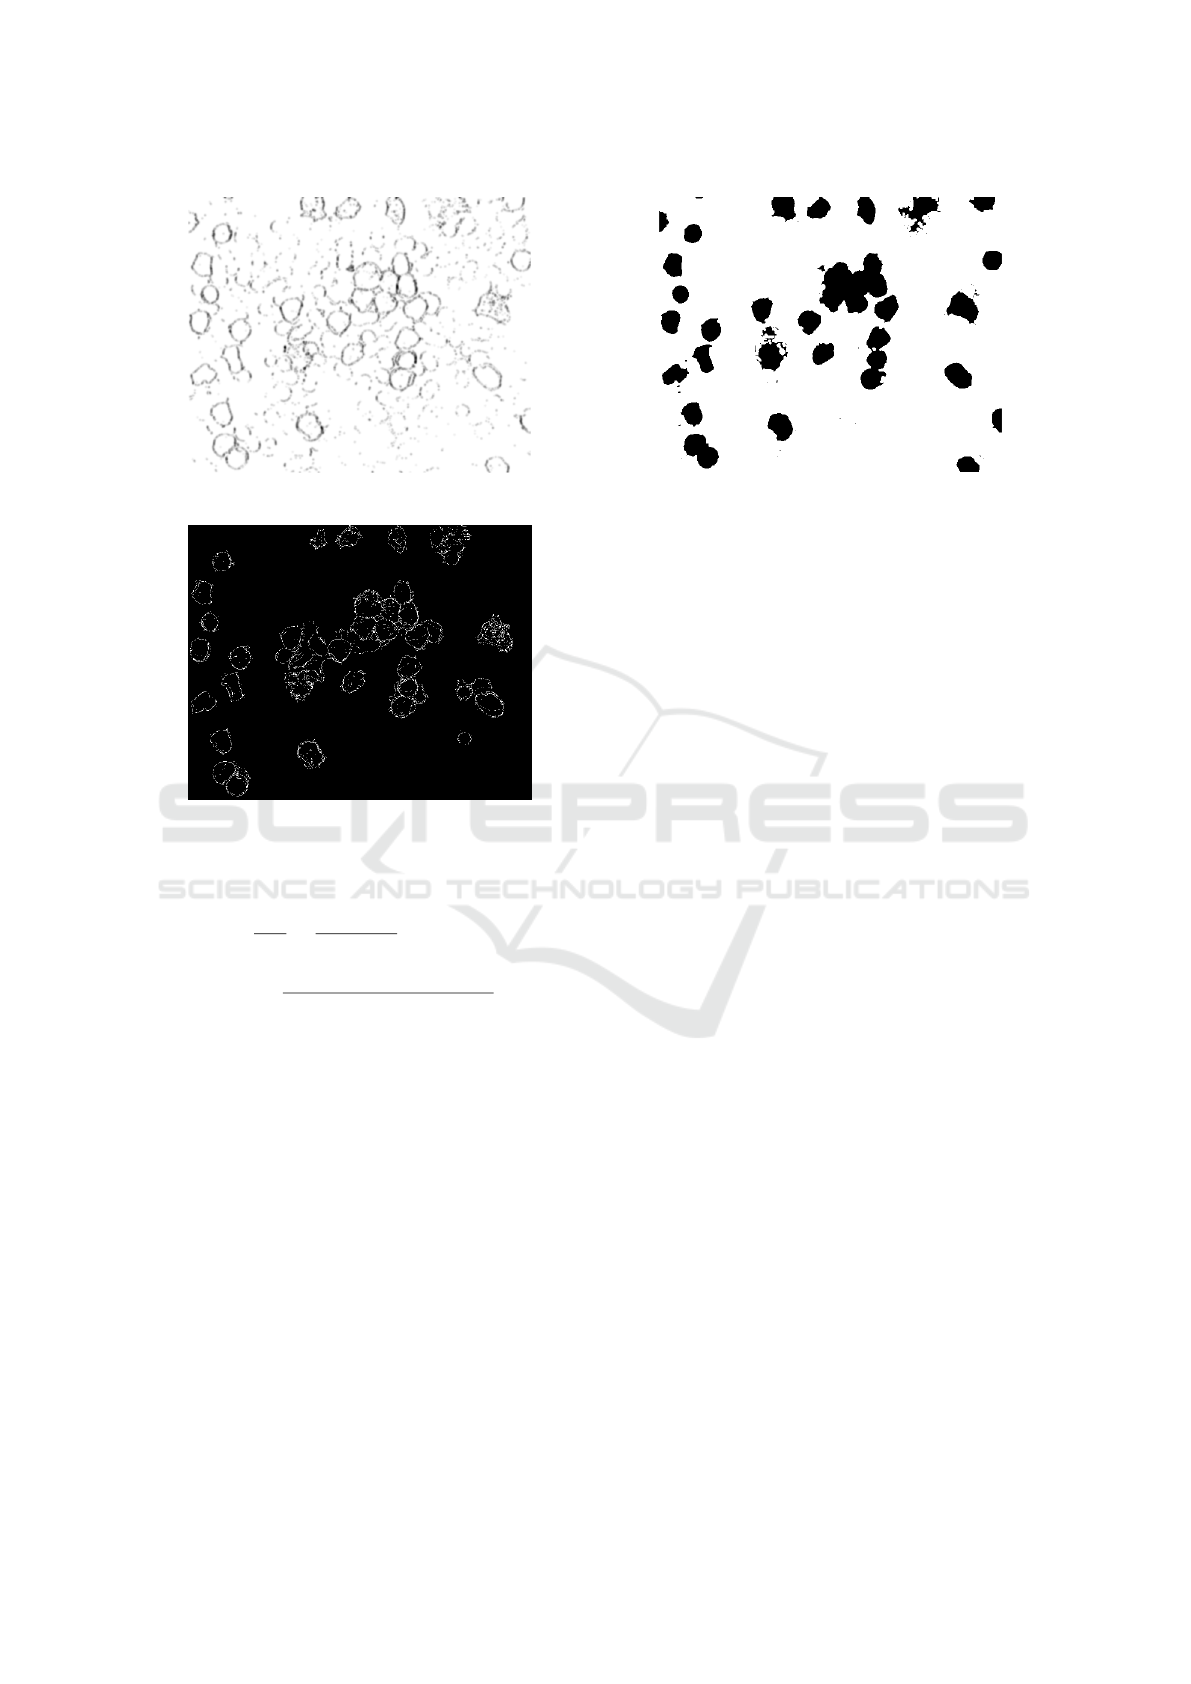
Figure 5: External energy image.
Figure 6: Overlay image.
Having defined the previous four formulas, the termi-
nation functional of energy can be defined as follows:
E
term
=
∂θ
∂n
⊥
=
∂
2
C/∂
2
n
⊥
∂C/∂n
=
⇒
C
yy
C
2
x
− 2C
xy
C
x
C
y
+C
xx
C
2
y
(C
2
x
+C
2
y
)
3/2
(19)
External Energy Result: As stated before, a median
filter has been employed in order to delete all the uni-
form part of the figure and to highlight the edges. It
searches the 13
th
element of the 5 × 5 mask (Figure
5).
Once the median filter has been applied over the
degrees image we apply and AND operation between
it and the edges regions image so that we can highlight
the points which result to be in overlay (Figure 6).
3.3 Post-processing
The image obtained from the previous steps present
only the WBCs edges that, in some regions of the
image, are far from being a connected boundary.
Thus, a further step is needed to link the edges pre-
serving the original boundary of the objects. Actu-
ally, this phase includes different steps. The first one
Figure 7: Opened image.
consists in connecting every single white point to the
nearest in order to produce a connected objects boun-
dary. A dilation with a 6 pixels size diamond structu-
ral element is applied in order to dilate all white dots.
Secondly, the opening of the closing is applied with
a 4 and 3 pixels size disks, respectively. Then, the
skeleton function is performed. It produces an image
that contains some spurious branches which are re-
dundant for our purposes and, consequently, we reali-
zed the following strategy in order to get rid of them.
To solve this problem we used a path analyser that
checks for the presence of open paths. Indeed, a con-
nected border is a closed path in which a pixel of that
border is at the same time a starting and ending point.
So, each pixel that does not belong to a closed path is
removed. At this moment, every pure edge belonging
to the cells is available but over-segmentation could
occur so that we need to perform an arithmetical ope-
ration which fills all the WBCs edges and removes the
others. This operation uses a mask obtained from the
external force image. Finally, the application of an
opening on the edge map with a 6 pixels radius disk
structural element and its addition to WBCs image
in foreground, all connected components, fitting into
a specific area range, are successfully extracted, as
shown in fig. 7. It is the first WBC segmented image
obtained with the proposed method. It needs some
improvements, following defined.
Once the cleaned binary mask has been obtained,
we should be able to perform the count of the cells
inside the image. Unfortunately, as it can be obser-
ved in Figure 8, using the proposed method also some
WBCs have been separated in two or more regions,
hampering a correct cell counting.
Thus, it is necessary a further step that merges all
the image regions that belongs to the same cells. In
order to understand which are the regions that should
be part of a single cell we performed a check based
on the area value. All the regions that have an area
smaller than the half of the biggest region inside the
White Blood Cells Counting Via Vector Field Convolution Nuclei Segmentation
231
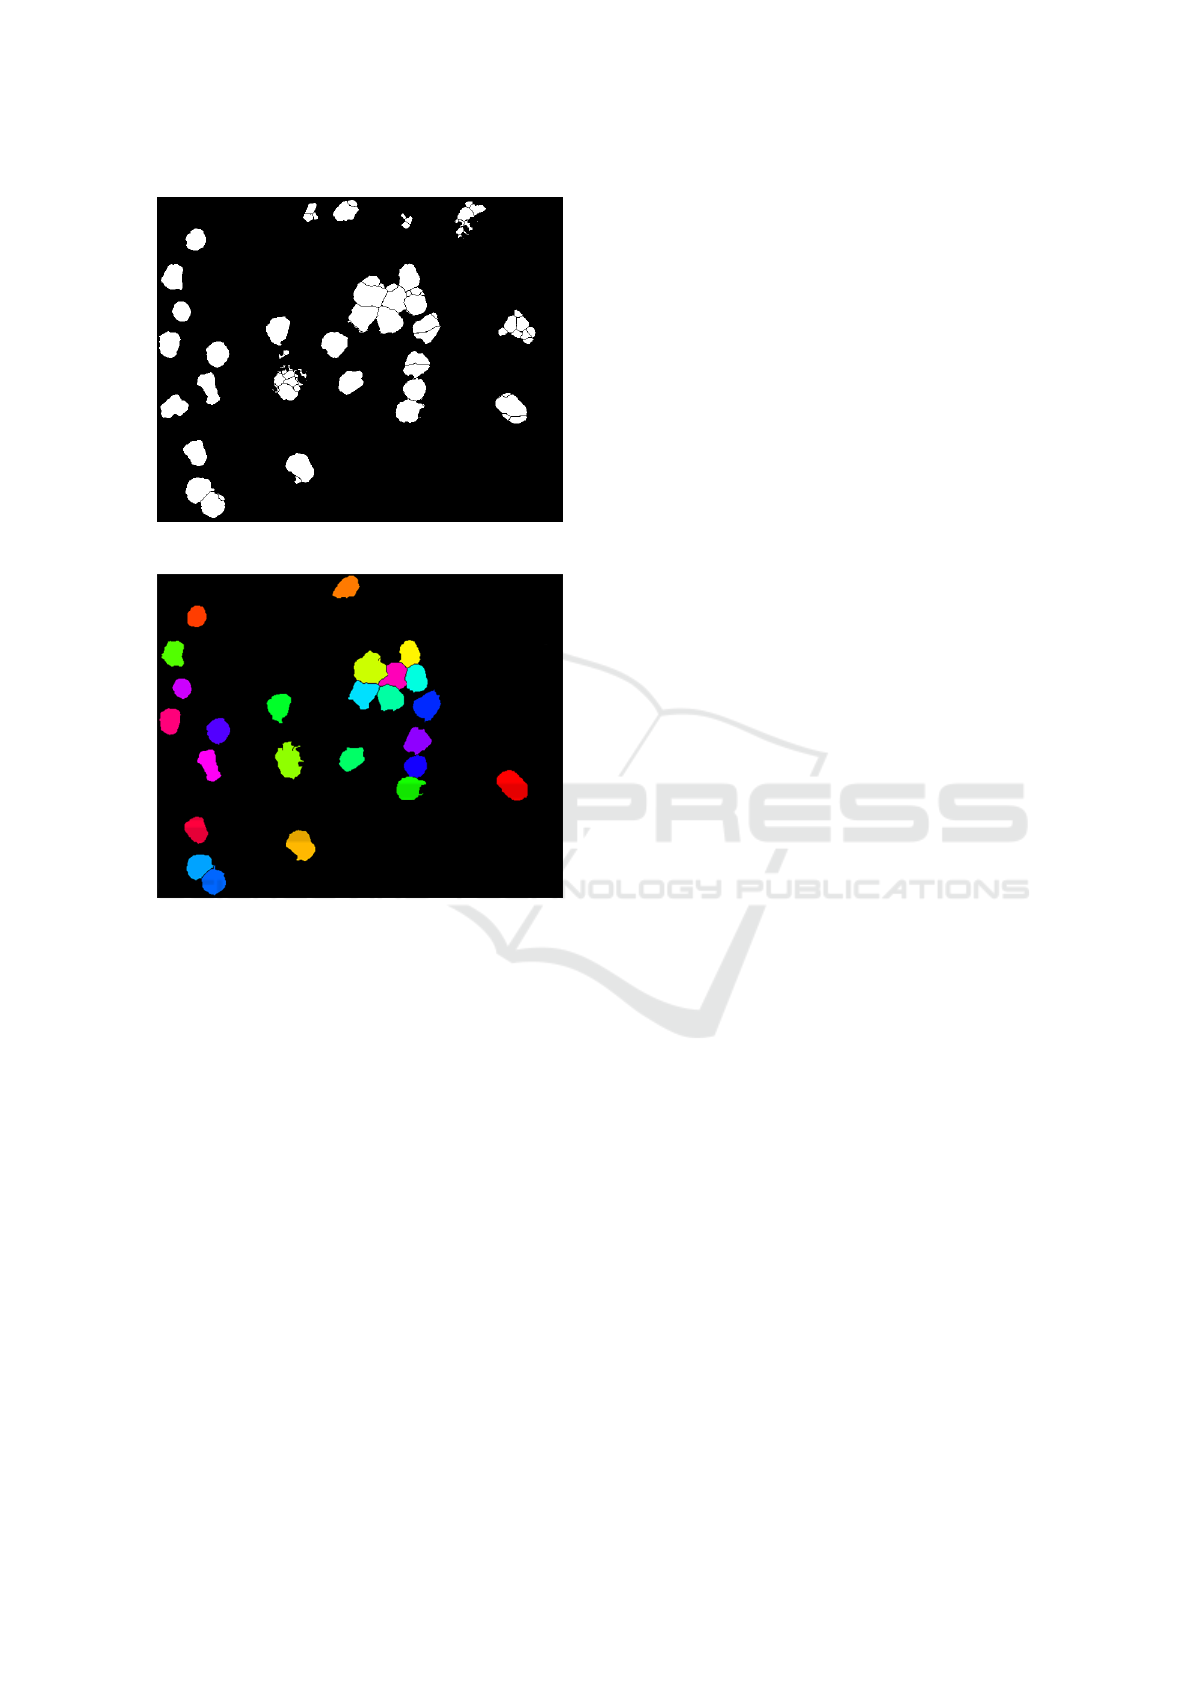
Figure 8: Oversegmented image.
Figure 9: Final result.
image are considered part of a single cell, while the
other regions are considered complete cells. Keeping
in mind that smaller area regions belong to larger area
regions, we need to identify which of the first ones
belongs to the latter. The threshold area used to cre-
ate these two different images is exactly half of the
image’s biggest region area. Labelling each area and
computing all the centroids, we can know which areas
need to be joined together, using the Euclidean dis-
tance formula. Finally, it is possible to isolate the two
areas and merge them using a closing procedure with
a 7 pixels radius disk element. The final result is gi-
ven by an overlay of this step to the over-segmented
image by means of the union operator (figure 9).
4 DATASETS AND
EXPERIMENTAL RESULTS
This section present the experimental result of the
proposed white blood cells nuclei segmentation
technique. The system has been tested on three diffe-
rent dataset, that is ALL-IDB, IUMS-IDB and SMC-
IDB. First one is composed of images captured with
an optical laboratory microscope coupled with a Ca-
non PowerShot G5 camera. All the images are in
JPG format with 24-bit colour depth. The first 33
have 1712 × 1368 resolution, while the remaining
have 2592 × 1944 resolution. The images are taken
with different magnifications of the microscope ran-
ging from 300 to 500 which brings the colour dif-
ferences that we managed grouping the images with
same brightness characteristics together. It is com-
posed of two versions: ALL-IDB1 and ALL-IDB2.
ALL-IDB1 can be used for testing the segmentation
capability of the algorithms. This dataset is compo-
sed of 108 images collected during September, 2005.
It contains about 39000 blood elements, where the
lymphocytes have been labelled by expert oncologists
(Unimi, 2005). ALL-IDB2 has been designed for tes-
ting the performances of classification systems. The
ALL-IDB2 version is a collection of cropped area of
interest of healthy and blast cells that belong to the
ALL-IDB1 dataset. They have similar grey level pro-
perties to ALL-IDB1 images, except from their di-
mensions (Unimi, 2005). In order to understand if the
algorithm can obtain the best result with every kind of
luminance or noise, it has been tested over two more
datasets. IUMS-IDB is provided by Iran University of
Medical Science (Sarrafzadeh et al., 2014) and con-
tains 100 microscopic images of size 732 ×572, taken
from peripheral blood of 8 healthy subjects. They are
really different from those of ALL-IDB, since the mi-
croscope slides have been smeared and stained with a
different staining technique. The third dataset, pro-
posed in (Mohamed et al., 2012), has been acquired
from slides stained with the same staining technique
as ALL-IDB, even though the images are really dif-
ferent, since they have been acquired with a different
combination of microscope and camera. It has a total
of 367 peripheral blood images of size 640 × 480.
A visual result for each dataset is reported in fig.
10. A quantitative experimentation has been con-
ducted by considering every single image for a WBCs
analysis and relative count. Three metrics have been
adopted to evaluate our study: False Negative Rate
(FNR), Precision and Recall. The obtained results are
reported in table 1. It is evident that our approach cor-
rectly identifies 100% of the leukocytes inside ALL-
IDB, IUMS-IDB and SMC-IDB datasets. The ma-
jority of clumped cells has been found in ALL-IDB,
which presents a lot of complex images, with lots
of leukocytes per image and different agglomerates,
while IUMS-IDB and SMC-IDB contain simpler ima-
ges composed of fewer leukocytes and only few, sim-
VISAPP 2018 - International Conference on Computer Vision Theory and Applications
232
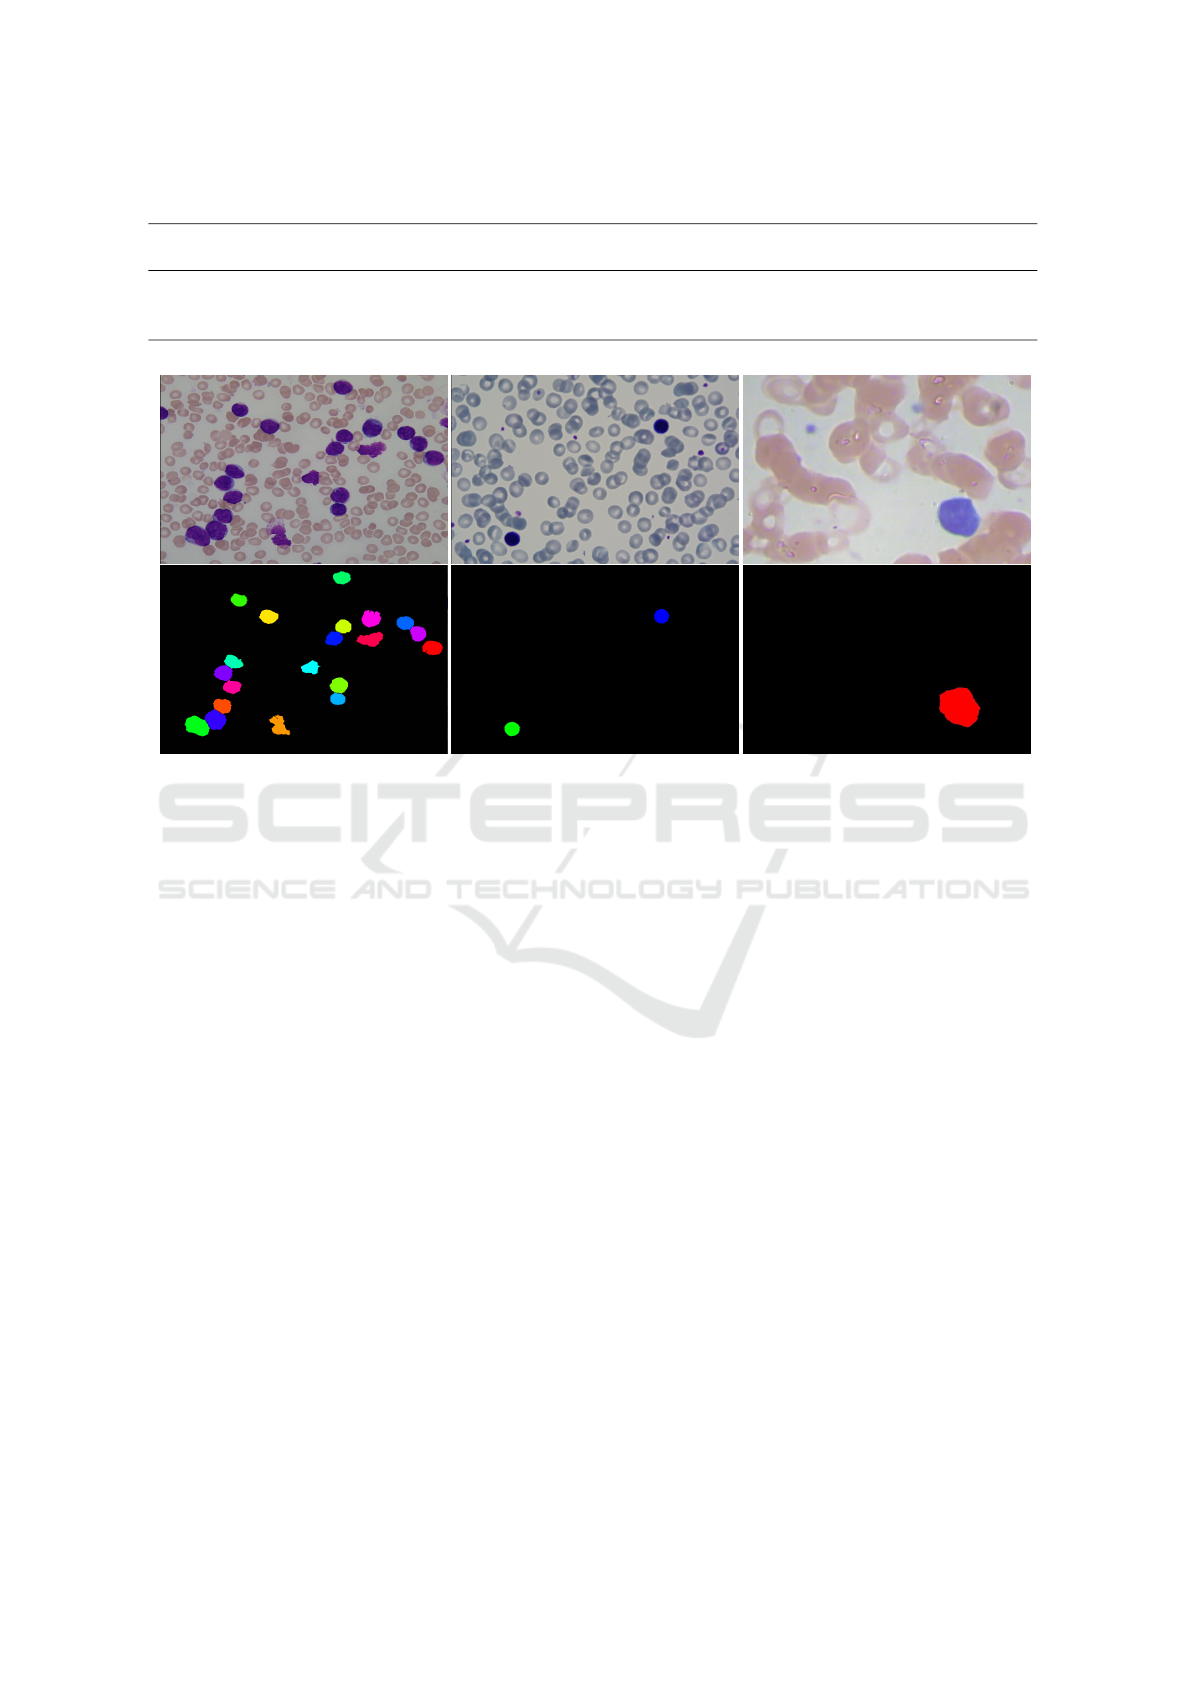
Table 1: Detection performances compared with the state-of-the-art.
Mahmood, 2013 Alilou, 2013 Putzu, 2014 Alomari, 2014 Di Ruberto, 2016 Our Approach
ALL ALL ALL ALL ALL IUMS SMC ALL IUMS SMC
FNR - - - 1.5% 0.7% 0% 0% 0% 0% 0%
Precision - - - 90% 100% 100% 100% 100% 100% 100%
Recall 81% 88% 92% 98% 99.2% 100% 100% 100% 100% 100%
Figure 10: Top: from left to right, images extracted from ALL-IDB, IUSMS-IDB and SMC-IDDB, respectively. Bottom:
from left to right, the final segmentation results for each image on top.
pler, agglomerates. They also have a poorer quality
than the ALL-IDB images. The proposed approach
produces no false positives, being able to exclude all
other image regions before the detection phase, and
thus considering only the portions of image contai-
ning leukocytes. Some other state of the art methods
used the aforementioned datasets for their segmenta-
tion clumped cells separation experiments, e.g. (Lata
et al., 2016) and (Di Ruberto et al., 2015) use ALL-
IDB. The first authors perform a WBCs count by
counting the number of connected components even
though it is not present a method to divide the clum-
ped cells, while the second ones perform a separation
of clumped and overlapped cells although they state
some errors in the procedure. Our proposed approach
outperforms both.
5 CONCLUSIONS
A new semi-automated WBCs recognition system has
been investigated and proposed in this work. It can
be used to support some existing medical methods,
like the white blood cells counting. Its novelty in the
state of the art is related to the clumped cells sepa-
ration strategy, realised using a Vector Field Convo-
lution model. It works by following only their na-
tural shape even if they are hard to distinguish. Its
strength lies in the invariance to cells shapes and, by
using the gradients movement, it can find the edge
shape even if this is not immediately visible. Moreo-
ver, the proposed algorithm is not tuned to a specific
training set and it could be used for whichever pe-
ripheral blood images dataset. Experimental results
demonstrate that this new approach is very accurate
and robust for detection, if compared to some tra-
ditional methods, being able to obtain excellent re-
sults with the three public tested datasets, even though
some improvements could be implemented. Firstly,
the post-processing phase could be afforded with an
edge-linking algorithm referred the same region ed-
ges, in order to reduce the computational cost of this
step. Secondly, the pre-processing step could be im-
proved so as to consider both WBCs nuclei and cyto-
plasm.
REFERENCES
Alilou, M. and Kovalev, V. (2013). Automatic object de-
tection and segmentation of the histocytology images
using reshapable agents. Image Analysis and Stereo-
logy, 32(2):89–99.
Alomari, Y. M., Huda, S. A. S. N., Raja, Z. A., and Khairud-
White Blood Cells Counting Via Vector Field Convolution Nuclei Segmentation
233

din, O. (2014). Automatic detection and quantification
of wbcs and rbcs using iterative structured circle de-
tection algorithm. Computational and mathematical
methods in medicine, 2014.
Bing, L. and Scott, T. (2007). Active contour external force
using vector field convolution for image segmentation.
Acton, vol. 16, pp. 2096 - 2106.
Di Ruberto, C., Loddo, A., and Putzu, L. (2015). a multiple
classifier learning by sampling system for white blood
cells segmentation. proceedings in CAIP, vol. 9257,
pp. 415 - 425.
Di Ruberto, C., Loddo, A., and Putzu, L. (2016). A leucocy-
tes count system from blood smear images. Machine
Vision and Applications, vol. 27, pp. 1151 - 1160.
Gao, W., Yang, L., Zhang, X., and Liu, H. (2010). An
improved sobel edge detection. 2010 3rd Internatio-
nal Conference on Computer Science and Information
Technology, pp. 67 - 71.
Ghane, N., Vard, A., Talebi, A., and Nematollahy, P. (2017).
Segmentation of white blood cells from microscopic
images using a novel combination of k-means cluste-
ring and modified watershed algorithm. ournal of Me-
dical Signals and Sensors. vol. 7, no. 2, pp. 92-101.
Halim, N. H. A., Mashor, M. Y., and Hassan, R. (2011).
Automatic blasts counting for acute leukemia based
on blood samples. International Journal of Research
and Reviews in Computer Science, vol. 2, no. 4.
Kovalev, V. A., Y.Grigoriev, A., and H.Ahn (1996). Robust
recognition of white blood cell images. IEEE Publis-
her, pp. 371-375.
Lata, A., Udesang, K. B., and Joshi, J. J. M. (2016). seg-
mentation and counting of wbcs and rbcs from mi-
croscopic blood sample images. proceedings in MECS
(http://www.mecs-press.org/), vol. 11, pp. 32 - 40.
Loddo, A., Putzu, L., Ruberto, C. D., and Fenu, G. (2016).
A computer-aided system for differential count from
peripheral blood cell images. In 2016 12th Internatio-
nal Conference on Signal-Image Technology Internet-
Based Systems (SITIS), pages 112–118.
Madhloom, H. T., Kareem, S. A., Ariffin, H., Zaidan, A. A.,
Alanazi, H. O., and Zaidan, B. B. (2010). An automa-
ted white blood cell nucleus localization and segmen-
tation using image arithmetic and automated thres-
hold. Journal of Applied Sciences, vol. 10, no. 11,
pp. 959-966.
Mahmood, N. H., Lim, P. C., Mazalan, S. M., and Razak,
M. A. A. (2013). Blood cells extraction using color
based segmentation technique. International Journal
of Life Sciences Biotechnology and Pharma Research,
2(2).
Mohamed, M., Far, B., and Guaily, A. (2012). An effi-
cient technique for white blood cells nuclei automatic
segmentation. IEEE International Conference on Sy-
stems, Man, and Cybernetics (SMC), pp. 220225.
Mohapatra, S., Patra, D., and Satpathy, S. (2013). An en-
semble classifier system for early diagnosis of acute
lymphoblastic leukemia in blood microscopic images.
Journal of Neural Computing and Applications, Arti-
cle in Press,.
Putzu, L., Caocci, G., and Di Ruberto, C. (2014). Leu-
cocyte classification for leukaemia detection using
image processing techniques. Artificial Intelligence
in Medicine, vol. 62 , pp. 179 - 191.
Sarrafzadeh, O., Rabbani, H., Talebi, A., and Banaem, H.
(2014). Selection of the best features for leukocy-
tes classification in blood smear microscopic images.
SPIE Medical Imaging, pp. 90410P 90410P.
Scotti, F. (2006). Robust segmentation and measurements
techniques of white cells in blood microscope images.
IEEE Publisher, pp. 43-48.
Scotti, F. and Piuri, V. (2004). Morphological classifica-
tion of blood leucocytes by microscope images. IEEE
Publisher pp. 103-108.
Sinha, N. and Ramakrishnan, A. G. (2003). Automation of
differential blood count. in proceedings of the confe-
rence on convergent technologies for the asia-pacific
region. IEEE Publisher, vol. 2, pp. 547-551, Taj Resi-
dency, Bangalore.
Unimi (2005). All-idb acute lymphoblastic leukemia image
database for image processing.
Xu, C. and Prince, J. L. (1998). Generalized gradient vector
flow external forces for active contours. Signal Pro-
cess., vol. 71, pp. 131 - 139.
VISAPP 2018 - International Conference on Computer Vision Theory and Applications
234
