Laser Spectroscopy for Trace Matter Detection in Air
T. Stacewicz
1
, Z. Bielecki
2
, J. Wojtas
2
, P. Magryta
1
and M. Winkowski
1
1
Institute of Experimental Physics, Faculty of Physics, University of Warsaw, Pasteura 5, 02-093 Warsaw, Poland
2
Institute of Optoelectronics, Military University of Technology, Gen. Sylwestra Kaliskiego 2, 00-908 Warsaw, Poland
Keywords: Laser Spectroscopy, Trace Matter Detection.
Abstract: The article describes implementation of absorption spectroscopy methods for construction of trace
compounds sensors in air. Multipass spectroscopy with laser wavelength modulation as well as cavity ring
down spectroscopy was applied. High detection limits and good selectivity sensors of nitrogen oxide,
dioxide, carbonyl sulphide, ethane, ammonia, methane, carbon oxide, acetone and water vapour were
elaborated. The sensors were used in experiments about security and environmental monitoring, human
breath analysis as well as for the geophysical research.
1 INTRODUCTION
Highly sensitive and quick response measurements
of trace compounds in gases are of large importance
for various fields, from the industrial ones, to
agriculture, environmental monitoring, medical
applications and different scientific research. There
is a variety of gas sensing techniques that are useful
for this purpose. Nevertheless, there is still a need to
look for a low-cost, sensitive and an accurate
technique which leads to use of small, affordable,
easy-to-use equipment. Application of optical
methods e.g. laser absorption spectroscopy provides
opportunity for fast, selective and sensitive detection
of certain gaseous compounds. Progress in
optoelectronic technologies opens new capabilities
of trace matter detection in gases. In this paper we
present our achievements about application of laser
absorption spectroscopy for trace gases detection in
air for medical, environmental and atmospheric
physics applications.
2 EXPERIMENTAL
Sensitive detection of trace compounds in gaseous
matter requires ultrasensitive approaches. One of
them is the multipass spectroscopy (MUPASS)
applied together with wavelength modulation
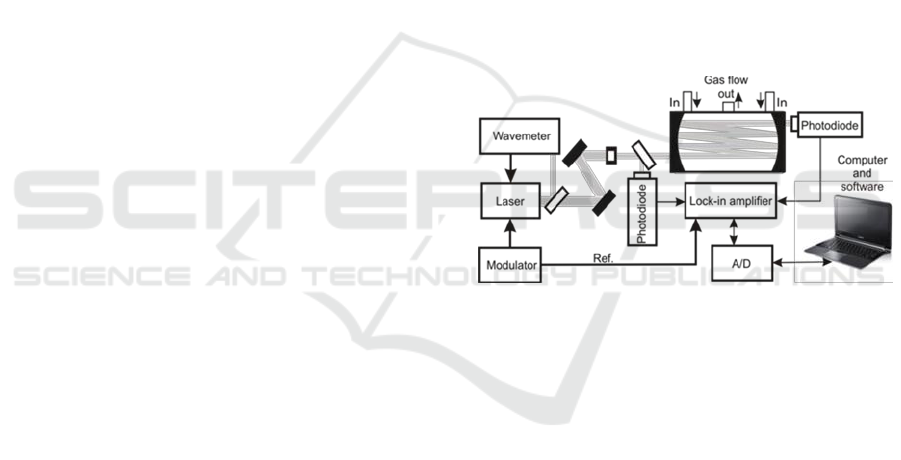
spectroscopy (WMS). The scheme of our
experimental setup exploiting this method is
presented in Figure 1. Its operation idea was
Figure 1: MUPASS with WMS setup.
described in details in the publications (Wojtas,
2012, Stacewicz, 2012).
In this approach we use semiconductor laser
which is precisely tuned to characteristic strong
absorption line of the investigated compound. The
beam is sent to multipass cell filed with the air
sample. Due to multiple reflection the effective light
path in the sample reaches tens of meters. Laser
wavelength is also swiped across the absorption line
by a modulator. That causes AM modulation of the
output beam. AM signal from the photodiode is
demodulated with lock-in amplifier driven by the
reference signal from the modulator.
Cavity ring down spectroscopy system (CRDS -
Figure 2) exploits the experimental cell in the form
of optical resonator (cavity) built with mirrors of
very high reflectivity (O’Keefe, 1988, Berden,
2009). The measurement of absorption coefficient of
the sample contained inside consists in the resonator
testing using pulsed of AM-modulated laser
radiation.
Stacewicz, T., Bielecki, Z., Wojtas, J., Magryta, P. and Winkowski, M.
Laser Spectroscopy for Trace Matter Detection in Air.
DOI: 10.5220/0006718002970302
In Proceedings of the 6th International Conference on Photonics, Optics and Laser Technology (PHOTOPTICS 2018), pages 297-302
ISBN: 978-989-758-286-8
Copyright © 2018 by SCITEPRESS – Science and Technology Publications, Lda. All rights reserved
297
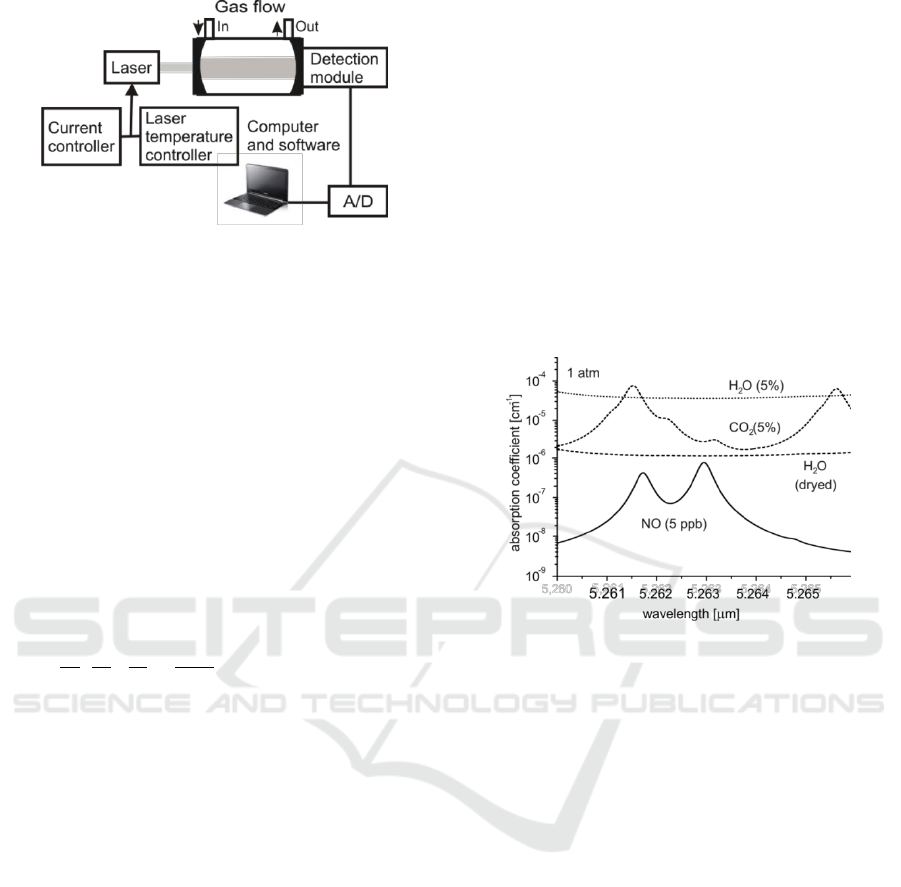
Figure 2: Simplified CRDS setup.
Photon lifetime in the cavity (τ
A
) or the phase
shift (φ
nA
)
between the relevant harmonics of input
and output signals is determined in this way
(Romanini, 1997, Ye, 1997). Such phase shift φ
nA
occurs due to energy storage in the resonator. For
n-th harmonic it fulfils the relation:
AnA
nftg
2
(1)
where f denotes the modulation frequency. Then the
cavity parameters (τ
0
and φ
n0
) are determined for the
case when the resonator is filled with a reference gas
(without the absorber). The absorber concentration is
calculated using the formulas:
0
0
2111
nnA
A
ctgctg
c
nf
c
N
(2)
where c denotes the light speed and σ is the
absorption cross section.
In our system (Figure 2) the output signal from
the cavity was registered by a detection module and
analysed with A/D converter and PC. Special
software allowed either the lifetimes determination
(τ
A
and
τ
0
) or the lock-in signal processing (φ
nA
and
φ
n0
measurement). The absorption coefficients below
10
-9
cm
-1
were observed.
Such simple CRDS setup with blue- violet diode
laser allows monitoring of nitrogen dioxide in
atmosphere (Holc 2010). The detection limit below
1ppb was achieved. We used it for environmental
investigation and for explosive material detection
(Bielecki, 2012).
Detection of NO
2
does not require any special
spectrum analysis due to broad absorption band of
this molecule. Moreover, in atmosphere usually
there is no any other compound that could interfere
the NO
2
results in blue – violet range.
The situation is different in the case of infrared
measurements. Especially the optical analysis of
human breath in this range requires careful spectrum
investigation since more than 3000 compounds were
already recognized in the air exhaled from the lungs.
An excess of several compounds (called biomarkers)
is related to certain diseases.
Breath analysis methods have been intensively
developed recently. This activity is motivated by the
great potential of the disease diagnosis at early state
or therapy monitoring. Such medical investigation is
simple, painless, no-stressful and non-invasive
(Buszewski, 2013). It makes these methods useful
for screening. Application of the optical methods
provides opportunity for fast and sensitive detection
of certain compounds in breath. Continuous progress
in optoelectronics leads to construction of desktop
systems.
Figure 3: Absorption spectra of NO and its main
interferents in breath at normal pressure.
The large number of compounds in breath causes
that their absorption spectra might overlap a
fingerprint of a certain biomarker and disturbs the
measurement. Therefore the art of wavelength and
circumstances selection for the optical detection
consists in interference minimization. In Figure 3 an
example for nitrogen oxide is presented (Rothman et
al 2013). The spectra of main air constituents (N
2
and O
2
) usually do not interfere, but the carbon
oxide absorption lines are screened by CO
2
and H
2
O
(up to ~5% both in a breath), which are
characterized by broad absorption bands. The
situation cannot be improved by drying of the
sample with special absorbers reducing the
humidity. However the diminishing of the sample
pressure to about 0.1 atm (Figure 4) is an approach
that can efficiently reduce such disturbance. Due to
that the pressure broadening is reduced about 10
times, but the absorption coefficient at the line peak
is preserved. Therefore the backgrounds of H
2
O and
CO
2
are lowered about two orders of magnitude.
Additional dehumidification of the sample leads to
further reduction of H
2
O interference.
PHOTOPTICS 2018 - 6th International Conference on Photonics, Optics and Laser Technology
298
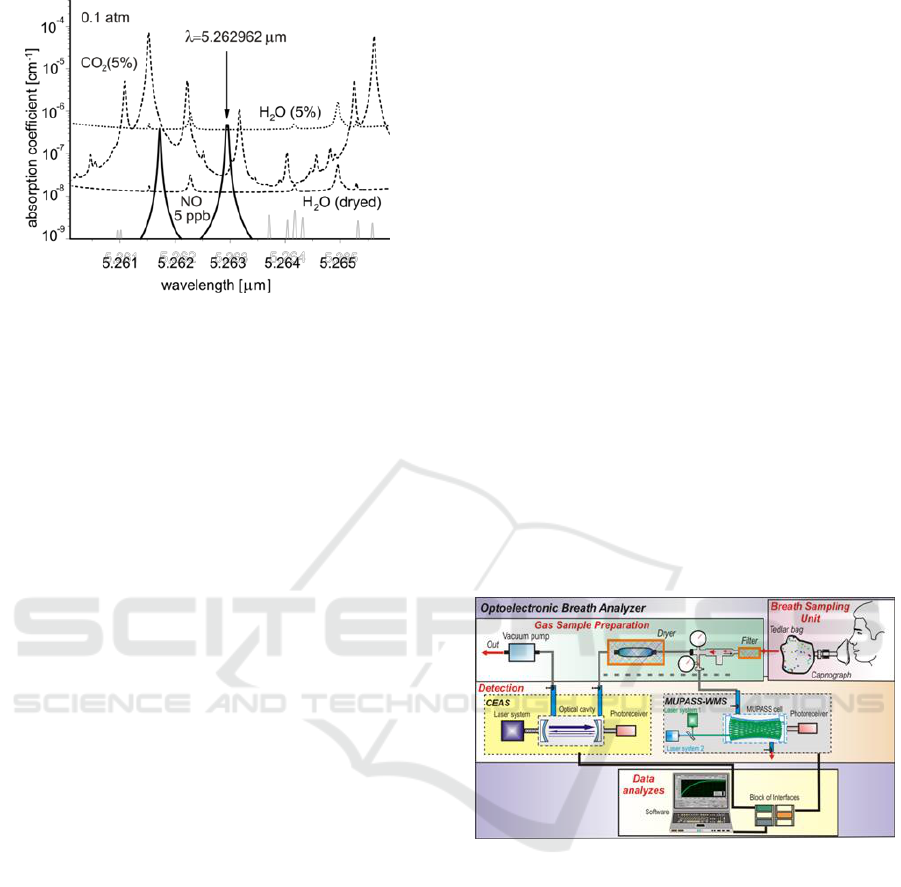
Figure 4: Absorption spectra of NO and main interferents
at pressure of 0.1 atm.
In other cases the interferents, which might reach
relatively high concentrations in breath, should also
be taken into account. Carbon oxide, methane,
ammonia and formaldehyde are worth to mention.
Sensitive and selective measurement of nitrogen
oxide concentration requires using a single mode
laser tuned to the peak of selected absorption line
(5.262962 µm). In order to achieve precision better
than 3% the wavelength stability should be about
10
-6
µm. In our experiments single-mode quantum
cascade laser developed by Alpes Lasers SA or the
diode lasers from Toptica was used.
In such circumstances, NO concentration of 5
ppb might be detected The integration time was
about 1 min. Subsequent reduction of H
2
O
concentration (usually by a factor of 30) using
Nafion membrane dehumidifier (Perma Pure
Product, http) provides the opportunity to measure
nitrogen oxide concentration with precision of 0.2
ppb, i.e. to monitor this compound in breath of
healthy man.
3 RESULTS
Using the methods described above the sensors of
several biomarkers were elaborated. The
compounds, which were in scope of our interest, are
the biomarkers of various important diseases.
Application of special conditions, i.e. the
dehumidification and the pressure reduction to 0.1
atm, was necessary only for NO (5.262962 µm) and
C
2
H
6
(3.3481590 µm). The detection of other
compounds i.e. NO
2
(0.41 µm), OCS (4.8777716
µm), NH
3
(1.5270409 µm), CH
4
(2.2536598 µm),
CO (2.3337197 µm) and acetone (0,266 µm) was
performed at normal pressures. For the biomarkers
characterized by the high morbid level (i.e. relatively
high absorption coefficient – ammonia. methane and
carbon oxide) the use of MUPASS/WMS techniques
was sufficient. Other compounds were detected with
CRDS approach.
For majority of the cases the detection limit of
the sensors was much better than the morbid level.
That allows looking with optimism for future
opportunity of the optical breath analysis application
in medicine. Continuous progress in optoelectronics
would lead to construction of cheap, easy to
maintain desktop systems useful for screening.
Only for acetone the detection was not successful
in spite of the application of the most sensitive
approach (CRDS). Poor reflection coefficient of the
mirrors that are available at 0.266 µm is the main
problem here.
4 BREATH ANALYSER
Basing on the achievements about trace gas
detection a breath analyser was constructed. Its
scheme is presented in Figure 5. The analyser
consists of sampling unit and gas sample preparation
unit, the detection unit and data analysers.
Figure 5: Scheme of the gas analyser.
Proper breath analysis requires that the exhaled
air sample is prepared with the air following from
the alveoli. The remaining air originating from upper
respiratory tract does not undergo the gas exchange
and can be a source of interferences during the
biomarker testing. The separation of a gas sample
for the biomarker investigation is possible by a
monitoring of carbon dioxide contains in the exhaled
air, since the air from lower respiratory ways is
characterized by high CO
2
concentration.
The sampling unit consists of face mask which
allows patient to breath with artificial air from a
container (Szabra, 2017). The system of the carbon
dioxide recording (capnograph) determines the
proper breath phase and selects the air sample using
Laser Spectroscopy for Trace Matter Detection in Air
299
microprocessor controlled valves. The sample is
directed either to optical detection system (when the
on-line biomarker detection takes place) or to tedlar
bags. In this case the sample is stored in the bag and
then transported to the sample preparation and the
optical detection unit (off-line).
The air sample (either from the face mask or
from the tedlar bag) is directed to the sample
preparation unit. Here it might be dehumidified with
Nafion membranes and prepared under reduced
pressure (if necessary) before sending to the optical
detection unit. Finally the result of measurement is
elaborated by data analyzer.
Proper operating of the breath analyzer was
check during the medical investigation (Szabra,
2017). For example the patients with chronic
obstructive airway disease were examined. The
samples of their breath were collected in off-line
way about 2 hours before the optical treating. A
huge exceed of NO concentration above the morbid
level was stated in each case.
5 H
2
O SENSORS
Optical detection is also suitable for sensitive
humidity monitoring. Such measurements are widely
used in various fields, from the technological ones to
geophysical research. Water vapour is the most
important greenhouse gas in atmosphere that absorbs
the energy irradiated from the Earth surface. It is
involved in climate feedback loop that includes
complicated interactions between water vapour,
clouds, atmospheric circulations, convection and
radiation.
Water is a substance poorly mixed in the
atmosphere. Quantity of H
2
O molecules exceeds the
value of about 10
17
cm
-3
at low altitudes, but it
decreases below 10
12
cm
-3
at the altitude of 40 km
(Figure 6). However local H
2
O concentration in air
might change even by the orders of magnitude in
neighbouring regions on scales of hundred meters or
less, e.g. due to turbulent mixing at tropopause, at
the cloud edges or between the air parcels of
different history. Therefore in-situ (airborne)
measurements of absolute number of H
2
O molecules
per unit air volume are of great significance in
atmospheric physics for studies of climate variations
and trends, as well as for theoretical models testing.
In our optical hygrometer a single mode 20 mW
cw diode laser (Toptica, DL 100) tunable within
1.390 – 1.395 µm range was used as the light source.
CRDS approach was applied for H
2
O absorption
coefficient determination. Open path optical
0 10 20 30 40
10
10
10
11
10
12
10
13
10
14
10
15
10
16
10
17
10
18
concentration
[
cm
-3
]
altitude [km]
CO
2
H
2
O
CH
4
Figure 6: H
2
O, CO
2
and CH
4
concentration in atmosphere
at various altitudes.
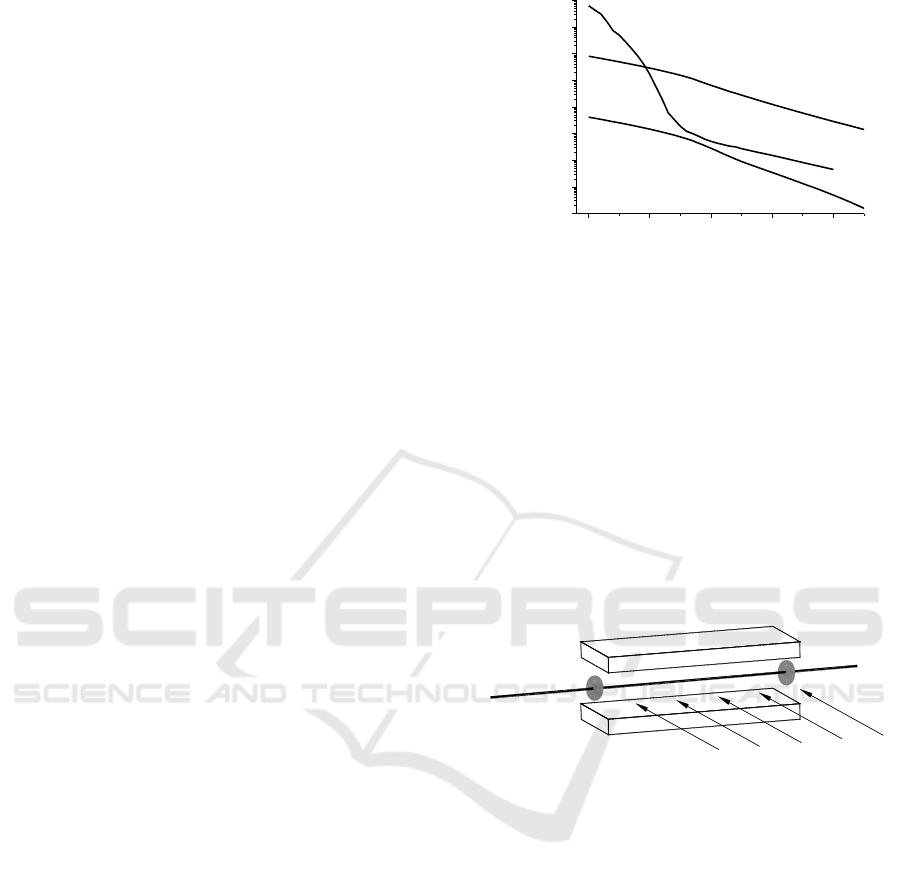
resonator (Figure 7) was used in order to eliminate a
disturbance of the results by water molecules
adsorbed or desorbed from the resonator walls. That
solution is especially important for the hygrometer
designated for airborne investigation, working at the
circumstances strongly changing with altitude.
Numerical studies of history of a molecule starting
from the upper or the bottom resonator wall and
tending to the laser beam region was performed. It
shows that for both laminar and turbulent gas flow
the probability that the desorbed molecule reaches
the laser beam region is negligible.
air flow
wall
laser beam
wall
mirror
mirror
Figure 7: Scheme of open space optical cavity. Walls were
6 cm wide and 3 cm distant; air flow was perpendicular to
the laser beam.
Spectrum analysis presented in Figure 8 shows
that 1.3925335 µm H
2
O line is the most suitable for
this purpose (Rothman, 2012). Value of the cross
section (~4.6·10
-20
cm
-3
) dominates about 3 orders of
magnitude over that one of methane and more than 8
orders of magnitude over that one of carbon dioxide.
That ensures, the absorption measurement of water
vapour is not interfered by CO
2
and CH
4
.
Shape of H
2
O absorption line depends on air
pressure, temperature and humidity. These
parameters must be measured simultaneously with
the water vapour absorption coefficient and –
(according to eq. 2) used for the cross section
correction. That procedure is especially important
for airborne application. The pressure dependences
are strongest (Figure 9), while the temperature
PHOTOPTICS 2018 - 6th International Conference on Photonics, Optics and Laser Technology
300
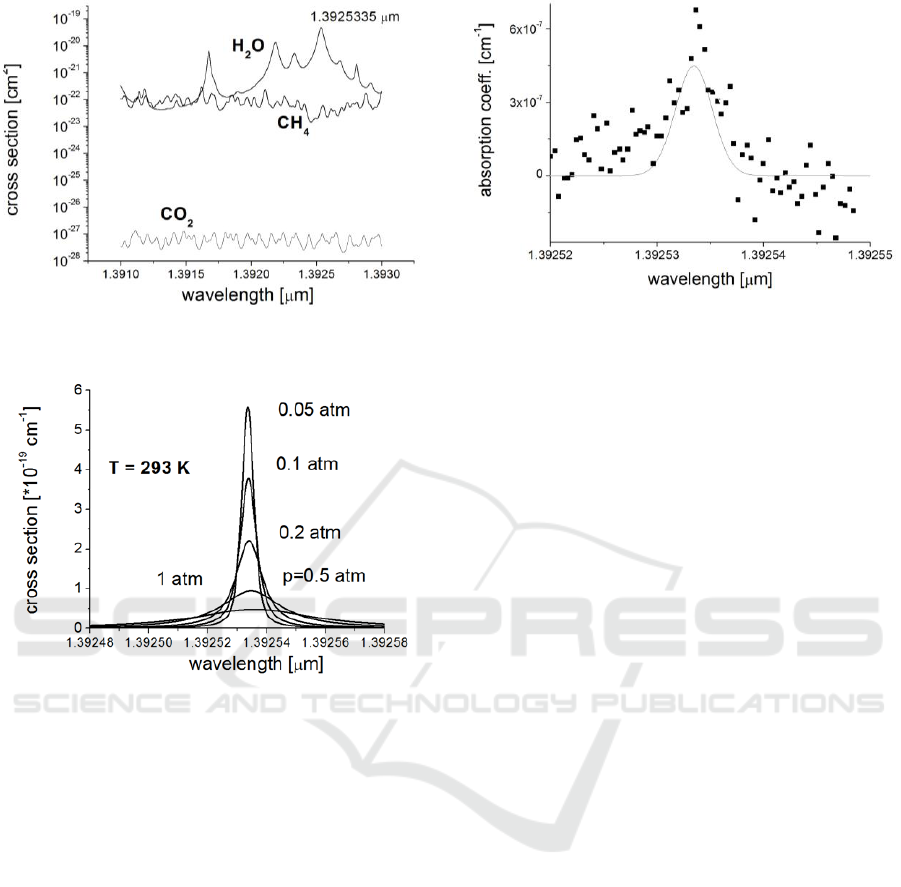
Figure 8. Absorption cross section of H
2
O, CO
2
and CH
4
at normal conditions.
Figure 9: Shapes of 1.3925355 µm line at various air
pressure.
influence is softer within the values occurring in
atmosphere. The influence of the humidity (called
self-broadening) becomes important at water vapour
concentration higher than 5·10
16
cm
-3
.
Our optical hygrometer was tested in a climatic
chamber under controlled air temperature, pressure
and humidity. Figure 10 presents result of
registration of 1.3925335 µm water vapour line at
0.001 mbar and water concentration (8.6 ± 1.4)·10
11
cm
-3
. Continuous line corresponds to theoretical
shape of Doppler broadened absorption line that
should occur in such circumstances.
Large spread of the experimental points probably
occurs due to insufficient stability of wavelength
control system and due to pure signal to noise level
at such low H
2
O concentration, so the line profile
was reproduced very approximately. Nevertheless
one can assume that the detection limit of this
optical hygrometer (defined as three times the
standard deviation) was about 1.1·10
12
cm
-3
, which
corresponds to mean water vapour concentration at
the altitudes above 30 km (Figure 6).
Figure 10: 1.3925335 µm line registered at 0.01 mbar and
H
2
O concentration of 8.6·10
11
cm
-3
.
Elaboration of the optical hygrometer working at
6 µm wavelength is in progress. As far as the
absorption cross section in this spectral range is
about 20 limes larger than near 1.4 µm, a much
better detection limit can be expected.
Another optical hygrometer based on simple
absorption measurement on 30 cm path was also
built. It was characterized by short reaction time (<
10
-2
s). This construction is designated for
monitoring of strong water vapour gradients at low
altitudes.
6 CONCLUSION
Laser absorption spectroscopy of high resolution is a
sensitive tool for trace gas detection. Due to
application of modern optoelectronic solutions
building of new apparatus is possible. These devices
might be relatively cheap, small size and weight as
well as low energy consuming. That provides
opportunity to introduce cheap gas sensors on
market together with novel methods which are
useful for industry, non-invasive medicine diagnosis
(screening), as well as for environmental and natural
sciences research.
ACKNOWLEDGEMENTS
The research was supported by The Polish National
Centre for Research and Development (research
project ID 179900) as well as by The Polish
National Science Centre (research projects
No. DEC - 2011/03/B/ST7/02544 and No. 2016/
23/B/ST7/03441).
Laser Spectroscopy for Trace Matter Detection in Air
301

REFERENCES
Berden, G., Engeln, R., 2009. Cavity Ring - Down
Spectroscopy: Techniques and Applications., Wiley-
Blackwell, 1
st
edition.
Bielecki, Z., Janucki, J., Kawalec, A., Mikołajczyk, J.,
Pałka, N., Pasternak, M., Pustelny, T., Stacewicz, T.,
Wojtas, J., 2012. Sensors and systems for the detection
of explosive devices – the overview, Metrol. Meas.
Syst. vol. 19, 3-28.
Buszewski, B., Grzywinski, D., Ligor, T., Stacewicz, T.,
Bielecki, Z., Wojtas, J., 2013. Detection of volatile
organic compounds as biomarkers in breath analysis
by different analytical techniques, Bioanalysis, vol. 5,
2287-2306.
Holc, K., Bielecki, Z., Wojtas, J., Perlin, P., Goss, J.,
Czyżewski, A., Magryta, P., Stacewicz, T., 2010. Blue
tunable laser diodes for trace matter detection, Optica
Applicata 40, 641 – 651.
O’Keefe, A., Deacon, D. A. G., 1988. Cavity ring-down
optical spectrometer for absorption measurements
using pulsed laser sources, Rev. Sci. Instrum. vol. 59,
2544-2551.
Perma Pure Product Life. Nafion: physical and chemical
properties. [Online]. Available from:
http://www.permapure.com/products/nafion-
tubing/nafion-physical-and-chemical-properties/.
Romanini, D., Kachanov, A, A., Sadeghi, N., Stoeckel,,F.,
1997. CW-cavity ring down spectroscopy, Chem.
Phys. Lett. vol. 264, 316-322.
Rothman, L. S., Gordon, I. E., Babikov, Y., Barbe, A.,
Benner, D. C., Bernath, P. F., Birk, M., Bizzocchi, L.,
Boudon, V., Brown, L. R., Campargue, A., Chance,
K., Cohen, E. A., Coudert, L. H., Devi, V. M., Drouin,
B. J., Fayt, A., Flaud, J. M., Gamache, R. R., Harrison,
J. J., Hartmann, J. M., Hill, C., Hodges, J. T.,
Jacquemart, D., Jolly A., Lamouroux, J., LeRoy, R. J.,
Li, G., Long, D.A., Lyulin, O., Mackie, C., Massie, S.
T., Mikhailenko, S., Müller, H. S., Naumenko, O.,
Nikitin, A., Orphal, J., Perevalov, V. I., Perrin, A.,
Polovtseva, E.R., Richard, C., Smith, M. A. H.,
Starikova, E., Sung, K., Tashkun, S., Tennyson, J.,
Toon G. C., Tyuterev, Vl. G., Wagner, G., 2013. The
HITRAN 2012 Molecular Spectroscopic Database, J.
Quant. Spectr. Radiation Transfer vol. 130, 4-50.
Stacewicz, T., Wojtas, J., Bielecki, Z., Nowakowski, M.,
Mikołajczyk, J., Mędrzycki, R., Rutecka, B., 2012.
Cavity ring down spectroscopy: Detection of trace
amounts of matter, Opt. Electron. Rev. 20, 34 – 41.
Szabra, D., Prokopiuk, A., Mikołajczyk, J., Ligor, T.,
Buszewski, B., Bielecki, Z., 2017. Air sampling unit
for breath analyzers, Rev. Sci. Instrum. vol. 88,
115006 1-6.
Wojtas, J., Bielecki, Z., Stacewicz, T., Mikolajczyk, J.,
Nowakowski, M., 2012. Ultrasensitive laser
spectroscopy for breath analysis, Opt. Electron. Rev.
vol. 20, 77–90.
Ye J., Ma, L. S., Hall, J. L., 1997. Ultrastable optical
frequency reference at 0,64 μm using a C
2
HD
molecular overtone transition, IEEE Transactions On
Instrumentation And Measurement vol. 46, 178-182.
PHOTOPTICS 2018 - 6th International Conference on Photonics, Optics and Laser Technology
302
