
FLASH: A New Key Structure Extraction used for Line or Crack
Detection
Yannick Faula, St
´
ephane Bres and V
´
eronique Eglin
Universit
´
e de Lyon, INSA-Lyon, LIRIS, UMR5205, F-69621, France
Keywords:
Line Detection, Crack Detection, Feature Extraction.
Abstract:
Key structures extraction like points, short-lines or regions extraction is a big issue in computer vision. Many
fields of application need large image acquisition and fast extraction of fine structures. Several methods have
been proposed with different accuracies and execution times. In this study, we focus on situations where exist-
ing local feature extractors give not enough satisfying results concerning both accuracy and time processing.
Especially, we focus on short-line extraction in local low-contrasted images. To this end, we propose a new
Fast Local Analysis by threSHolding (FLASH) designed to process large images under hard time constraints.
We apply FLASH on the field of concrete infrastructure monitoring where robots and UAVs(Unmanned Aerial
Vehicles) are more and more used for automated defect detection (like cracks). For large concrete surfaces,
there are several hard constraints such as the computational time and the reliability. Results show that the
computations are faster than several existing algorithms without learning stage, and lead to an automated
monitoring of infrastructures.
1 INTRODUCTION
Early detection of structure cracks prevents greater
damage and risks of accidents of concrete construc-
tion or paving roads that are initially engineered to be
durable enough to withstand weight, pressure and any
difficult weather conditions related to their use. Those
structures suffer the emergence of fine cracks which
can rapidly be transformed into deep flaws. As related
by (Mohan and Poobal, 2017), crack detection is the
”process of detecting the crack in the structures using
any of the processing techniques”. The objective of
many non-destructive image-based processing tech-
niques is to evaluate the type, the number, the width,
the length and the area of such defaults (Shan et al.,
2016).
The crack detection also faces some difficulties
due to irregularities of crack shapes, the natural il-
lumination conditions (or shading), the presence of
blemishes or specific embossed concrete textures.
According to (Koch et al., 2015) ”this is mainly due
to the unsolved problem of identifying and assessing
multiple interacting defects at the same location”.
The paper provides a new cracks inspection tools
considering keypoints extraction as efficient solution
to the detection of defects in concrete structures. In
computer vision based applications, it is necessary to
know how to locate and orientate efficiently the ele-
ments in their environment. To avoid the lack of in-
formations, several algorithms extract keypoints like
corners. These extractions are more and more used
in embedded systems which require hard constraints
on the algorithms. Generally, classical detectors like
SIFT or SURF are computationally expensive. In an
embedded system, the use of these points detector is
not conceivable. Therefore, some keypoints detectors
were proposed, like FAST (Rosten et al., 2010) and
line detectors like the real time LSD (Line Segment
Detector) (Gioi et al., 2012) but they are efficient in
high contrasted images. Low contrasted images, like
concrete surface images, lead to much worse results.
This work proposes a new solution to deal with these
kind of very low contrasted surfaces that provide tex-
tured images with very few information in them.
The complete flowchart of our approach contains
three main steps:
• FLASH points detection: FLASH points are spe-
cific areas containing a direction or orientation in-
formation (see section 3).
• Extraction of sets of connected FLASH points:
we build links between FLASH points that are
close enough and share a common direction.
Then, we retain all doubly linked pairs (see sec-
446
Faula, Y., Bres, S. and Eglin, V.
FLASH: A New Key Structure Extraction used for Line or Crack Detection.
DOI: 10.5220/0006656704460452
In Proceedings of the 13th International Joint Conference on Computer Vision, Imaging and Computer Graphics Theory and Applications (VISIGRAPP 2018) - Volume 4: VISAPP, pages
446-452
ISBN: 978-989-758-290-5
Copyright © 2018 by SCITEPRESS – Science and Technology Publications, Lda. All rights reserved

tion 4).
• Basic filtering and graphs construction: based on
the preceding pairs, we build graphs by itera-
tive merging and the shortest graphs are deleted.
These remaining graphs are good potential candi-
dates to be lines or cracks (see section 5).
The paper is organized as follows: the second sec-
tion deals with previous works on points and lines
extraction. In the third section, the FLASH extrac-
tion method (Fast Local Analysis by threSHolding) is
described and is evaluated. After the presentation of
line detection (in section 4), our algorithm is evalu-
ated relatively to time-consuming compared to other
state-of-art approaches dedicated to crack detection in
the section 5, in the application of crack detection on
concrete surfaces.
2 RELATED WORKS
2.1 Crack Detection Methods
Crack detection is one of the most important de-
faults detection in materials quality control. Gener-
ally, crack pixels are darker than their neighboors and
follow locally a direction. As demonstrated in the
rest of this paper, concrete surfaces provide images
that are especially interesting to illustrate the qual-
ities of FLASH. Beforehand, we present here some
of the existing methods for cracks detection. Mo-
han et al. in (Mohan and Poobal, 2017) classifies
the image-based crack detection into four categories
around morphological approaches, frequency-based
filtering and transforms, thresholding techniques, and
other combined techniques (Nguyen et al., 2014). The
only works that deal with an extraction of interest key
points (from lines or surfaces) are associated to the
domain of Photogrammetry and make measurements
from photographs to recover the exact positions of
surface points, (Yiyang, 2014), (Anwar and Abdullah,
2014).
(Pereira and Pereira, 2015) have used Sobel and
thresholding operator in order to detect cracks. Then,
the authors remove small isolated components to
eliminate noise components on a concrete surface.
(Jahanshahi et al., 2011) have used morphological op-
erations and Otsu thresholding. Then a SVM clas-
sifier has been used to finalize crack detection. A
median filter and a probabilistic relaxation have been
used in (Fujita and Hamamoto, 2010). Despite many
efforts to raise an efficient crack detection, iterations
of the relaxation on large images are not efficient in a
real-time processing. Very few algorithms can detect
thin cracks in low contrast and in real-time conditions.
In a concrete structure monitoring, the hard constraint
time is defined by the time to stabilise a drone and to
take a picture. It is crucial to process an image before
taking another photograph to know the location of a
potential crack for a high-resolution acquisition. Our
proposition named FLASH which is a line detector, is
a promising solution in this area.
2.2 Keypoint Approaches for Line and
Objects Detection
Detectors are methods that locate small regions, or
even points, considered to be more informative. SIFT
(Lowe, 2004) and SURF(Bay et al., 2008) are the
most known keypoints detectors over the last decade.
They succeed in high contrasted images but fail most
of the time, in low contrasted images like concrete
surfaces and moreover, their computation is very ex-
pensive in time. According to (Mikolajczyk and
Schmid, 2005), a detector must answer the follow-
ing criteria: repeatability, precision and low comput-
ing time. FAST (Rosten et al., 2010) is a robust fast
corner detector, but it does not compute the local ori-
entation. Another robust detector, ORB(Rublee et al.,
2011) based on FAST gives the orientation in a further
step. The survey (Rey-Otero et al., 2014) gives more
details. Among lines detectors, the most famous is the
Hough transform (Duda and Hart, 1972). By mod-
elling in the Hough space every possible straight lines
passing through a point, they can find sets of points
whose organisation create a line. But here again, the
computational time is not efficient in an embedded
system, and lines have to be sufficiently long to be de-
tected. LSD described in (Gioi et al., 2012) is a linear-
time Line Segment Detector able to process images in
real time with accurate results and no configuration.
The shortcoming is a double detection for a straight
line with one-pixel width. Moreover, detection gives
no information about the orientation or the contrast of
a line.
Consequently, existing solutions are not fully sat-
isfying on low-textured images, with low contrast,
when fast computation is required. Hence, we pro-
pose a new detector, able to process low-textured low-
contrasted images in hard time constrained applica-
tions.
3 FLASH: THE DETECTOR
Our detector is based on the analysis of a reduced
number of pixels around the current pixel, like in
(Rosten et al., 2010). We consider only pixels on
FLASH: A New Key Structure Extraction used for Line or Crack Detection
447
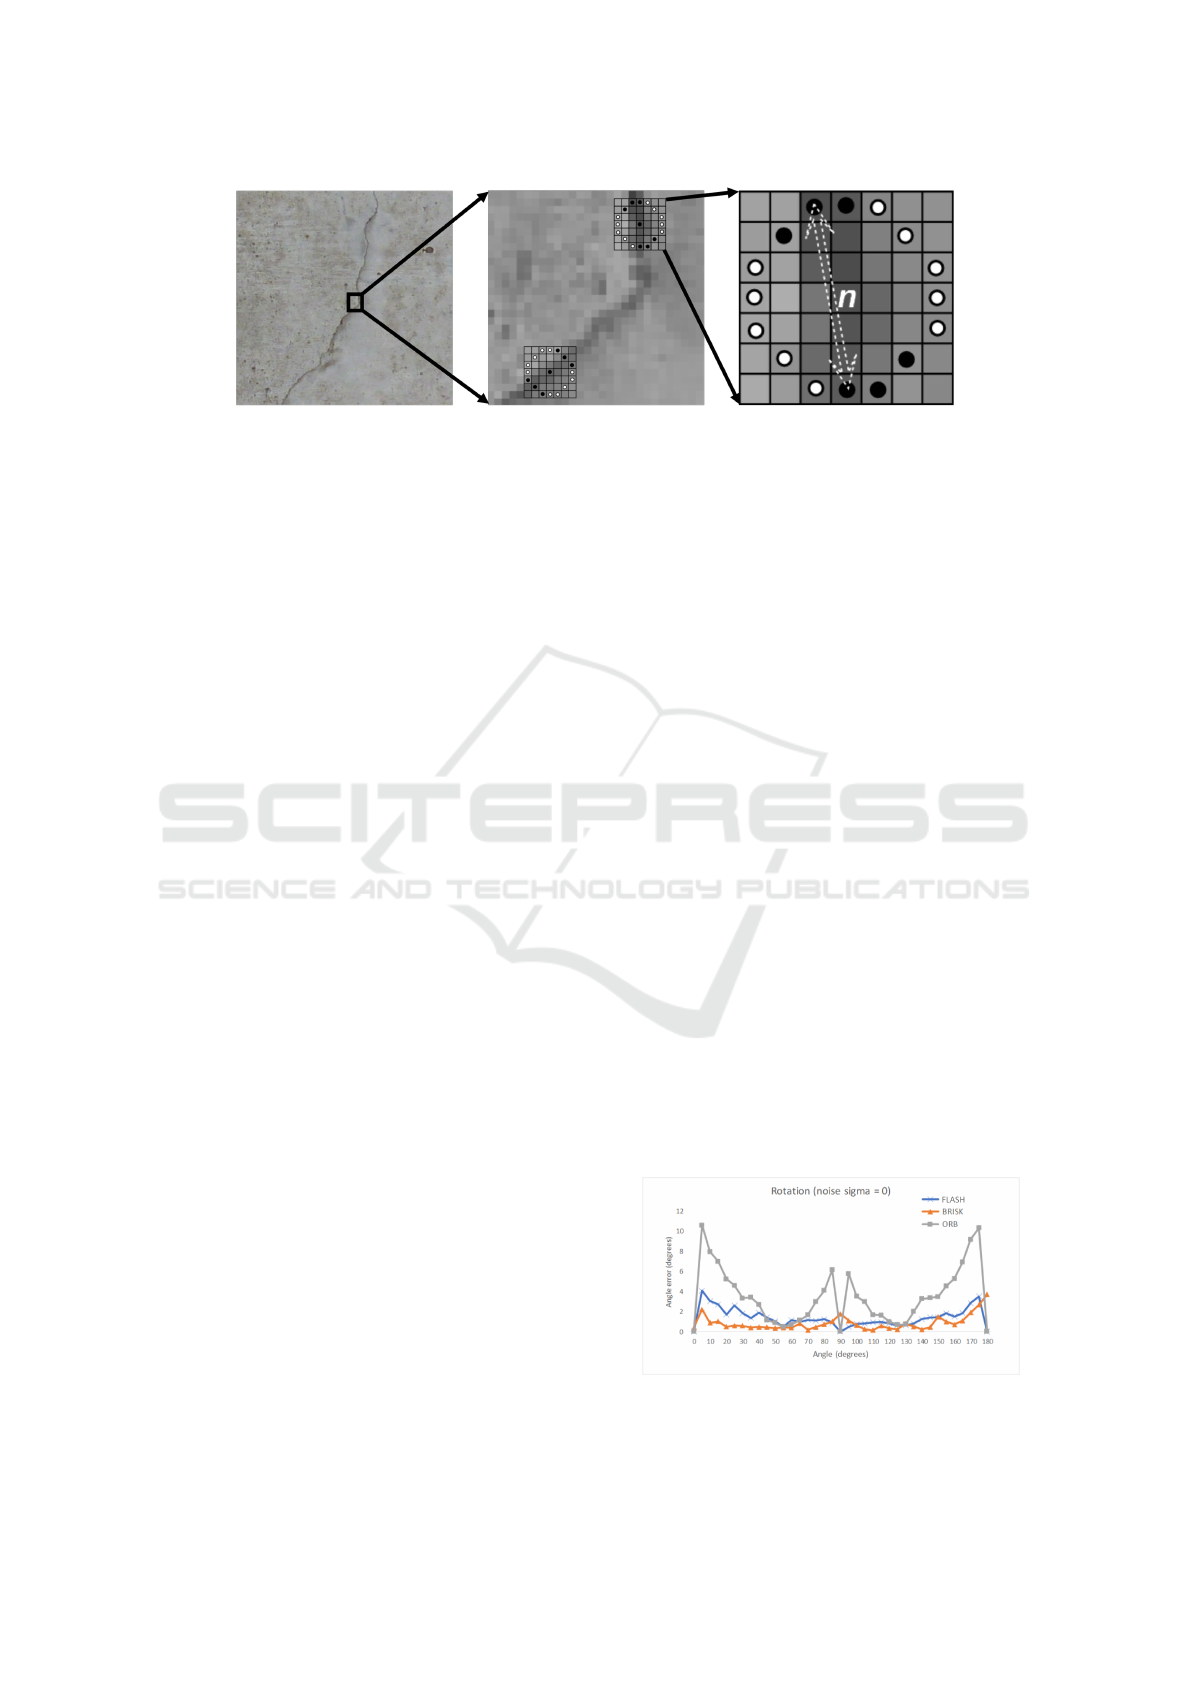
Figure 1: Mask of the detector. The white point are brighter than the central point n.
the Bresenham circle of radius 3. We distinguish
two kinds of keypoints, as illustrated on figure 1:
micro-lines with one typical direction (without orien-
tation) and corner points with one typical orientation.
FLASH detects these two types of points. Micro-lines
are the most important class of points useful to detect
straight lines.
3.1 Main Principle
We define a central pixel called n. Its intensity in gray
level is called I(n). We name p a pixel on the Bre-
senham circle and I(p) its grey level. A pixel is con-
sidered as a typical point if ∀p, I(p) >= I(n) + t with
p ∈ P
white
a set formed by five consecutive pixels plus
their symmetrical points (see the white point in Figure
1). t is a threshold which allows to be more or less re-
strictive. Three points with their symmetrical points
are remaining, these are pixels containing the black
circles illustrated in Figure 1. We called these sets of
pixels P
black
and P
s
black
their symmetrical points. The
next step gives us the type of the considered pixel.
1. If I(p
b
) < min(I(p
w
)) for p
b
∈ P
black
∪ P
s
black
and
p
w
∈ P
white
then the pixel is a micro line.
2. If I(p
b
) >= min(I(p
w
)) and I(p
s
b
) < min(I(p
w
))
for p
b
∈ P
black
, p
s
b
∈ P
s
black
and p
w
∈ P
white
then the
pixel is a corner-like point, close to the definition
of FAST points.
This mask has eight possible configurations by ro-
tation around the central pixel n. The mask size and
the number of pixels considered in P
white
(the set com-
posed by white pixels in the figure 1) are the best com-
promise we found after different tests among other
choices, to process images in a fast and efficient way.
Because of the similarities of our process with the
computation of FAST points, we can use the same
kind of optimisation as the one they use in FAST
point detection method (Rosten et al., 2010). It is then
possible to eliminate a candidate pixel with two five-
pixels segment tests only. In other words, testing two
pixels with their symmetrical allow us to know if all
remaining tests can fail.
It is important to notice that we present here only
the case of a current pixel n darker than its neighbour-
hood. Of course, the opposite case where the current
pixel n is brighter than its neighbourhood is also con-
sidered in the extraction of our FLASH points. The
processing of these brighter pixels can be obviously
deduced.
3.2 Direction, Orientation and Score
Computation
Our algorithm computes the direction and possible
orientation during the detection step. In FLASH, the
direction and orientation are local features of the de-
tected point. A pixel can answer to several config-
urations but its orientation does not change. Basi-
cally, the vector formed by the two pixel in the mask
with the lowest intensity gives us the orientation. For
the micro-lines, we consider pixels among P
black
and
we have only a direction. For the corner points, the
vector of the orientation is formed by the junction of
the central pixel and the pixel with the lowest inten-
sity among the black ones. This orientation is more
robust than the ones computed by ORB and BRISK
(Leutenegger et al., 2011)(see figure 2). A score,
based on the difference between the grey level of the
lowest white and the greatest black value allows to
evaluate the contrast of a micro-line. This value can
be used to select the most significant micro-lines in an
image.
Figure 2: Rotation evaluation with synthetic rotation of 5
different images.
VISAPP 2018 - International Conference on Computer Vision Theory and Applications
448
4 LINE DETECTION
After the detection step, we have to determine if a set
of points forms a part of a line. Consequently we have
to analyse images at a higher scale to detect longer
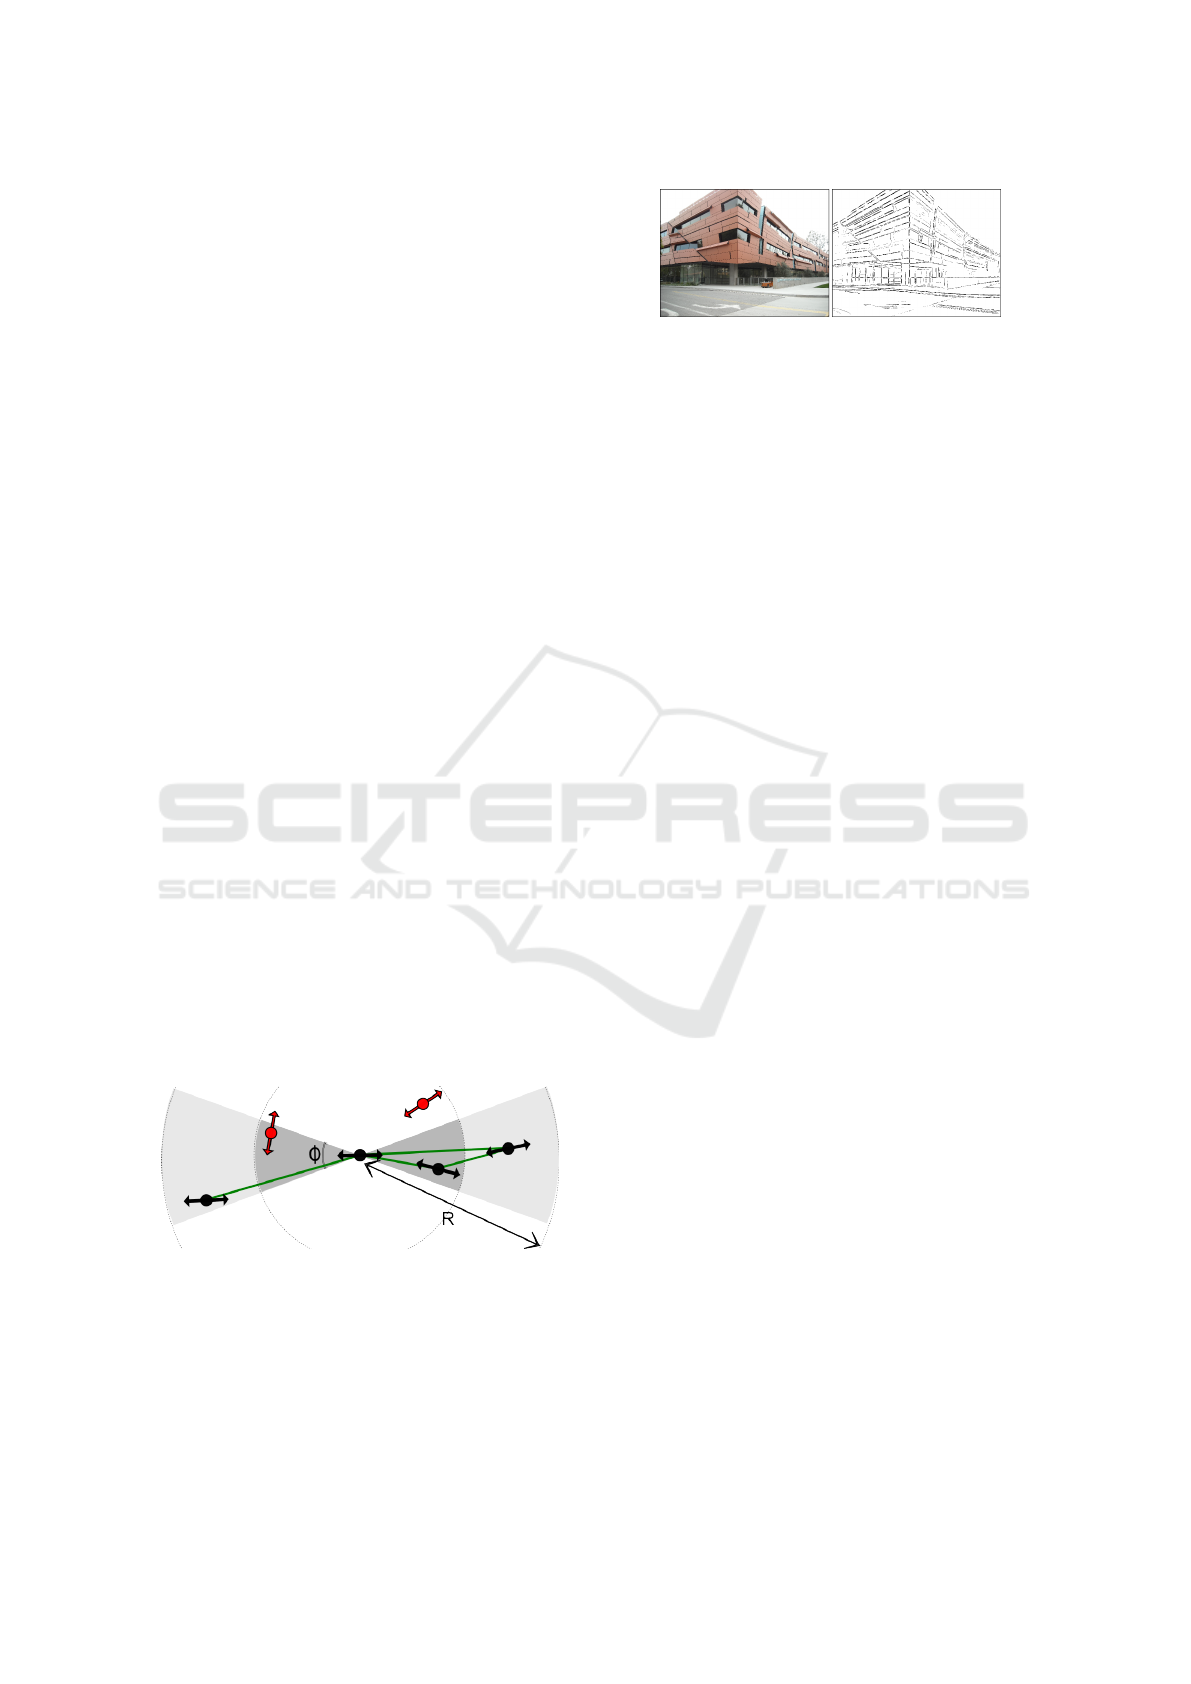
straight lines. We seek to consider a specific organi-
zation of points. We define a search area around the
considered point. This area is divided by n regular
intervals. For example, the figure 3 has two intervals
and a radius R. The orientation of the point defines an
area (the darker areas in 3).
The search area is then reduced to circular sector
with an angle φ which defines a parameter of toler-
ance. This tolerance has a big impact on the line de-
tection. A value of 45 degrees allows to reach eight
points with an octagonal configuration for some spe-
cific orientations(0, 45, 90, ..., 180).
The search of reachable points begins at the first
interval. If a minimum number of points satisfies the
preceding conditions, then we can search reachable
points in the next interval. Otherwise, we stop the
search. This stage allows to remove many isolated
points and disable the necessity to connect them to
other distant points. The minimum number of points
required for each interval depends on the scene con-
text and what we are looking for. For example, a very
contrasted line requires a small area and few points
for each interval because many points can be detected.
As a consequence, this minimum number of points is
empirically defined for each application.
The next step consists in building the set of reach-
able points of a point p and we call it ψ
p
. Each point
can be connected with its neighboors. If a point has
no connection, this point is deleted. A liaison between
two points a and b is defined if b ∈ ψ
a
and a ∈ ψ
b
. At
the end of the process, we have a set of graphs. Each
graph is constituted by points in the same orientation
along a straight line.
Figure 3: Line detection and graph constitution. In green,
the obtained graph after completing the process for all
points. The red points will be deleted.
Figure 4: Example of line detection with SOBEL+FLASH
(image source from the Caltech dataset
1
).
5 APPLICATION TO CRACK
DETECTION
5.1 Experimental Protocol
As far as we know, no public database of concrete
surface photographs is freely available. According to
(Mohan and Poobal, 2017), most of them are local
databases used for a private industry. In this way, we
have formed a freely available small database of con-
crete surfaces. This is composed of 201 512x512 im-
ages. The ground truth is provided in the SVG format.
The description is not at pixel level but indicates, with
less than ten pixels of error, the presence of a crack.
The ground truth is defined with polylines because a
crack can be perceived like a succession of lines. So,
few connected pixels are sufficient for describing en-
tirely a crack. It is not a description pixel by pixel
but an indication of presence all along the crack. The
ground truth descriptions were approved by a human
operator, expert in the domain. The database will be
completed with images and descriptions concerning
opening, and length of a crack.
In our application, the big issue is to detect cracks
without characterization. Different evaluations in the
literature are computed at a pixel level. It is a too com-
plicate task to have a ground truth, defined at the pixel
level, sufficiently large to be representative. Thus, in
this paper, we used a region-based approach for our
evaluation, which is more compatible with the poly-
line ground trith we have. This is done by checking
the presence of a crack pixel in an area. Thus, the
experimental evaluation is performed as follows: the
image is divided into several blocks (squares) of 16
pixels (depending on the wanted precision of the eval-
uation). We check the presence of cracks into these
blocks both for the ground truth image and the detec-
tion image separately. The output is a boolean matrix
where every boolean value represents the presence of
a crack in a block. After this step, we compare the two
matrices of same dimensions and the number of true
positive (TP), false positive(FP), true negative (TN)
and false negative(FN) blocks can be counted easily.
The followed values, respectively the recall and the
FLASH: A New Key Structure Extraction used for Line or Crack Detection
449

Table 1: Execution times per pixel for crack detection.
?
Partial implementation. Complete processing takes longer
execution time.
Algorithm Execution Time
(10e-8 s)
FLASH 4.04
(Pereira and Pereira, 2015) 1.74
(Jahanshahi et al., 2011)
?
2.50
(Fujita and Hamamoto, 2010)
?
4.48
(Gioi et al., 2012) 8.99
specificity, are computed to evaluate our algorithm:
rec
b
=
T P
(T P + FN)
(1)
spec
b
=
T N
(T N + FP)
(2)
In practice, to affirm the presence of a crack in an
image, only a part of this crack has to be detected. For
our evaluations, we will consider that a whole crack is
detected if at least 50% of its constituted blocks have
been detected. In a practical case, this value can even
be reduced. So, the following value is computed in
the evaluation :
rec
P
c
=
number o f relevant detected cracks at P%
number o f all relevant cracks
(3)
About the used parameters, we set the threshold t
at 5 because it allows to detect thin cracks. We have
a tolerance for the reachable search of 45 degrees and
three intervals for the line detection step, for a max-
imum radius of 9 pixels. Our goal is to detect crack
with an opening of 0.2mm in images with a resolution
of 0.5mm per pixel. So the damages are sub-pixel. In-
deed, sampling has a poor impact on pixels but does
not limit the detection of sub-pixel cracks. For the ex-
perimental part, we have implemented the algorithm
proposed by Jahanshahi in (Jahanshahi et al., 2011)
without the objects classification stage, but only the
elimination of small components. Likewise, we com-
pare our algorithm with the preprocessing step in (Fu-
jita and Hamamoto, 2010). We compare the compu-
tation time with existing techniques like (Gioi et al.,
2012; Fujita and Hamamoto, 2010; Jahanshahi et al.,
2011).
5.2 Experimental Results
As we can see in the table 1, experimental results
show that FLASH detector has the third best exe-
cution time, but our process also includes the com-
putational cost for the construction of all dedicated
data structures to represent interesting points and de-
tected cracks. Few standard data structures are used
Table 2: Evaluation of crack detection.
?
Partial implemen-
tation.
Algorithm rec
b
spec
b
rec
50
c
FLASH 0.65 0.94 0.77
(Pereira and Pereira, 2015) 0.83 0.25 0.87
(Jahanshahi et al., 2011)
?
0.69 0.48 0.75
(Fujita and Hamamoto, 2010)
?
0.74 0.41 0.80
(Gioi et al., 2012) 0.25 0.98 0.12
in our implementation, therefore, we can not bene-
fit from optimizations like SIMD (Single-Instruction-
Multiple-Data) optimizations (e.g. SSE2, AVX...) ex-
ploited by OpenCV. The other algorithms are imple-
mented with simple OpenCV functions because they
are based on a succession of basic classical operations
so, they benefit from SIMD optimizations. All steps
in the FLASH detection process can be parallelized
and the time processing can be divided easily by a
factor 4 with a multi-thread implementation. That is a
future step in our works but it is not presented in this
paper. So, our algorithm has similar time to pre pro-
cessing steps in the algorithms of the literature. Con-
sequently, we have an efficient detection of cracks and
we can complete our detection with any characteriza-
tion based on machine learning techniques.
The table 2 shows FLASH has not the best rec
b
but has almost the same rec
c
as Fujita et al. (Fujita
and Hamamoto, 2010) meaning most cracks are de-
tected whose thin cracks. In addition to these values,
we have obtained a rec
25
c
score of 98% of detected
cracks. For (Jahanshahi et al., 2011), results show
only cracks with a big opening (width) are correctly
detected. LSD is not designed for crack detection
but do not detect all artifacts in the images. Pereira
et al. has the largest number of detected cracks but
has a specificity spec
b
very low. For an automation
purpose, this is not reliable because they detect all
artifacts like bubbles or embossed concrete surfaces.
These defects are not considered by a monitoring op-
erator. He should not be alerted by a crack detection
in several thousands of images. We want to remind
that our goal is to have a high recall and high speci-
ficity simultaneously.
We see in the figure 6 that small cracks are de-
tected. Other algorithms failed to detect these cracks.
Moreover, the analysis of the spatial organization im-
proves the robustness of FLASH to noise in concrete
surfaces. Our detector can detect crack with an open-
ing ranging from one pixel to four pixels. To identify
cracks with a bigger opening, we can process images
at different scales.
Sometimes, several cracks are not interesting for
the detection step. The monitoring operator reckons
with the direction and the location of a crack. In this
paper, we do not sort cracks but with our method, we
VISAPP 2018 - International Conference on Computer Vision Theory and Applications
450

can easily give only the interested cracks thanks to our
direction computation.
We can finally mention that small numbers of false
positive are mainly due to the unsolved problem of
combining multiple interacting physical defects at the
same location or very low-contrasted cracks (see fig-
ure 5). In the literature, we can regret the lack of stan-
dardization and comprehensive representation of de-
fect information.
We can mention that in most of crack detection
works that are reported to be efficient, only few ex-
amples are used for the accuracy evaluation. We use
a much bigger database in our evaluations. The lack
of public available large datasets, that should leverage
crack detection methods, limits the potential of direct
comparisons between them, (Salman et al., 2013).
Figure 5: (Left)Example of false detection. (Right)Example
of missed detection.
6 CONCLUSION
In this article, we propose a new line detector called
FLASH and applied here in concrete structures for
crack detection. The detected micro-lines are very
stable and efficient to straight line detection. The pro-
cess for graph construction is cheap in time. Some
informations about the graph and orientation can be
used to describe an object. The experimental results
show better reliability for crack detection than the
existing algorithms. We can use it in an embedded
system like a UAV to monitor automatically a con-
crete structure. We will present more examples at
liris.cnrs.fr/∼yfaula/.
ACKNOWLEDGEMENTS
This work is supported by Smart Aerial Machines and
SNCF R
´
eseau. Thanks to Jean Delzers and Alain
Morice for their suggestions.
REFERENCES
Anwar, S. A. and Abdullah, M. Z. (2014). Micro-crack
detection of multicrystalline solar cells featuring an
improved anisotropic diffusion filter and image seg-
mentation technique. EURASIP Journal on Image and
Video Processing, 2014(1):15.
Bay, H., Ess, A., Tuytelaars, T., and Van Gool, L. (2008).
Speeded-Up Robust Features (SURF). Comput. Vis.
Image Underst., 110(3):346–359.
Duda, R. O. and Hart, P. E. (1972). Use of the Hough
Transformation to Detect Lines and Curves in Pic-
tures. Commun. ACM, 15(1):11–15.
Fujita, Y. and Hamamoto, Y. (2010). A robust automatic
crack detection method from noisy concrete surfaces.
Machine Vision and Applications, 22(2):245–254.
Gioi, R. G. v., Jakubowicz, J., Morel, J.-M., and Randall,
G. (2012). LSD: a Line Segment Detector. Image
Processing On Line, 2:35–55.
Jahanshahi, M. R., Masri, S. F., Padgett, C. W., and
Sukhatme, G. S. (2011). An innovative methodology
for detection and quantification of cracks through in-
corporation of depth perception. Machine Vision and
Applications, 24(2):227–241.
Koch, C., Georgieva, K., Kasireddy, V., Akinci, B., and
Fieguth, P. (2015). A review on computer vision based
defect detection and condition assessment of concrete
and asphalt civil infrastructure. Advanced Engineer-
ing Informatics, 29(2):196–210.
Leutenegger, S., Chli, M., and Siegwart, R. Y. (2011).
BRISK: Binary Robust invariant scalable keypoints.
In 2011 International Conference on Computer Vi-
sion, pages 2548–2555.
Lowe, D. G. (2004). Distinctive Image Features from Scale-
Invariant Keypoints. Int. J. Comput. Vision, 60(2):91–
110.
Mikolajczyk, K. and Schmid, C. (2005). A perfor-
mance evaluation of local descriptors. IEEE Trans-
actions on Pattern Analysis and Machine Intelligence,
27(10):1615–1630.
Mohan, A. and Poobal, S. (2017). Crack detection us-
ing image processing: A critical review and analysis.
Alexandria Engineering Journal.
Nguyen, H.-N., Kam, T.-Y., and Cheng, P.-Y. (2014). An
Automatic Approach for Accurate Edge Detection
of Concrete Crack Utilizing 2d Geometric Features
of Crack. Journal of Signal Processing Systems,
77(3):221–240.
Pereira, F. C. and Pereira, C. E. (2015). Embedded
Image Processing Systems for Automatic Recogni-
tion of Cracks using {UAVs}. IFAC-PapersOnLine,
48(10):16 – 21. 2nd {IFAC} Conference on Embed-
ded Systems, Computer Intelligence and Telematics
{CESCIT} 2015Maribor, Slovenia, 22-24 June 2015.
Rey-Otero, I., Delbracio, M., and Morel, J.-M. (2014).
Comparing Feature Detectors: A bias in the repeata-
bility criteria, and how to correct it. arXiv:1409.2465
[cs]. arXiv: 1409.2465.
Rosten, E., Porter, R., and Drummond, T. (2010). Faster
and Better: A Machine Learning Approach to Corner
Detection. IEEE Transactions on Pattern Analysis and
Machine Intelligence, 32(1):105–119.
Rublee, E., Rabaud, V., Konolige, K., and Bradski, G.
(2011). ORB: An efficient alternative to SIFT or
SURF. In 2011 International Conference on Com-
puter Vision, pages 2564–2571.
FLASH: A New Key Structure Extraction used for Line or Crack Detection
451
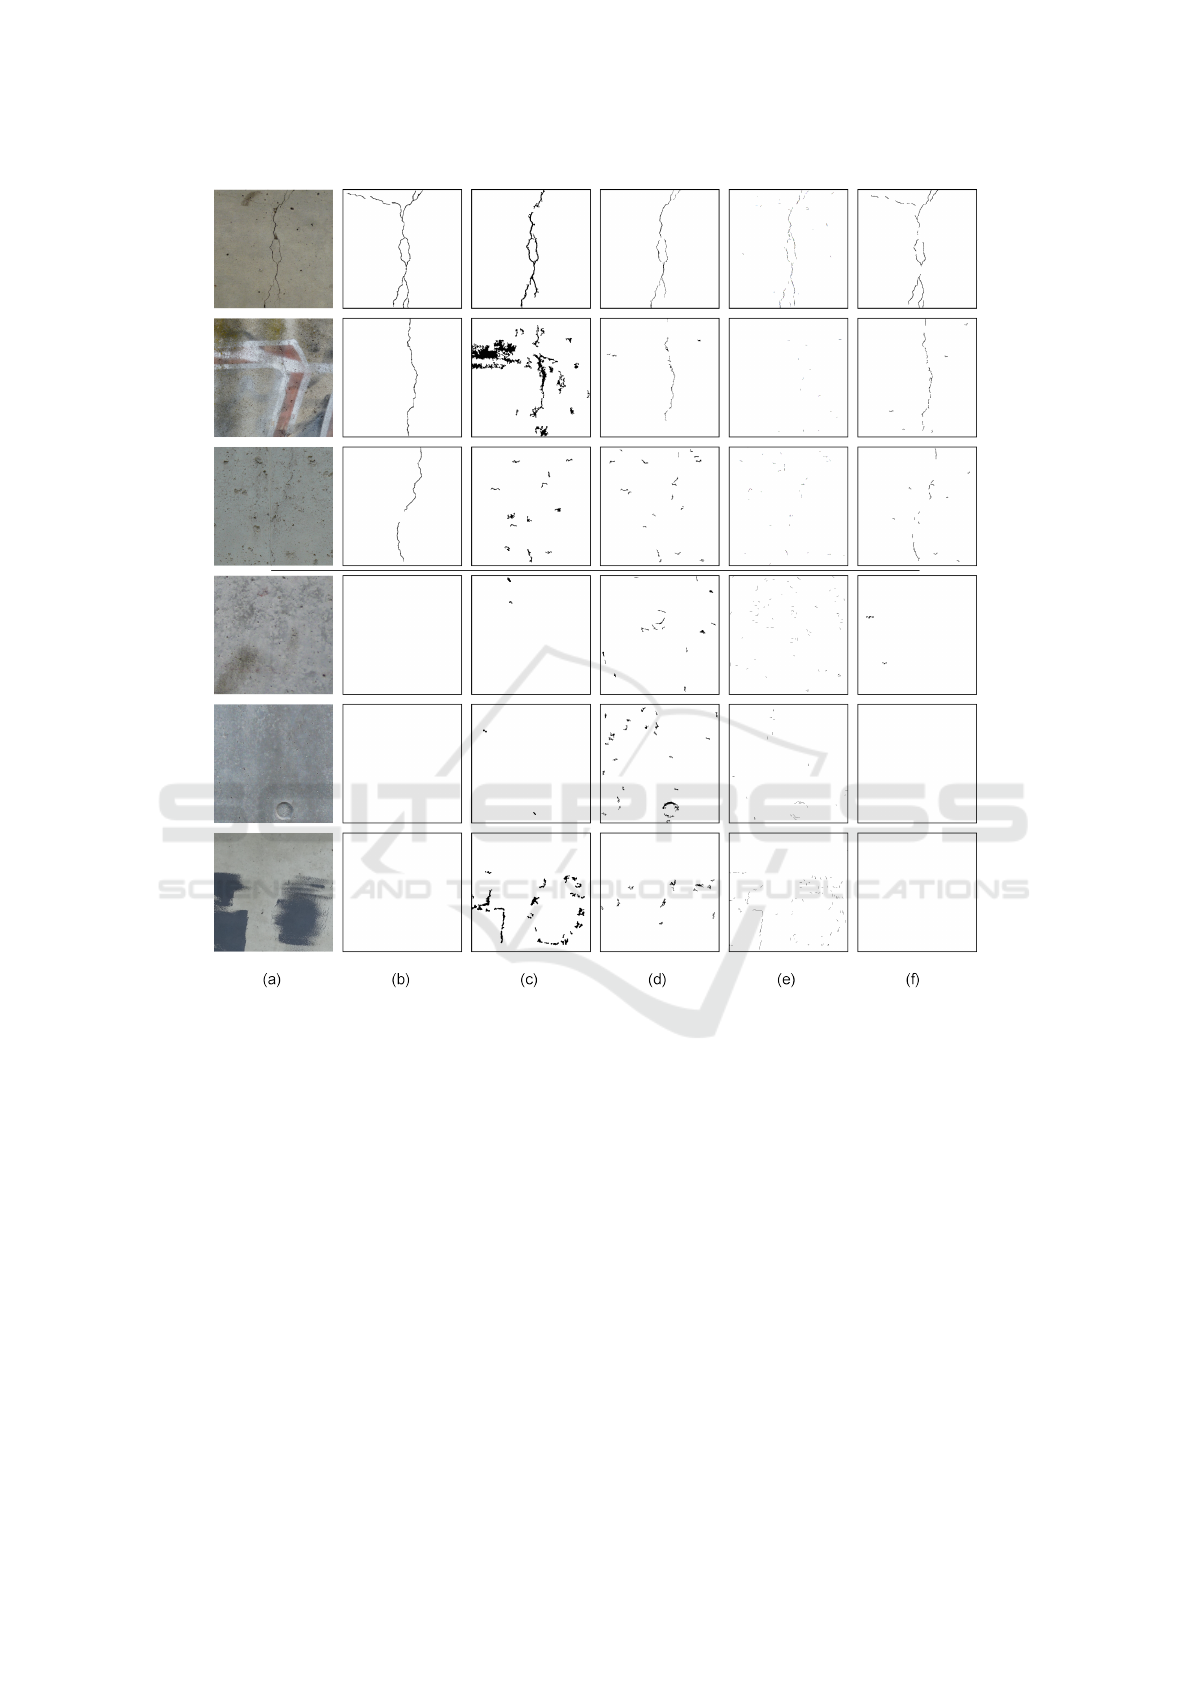
Figure 6: Examples of crack detection. (a)Original image (b) Ground truth (c) (Pereira and Pereira, 2015) (d) (Jahanshahi
et al., 2011) (e) LSD (Gioi et al., 2012) (f)FLASH.
Salman, M., Mathavan, S., Kamal, K., and Rahman, M.
(2013). Pavement crack detection using the Gabor
filter. In 2013 16th International IEEE Conference
on Intelligent Transportation Systems - (ITSC), pages
2039–2044.
Shan, B., Zheng, S., and Ou, J. (2016). A stereovision-
based crack width detection approach for concrete sur-
face assessment. KSCE Journal of Civil Engineering,
20(2):803–812.
Yiyang, Z. (2014). The design of glass crack detection
system based on image preprocessing technology. In
2014 IEEE 7th Joint International Information Tech-
nology and Artificial Intelligence Conference, pages
39–42.
VISAPP 2018 - International Conference on Computer Vision Theory and Applications
452
