
New Cluster Detection using Semi-supervised Clustering
Ensemble Method
Huaying Li and Aleksandar Jeremic
∗
Department of Electrical and Computer Engineering, McMaster University Hamilton, Ontario, Canada
Keywords:
Clustering, Information Fusion, Cluster Ensemble and Semi-supervised Learning.
Abstract:
In the recent years there has been tremendous development of data acquisition system resulting in a whole
new set of so called big data problems. Since these data structures are inherently dynamic and constantly
changing the number of clusters is usually unknown. Furthermore the ”true” number of clusters can depend
on the constraints and/or perception (biases) set by experts, users, customers, etc., which can also change.
In this paper we propose a new cluster detection algorithm based on a semi-supervised clustering ensemble
method. Information fusion techniques have been widely applied in many applications including clustering,
classification, detection, etc. Although clustering is unsupervised and it does not require any training data,
in many applications, expert opinions are usually available to label a portion of data observations. These
labels can be viewed as the guidance information to combine the cluster labels that are generated by different
local clusters. It consists of two major steps: the base clustering generation and the fusion. Since the step of
generating base clusterings is unsupervised and the step of combining base clusterings is supervised, in the
context of this paper, we name the algorithm as the semi-supervised clustering ensemble algorithm. We then
propose to detect a new cluster utilizing the average association vector computed for each data point by the
semi-supervised method.
1 INTRODUCTION
Although many clustering algorithms exist in the lit-
erature, in practice no single algorithm can correctly
identify the underlying structure of all data sets (Jain
et al., 1999)(Xu et al., 2005). Furthermore, it is usu-
ally difficult to select a suitable clustering algorithm
for a given data set when prior information about
cluster shape and size are not available. In addi-
tion, for a particular clustering algorithm, it usually
generates different clusterings for a given data set
by starting from different initiations or using differ-
ent parameter settings. Consequently, we expect to
improve the quality of the cluster analysis by com-
bining multiple clusterings into a consensus cluster-
ing. The problem involving combination of multi-
ple clusterings is often referred to as clustering en-
semble problem in the literature (Strehl and Ghosh,
2003)(Wang et al., 2011)(Ghaemi et al., 2009)(Vega-
Pons and Ruiz-Shulcloper, 2011).
In many applications it may be of interest to de-
tect a so called new cluster i.e. an event in which
new data (e.g. new type of cells, new type of cus-
tomers etc.) with different statistical properties ap-
∗
This work was supported by Natural Sciences and En-
gineering Research Council of Canada.
pears and cannot be classified to any of the exist-
ing clusters. Obviously one possible interpretation of
such event could be a need to redefine existing clus-
ters by defining new, larger data groups to accom-
modate these changes. However in certain instances,
e.g. in biochemistry, by applying particular chemical
treatments a desired outcome is creation of new cell
types and in these cases such an algorithm would be
beneficial in order to identify successful treatments.
To this purpose in this paper we propose an algo-
rithm for new cluster detection using clustering en-
semble method. Usually, clustering algorithms do not
require training data to generate cluster labels. How-
ever, in many applications, opinions from experts are
available to label at least a portion of the data points.
These labels can be utilized as supervision and guid-
ance information for the fusion process of the cluster
labels. Therefore, in this paper we utilize our pre-
viously proposed (Li and Jeremi´c, 2017) clustering
ensemble algorithms for the scenario of presence of
training data points (labelled). The proposed method
consists of two major steps: the generation and fu-
sion of multiple base clusterings. The first step is to
generate a set of base clusterings by applying unsu-
pervised clustering algorithms. The second step is to
fuse multiple clusterings into a consensus clustering.
Li, H. and Jeremic, A.
New Cluster Detection using Semi-supervised Clustering Ensemble Method.
DOI: 10.5220/0006653802210226
In Proceedings of the 11th International Joint Conference on Biomedical Engineering Systems and Technologies (BIOSTEC 2018) - Volume 4: BIOSIGNALS, pages 221-226
ISBN: 978-989-758-279-0
Copyright © 2018 by SCITEPRESS – Science and Technology Publications, Lda. All rights reserved
221
This step is considered as supervised since it utilizes
the labels of training data points as the guidance for
the points which appears in the confusion region of
two or more clusters. In the context of this paper,
we name it as the semi-supervised clustering ensem-
ble algorithm (SEA). It computes association vectors
for each data point according to different base clus-
terings. Using these results we then propose a new
cluster detection algorithm based on the average asso-
ciation vector generated for each data point by SEA.
This proposed algorithm has the ability to automat-
ically determine whether additional data points to a
given data set come from existing classes or from a
newclass. The rest of this paper is outlined as follows.
In Section 2, we propose the semi-supervised cluster-
ing ensemble algorithm. In Section 3, we propose the
new cluster detection algorithm. In Section 4, we pro-
vide numerical examples to show the performance of
our proposed algorithms using real data sets.
2 SEMI-SUPERVISED
CLUSTERING ENSEMBLE
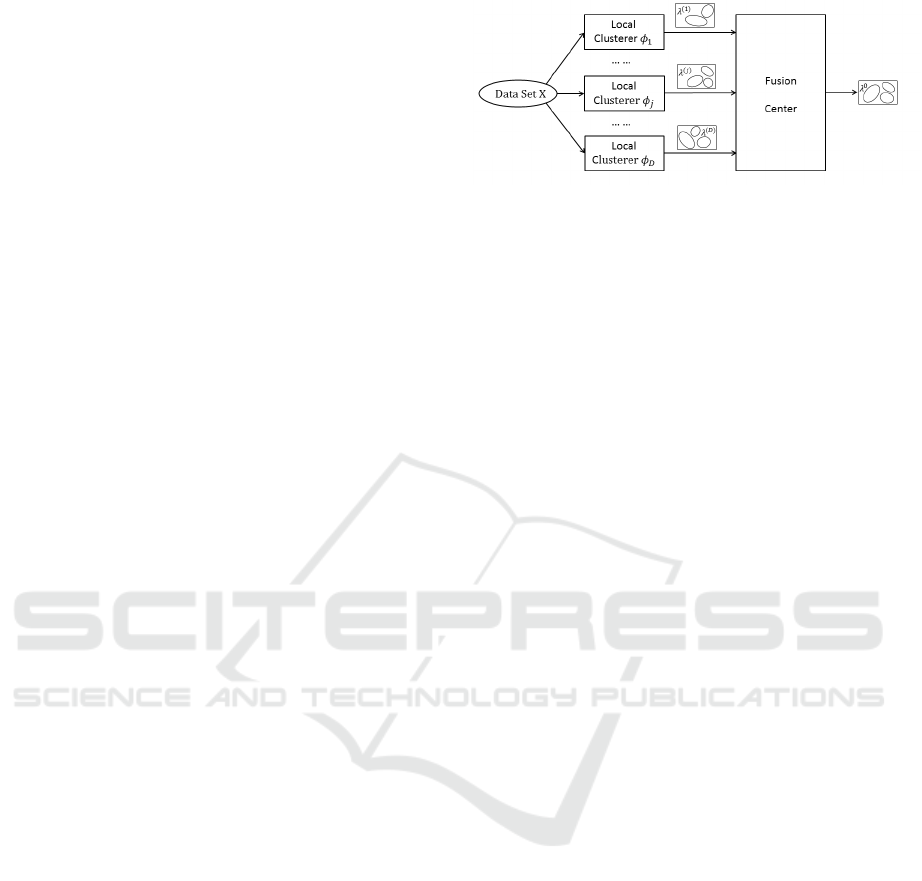
The semi-supervised clustering ensemble algorithms
consists of two major steps: the generation and fusion
of base clusterings, as shown in Fig. 1. A data set con-
taining N data points is denoted as X = {x
1
,...,x
N
},
where each data point x
i
∈ ℜ
F
, for all i = 1, . . . ,N,
comes from F-dimensional feature space. A clusterer
F
j
is a local unit that produces a base clustering for
the given data set. The base clustering is usually rep-
resented by a label vector λ
( j)
. Cluster labels derived
by different local clusterers form a set of base cluster-
ings {λ
(1)
,...,λ
( j)
,...,λ
(D)
} and it can be viewed as
an N × D label matrix F , the entry of which on the
i-th row and j-th column is the cluster label of data
point x
i
according to the j-th clustering. All the base
clusterings are sent to the fusion center, which pro-
duces a consensus clustering λ
0
, a better clustering of
the given data set in some sense compared with each
individual clustering.
In general, combining multiple clusterings is more
difficult than combining local decisions (such as de-
tection and classification results) due to manyreasons.
One of the obvious reasons is that the number and
shape of clusters depend on the clustering algorithms
that generate them as well as their parameter settings.
Another reason is that the desired number of clusters
is often unknown due to the lack of prior information
about the data set. Furthermore, the most important
reason comes from the correspondence problem of
multiple clusterings due to the fact that cluster labels
are symbolic. Since the clusters are not pre-defined,
Figure 1: Two major steps of an ensemble method.
it is possible that the same cluster label from dif-
ferent clusterings represents two distinct clusters.
For example, λ
(1)
= [1,2,2, 1,3,2,3]
T
and λ
(2)
=
[2,1,1, 3, 2,3,2]
T
represents two clusterings of a data
set with seven data points. Although the two vectors
are distinct, they actually represent the same parti-
tioning of the given data set. This is the so-called
correspondence problem and it makes the clustering
ensemble problem more difficult to solve.
As mentioned earlier, labelled data is usually
available in many applications. In order to utilize the
known labels as the guidance information, in this sec-
tion we propose a semi-supervised clustering ensem-
ble algorithm. It calculates the association between
each data point and the training clusters and relabels
the cluster labels in F according to the training clus-
ters. The fusion idea is stated as follow: (1) for a par-
ticular data point count the number of agreements be-
tween its label and the labels of training points in each
training cluster according to an individual base clus-
tering, (2) calculate the association vector between
this data point and the particular base clustering, (3)
compute the average association vector for this data
point based on all base clusterings, (4) repeat for all
data points and derive the soft consensus clustering
for all the data points using the association vectors
and (5) assign each data point its most associated clus-
ter id according to the average association vector. The
summary of the algorithm is provided in Table 1.
For a given data set, we name the subset contain-
ing training data points as X
r
and the subset contain-
ing testing points, whose labels are unknown, as X
u
.
The corresponding numbers of data points in these
two sets are denoted by N
r
and N
u
. Suppose the train-
ing data points come from K
0
categories and N
k
r
is
the number of training points from the k-th category,
i.e.,
∑
K
0
k=1
N
k
r
= N
r
. According to the j-th clustering
λ
( j)
, we compute the association vector a
( j)
i
for the
i-th unlabelled data point x
i
, where i = 1, . . . ,N
u
and
j = 1, . . . , D. Since there are K
0
training clusters, the
association vector a
( j)
i
has K
0
entries. Each entry de-
scribes the association between data point x
i
and the
corresponding training cluster. The k-th entry of the
BIOSIGNALS 2018 - 11th International Conference on Bio-inspired Systems and Signal Processing
222

Table 1: Semi-supervised clustering ensemble algorithm
(SEA).
* Input: Base clusterings F
* Output: Soft clustering λ
u
(a) According to label vector λ
r
, rearrange
base clusterings F into K
0
+ 1 sub-matrices
{F
1
r
,..., F
k
r
,... ,F
K
0
r
,F
u
}
(b) For data point x
i
, calculate the k-th element of the
association vector a
( j)
i
by
a
( j)
i
(k) =
occurrence ofF
u
(i, j) inF
k
r
(:, j)
N
k
r
and repeat for k = 1,.. . ,K
0
to form the association
vector a
( j)
i
(c) Compute the overall association vector a
i
of data
point x
i
by a
i
=
1
D
∑
D
j=1
a
( j)
i
.
(d) Compute the association level γ
i
of data point x
i
to
all training clusters by γ
i
=
∑
K
0
k=1
a
i
(k).
(e) Compute the membership information of data point
x
i
to every cluster by normalizing a
i
(f) Repeat step (b) to (d) to generatethe association level
vector γ
u
and repeat step (b) to (e) to generate the soft
clustering λ
u
(g) (Optional) Assign data point x
i
its most associated
cluster id, which corresponds to the highest entry in
the overall association vector and repeat for all i =
1,. .. ,N
u
.
association vector a
( j)
i
is calculated by the ratio of oc-
currence of F
u
(i, j) in F
k
r
(:, j) to the number of data
points in the k-th training cluster, i.e.,
a
( j)
i
(k) =
occurrence ofF
u
(i, j) inF
k
r
(:, j)
N
k
r
, (1)
where F
u
(i, j) is the cluster label of data point x
i
ac-
cording to the j-th base clustering and F
k
r
(:, j) rep-
resents the labels of all data points in the k-th train-
ing category generated by the j-th local clusterer.
For each data point x
i
, different association vectors
a
(1)
i
,...,a
(D)
i
are calculated since there are D base
clusterings generated for the given data set. In order
to fuse the information, the average association vector
a
i
for data point x
i
is computed by averaging all the
association vectors a
( j)
i
, i.e.,
a
i
=
1
D
D
∑
j=1
a
( j)
i
. (2)
Each entry of a
i
describes the consolidated associ-
ation between data point x
i
and one of the training
clusters. As a consequence, the summation of all the
entries of a
i
could be used to describe the associa-
tion between data point x
i
and all the training clusters
quantitatively. We define it as the association level of
data point x
i
to all the training clusters and denote it
as γ
i
, i.e.,
γ
i
=
K
0
∑
k=1
a
i
(k). (3)
By computing the association levels for all the data
observations, the association level vector γ
u
for the
testing set X
u
is made up by stacking all the associa-
tion levels, i.e., γ
u
= [γ
1
,γ
2
,...,γ
N
u
]
T
. The soft con-
sensus clustering of testing set X
u
is derived by nor-
malizing the association vector of each data point a
i
.
Let us denote the soft consensus clustering of test set
X
u
by a label matrix λ
u
. The i-th row of λ
u
is com-
puted by normalizing the association vector a
i
, i.e.,
λ
u
(i,:) = a
T
i
/γ
i
. (4)
If a hard consensus clustering is required, the labels
for data point x
i
can be obtained by assigning its most
associated cluster id, which corresponds to the highest
entry in the average association vector. The consensus
clustering λ
0
is obtained by repeating this step for all
i = 1,...,N
u
.
3 NEW CLUSTER DETECTION
As mentioned earlier, the lack of prior information
about the data set, such as the size, shape and number
of the clusters, is one of the reasons that makes the
clustering ensemble problem difficult to solve. Al-
though training data usually provides prior informa-
tion about the given data set, such as the size and the
shape of the clusters, since these data points can be
viewed as scatter points that clearly outline the shape
of each cluster, we may always question on whether
the amount of training clusters is enough or whether a
new cluster is necessary to describe the nature of the
given data set especially when there are new observa-
tions available.
Since the known labels of the training data points
provide information about the given data set such as
the number of the clusters, data points with unknown
labels are expected to form a set of clusters, similar
to the clusters formed by training data points in size,
shape and quantity. When additional data observa-
tions become available or the environment of making
such observations changes all the time, the prior in-
formation derived from the training data may be not
sufficient to improve the accuracy of cluster analysis.
Therefore, we propose the new cluster detection al-
gorithm in this section, which is based on comput-
ing and comparing the association levels of additional
data points to all training clusters and the association
New Cluster Detection using Semi-supervised Clustering Ensemble Method
223

levels of existing data points to all training clusters.
The objective of the proposed algorithm is to deter-
mine whether the additional data observations belong
to existing classes or a new class.
Suppose additional data observations form a set of
data points, denoted by X
a
. The summary of the new
cluster detection algorithm is listed in Table 2. The
input of the proposed algorithm is the combination of
the original data set and the additional data set, i.e.,
X = {X
r
,X
u
,X
a
}. Recall in the SEA, in order to ob-
tain the consolidated clustering, the average associa-
tion vector a
i
is calculated by averaging the associa-
tion vectors a
( j)
i
for j = 1,. . . , D, where D is the total
number of base clusterings. The association level γ
i
is
defined to evaluate the association between data point
x
i
and all the training clusters by summing all entries
of the average association vector a
i
. Intuitively,a data
point belonging to the existing classes of the training
data points should locate inside the contours outlined
by all the training points and it should highly associate
with one of the training cluster. Therefore, the associ-
ation level of this data point to all the training clusters
is relatively high. In contrast, a data point from a new
class other than the existing training classes should
locate outside from the contours outlined by all the
training points. The association levelof this data point
to all the training clusterers should be low compared
with that of a data point from existing classes. As a
consequence, we could make decisions about the cat-
egory information of the additional data sets by com-
paring the distribution of the association level of orig-
inal data points and the distribution of the associa-
tion level of the additional data points. If the distribu-
tion of the association level of the original data points
is consistent with that of the additional data points,
the additional data points are expected to come from
the existing classes. Otherwise, they are expected to
come from a new class.
In the proposed new cluster detection algorithm,
another input is the pre-defined percentage η (de-
termined by the users) and is used to determine the
threshold γ
th
for the association level, i.e., γ
th
=
max(γ
b
)∗η. Suppose the association level of the orig-
inal data points and additional data points to all the
training clusters are denoted by γ
b
and γ
a
respectively.
The sizes of testing set X
u
and additional set X
a
are
denoted by N
u
and N
a
respectively. The numbers of
original and additional data points whose association
levels are less than the threshold γ
th
are denoted by N
b
and N
new
respectively. To determine whether a new
cluster is necessary or not for the given data set, we
perform a hypothesis testing with two hypotheses:
Table 2: New Cluster Detection Algorithm.
* Input: Data set X; Percentage η
* Output: New cluster indicator i
new
(a) Apply SSEA on X
b
= {X
r
,X
u
} and obtain the asso-
ciation level vector γ
b
(b) Set the threshold γ
th
= max(γ
b
) ∗ η
(c) Count the number of original data points N
b
satisfy-
ing γ
b
< γ
th
(d) Apply SSEA on X = {X
r
,X
u
,X
a
} and obtain the as-
sociation level vector γ
a
(e) Count the number of additional data points N
new
sat-
isfying γ
a
< γ
th
(f) Set the threshold for the hypothesis testing as N
th
=
N
a
∗
N
b
N
u
and determine i
new
by
i
new
=
(
0 if N
new
< N
th
1 if N
new
≥ N
th
H
0
: No data observations come from a new class
H
1
: Some data observations come from a new class.
The threshold N
th
for the hypothesis testing is calcu-
lated by
N
th
= N
a
∗
N
b
N
u
. (5)
When N
new
< N
th
, the hypothesis H
0
is favoured and
the new cluster indicator is set to be 0. When N
new
≤
N
th
, the hypothesis H
1
is favoured and the new cluster
indicator is set to be 1.
4 NUMERICAL EXAMPLES
In this section, we provide numerical examples
to show the performance of our proposed semi-
supervised clustering ensemble algorithm and the new
cluster detection algorithm. Since the expected clus-
ter labels for each data set are available in the ex-
periments, we use micro-precision as our metric to
measure the accuracy of a clustering result with re-
spect to the expected labelling. Suppose there are k
t
classes for a given data set X containing N data points
and N
k
is the number of data points in the k-th cluster
that are correctly assigned to the corresponding class.
Corresponding class here represents the true class that
has the largest overlap with the k-cluster. The micro-
precision is defined by mp =
∑
k
t
k=1
N
k
/N (Wang et al.,
2011).
We use two types of data to evaluate the proposed
clustering ensemble method. One type of data comes
from the UCI machine learning repository website
BIOSIGNALS 2018 - 11th International Conference on Bio-inspired Systems and Signal Processing
224

(Bache and Lichman, 2013), which provides hun-
dreds of data sets for the study of classification and
clustering. In the literature, many researchers evalu-
ate their clustering algorithms and clustering ensem-
ble methods using data sets from this website (Wang
et al., 2011)(Likas et al., 2003)(Zhou and Tang,
2006)(Yan et al., 2009)(Zhang and Gu, 2014). The
other type of data comes from a biomedical labora-
tory and they are used to study human breast cancer
cells undergoing treatment of different drugs.
To evaluate our proposed algorithm, we start from
applying different clustering algorithms (K-means,
Hierarchical agglomerative and Affinity propagation)
to the UCI data sets “Ionoshpere” and “Balance” and
the biomedical laboratory data sets “3ClassesTest1”,
“4ClassesTest1” and “5ClassesTest1”. The micro-
precisions of these algorithms are listed in Table 3.
For the comparison purpose, we also list the aver-
age micro-precisions of existing clustering ensemble
methods reported in (Wang et al., 2011). We only
list the ensemble method that performs best on each
data set. We apply the clustering ensemble method
(MCLA) proposed in (Strehl and Ghosh, 2003) to the
biomedical laboratory data sets.
Suppose p% represents the ratio of the number of
training points (N
r
) to the number of testing points
(N
u
). To study the effect of the amount of train-
ing data to the semi-supervised method, we vary the
values of p from {3,5,10, 15,20,25,30}. The per-
formance of our propose semi-supervised method is
listed in Table 4. Compared with individual clus-
tering algorithms (K-means, HAC and AP), our pro-
posed algorithm outperforms on the data sets listed
in Table 3. Compared with existing ensemble meth-
ods, our proposed algorithm also outperforms these
data sets. The micro-precisions increase dramatically
when p is relatively small and become steady when
p > 15%. Therefore, due to the fact that it is expen-
sive and time-consuming to obtain labels from field
experts, there is no need to make effort on increasing
the amount of training data because the improvement
of the accuracy of the semi-supervised method is not
always increased by increasing the number of training
points.
The biomedical data sets are obtained from the
study of human breast cancer cells undergoing treat-
ment of different drugs. When a certain type of drug
is injected into cancer cells, the cells usually react
differently: a portion of the cells may slightly react
to the injected drug (such as slightly enlarged); an-
other portion of the cells may react strongly (such as
loss of nucleus); and the rest may not react to the in-
jected drug at all. For those cells that strongly react
to the injected drug, it is very likely that their statis-
tical properties vary significantly and they can form
a new cluster. Therefore, in the study of the effect
of a certain drug to cancer cells, we could apply our
proposed new cluster detection algorithm to automat-
ically detect the existence of cancer cells that strongly
react to the injected drug.
We provide numerical examples to show the per-
formance of the proposed new cluster detection algo-
rithm. The original test files contains data observa-
tions from different classes. Each original test file has
a fixed amount of training data. To evaluate the new
cluster detection algorithm, we insert additional data
points to the original test files and vary the number of
additional data points. To evaluate the probability of
successful detection of a new cluster, we insert a mix-
ture of data points from a new class and from exist-
ing classes and vary the proportion of the data points
from a new class. For each original test file and a
particular number of additional points, we randomly
generate 20 versions of additional data set X
a
using
one of the mixture proportions listed in Table 6. The
number of total successful detections of a new cluster
are provided in Table 5. As expected, the probability
of successful detection of a new cluster using the pro-
posed algorithm goes higher when the number of data
points from a new class increases.
5 CONCLUSIONS
Since clustering is a more general problem such that
no categories/clusters are pre-defined for the cluster-
ing algorithms, the fusion of multiple clusterings is
more difficult due to the so-called correspondence
problem. In this paper, we have proposed the semi-
supervised clustering ensemble algorithms to com-
bine multiple clusterings by relabelling the cluster la-
bels according to the training clusters. We presented
numerical examples to demonstrate the capability of
the proposed algorithms on improving the quality of
cluster analysis. The improvement in terms of accu-
racy of the clustering results depends on the statis-
tical properties of the data set and also depends on
the amount of available reference labels. When addi-
tional observations become available, we need to de-
termine whether the training data is sufficient for the
new observations. Therefore, we have proposed the
new cluster detection algorithm to detect the event
that new observations come from a new class other
than existing training classes. We provided numeri-
cal examples to show that the proposed algorithm is
capable to detect a new cluster when the number of
new observations, not from existing classes, is accu-
mulated to a certain level.
New Cluster Detection using Semi-supervised Clustering Ensemble Method
225

Table 3: Average micro-precisions of different clustering algorithms and existing ensemble methods.
Data Sets
No. of Clustering Algorithms Ensemble methods
Points Classes Features Kmeans HAC AP Average Method
Ionosphere 351 2 34 0.7123 0.7182 0.7107 0.7141 BCE
Balance 625 3 4 0.5221 0.5074 0.4834 0.5552 MM
3ClassesTest1 542 3 705 0.4469 0.4299 0.4871 0.4989 MCLA
4ClassesTest1 717 4 705 0.4547 0.3501 0.4923 0.4505 MCLA
5ClassesTest1 916 5 705 0.4004 0.4323 0.4116 0.3895 MCLA
Table 4: Average micro-precisions of the proposed semi-supervised clustering ensemble methods.
Data sets 3% 5% 10% 15% 20% 25% 30%
Ionoshpere 0.7586 0.8047 0.8716 0.8594 0.8662 0.8760 0.8644
Balance 0.6048 0.6251 0.6770 0.6772 0.6692 0.6849 0.6964
3ClassesTest1 0.6351 0.6123 0.6530 0.6825 0.6900 0.7032 0.6868
4ClassesTest1 0.5424 0.5547 0.5869 0.6096 0.6334 0.6150 0.6302
5ClassesTest1 0.4277 0.4205 0.4619 0.4933 0.4902 0.4815 0.4812
Table 5: Number of successful detections of a new cluster when different amount of additional data points are added to the
original data sets.
P = 15%
No. of data points No. of detections of a new cluster
Total Success
Original Added
Type 1 Type 2 Type 3 Type 4 Type 5
(/20) (/20) (/20) (/20) (/20) (/100)
2ClassesAdd1 257
50 20 17 17 12 3 83
100 20 20 17 15 1 91
150 20 20 19 15 2 92
3ClassesAdd1 518
50 20 15 12 9 2 74
100 20 18 18 8 1 83
150 20 20 19 9 3 85
Table 6: Mixing proportion of data points from a new class
and existing classes.
Mixing Proportion of data points from
Proportion A new class Existing classes
Type 1 1 0
Type 2 2/3 1/3
Type 3 1/2 1/2
Type 4 1/3 2/3
Type 5 0 1
REFERENCES
Bache, K. and Lichman, M. (2013). UCI machine learning
repository.
Ghaemi, R., Sulaiman, M. N., Ibrahim, H., and Mustapha,
N. (2009). A survey: clustering ensembles techniques.
World Academy of Science, Engineering and Technol-
ogy, 50:636–645.
Jain, A. K., Murty, M. N., and Flynn, P. J. (1999). Data
clustering: a review. ACM computing surveys (CSUR),
31(3):264–323.
Li, H. and Jeremi´c, A. (2017). Semi-supervised distributed
clustering for bioinformatics - comparison study. In
BIOSIGNALS 2017, pages 649–652.
Likas, A., Vlassis, N., and Verbeek, J. J. (2003). The global
k-means clustering algorithm. Pattern recognition,
36(2):451–461.
Strehl, A. and Ghosh, J. (2003). Cluster ensembles—
a knowledge reuse framework for combining multi-
ple partitions. The Journal of Machine Learning Re-
search, 3:583–617.
Vega-Pons, S. and Ruiz-Shulcloper, J. (2011). A survey of
clustering ensemble algorithms. International Jour-
nal of Pattern Recognition and Artificial Intelligence,
25(03):337–372.
Wang, H., Shan, H., and Banerjee, A. (2011). Bayesian
cluster ensembles. Statistical Analysis and Data Min-
ing, 4(1):54–70.
Xu, R., Wunsch, D., et al. (2005). Survey of clustering
algorithms. Neural Networks, IEEE Transactions on,
16(3):645–678.
Yan, D., Huang, L., and Jordan, M. I. (2009). Fast
approximate spectral clustering. In Proceedings of
the 15th ACM SIGKDD international conference on
Knowledge discovery and data mining, pages 907–
916. ACM.
Zhang, K. and Gu, X. (2014). An affinity propagation
clustering algorithm for mixed numeric and categor-
ical datasets. Mathematical Problems in Engineering,
2014.
Zhou, Z.-H. and Tang, W. (2006). Clusterer ensemble.
Knowledge-Based Systems, 19(1):77–83.
BIOSIGNALS 2018 - 11th International Conference on Bio-inspired Systems and Signal Processing
226
