
Quantitative Evaluation of Multi-Type Edge Bundling
Example for Japan Airmap
Ryosuke Saga
School of Knowledge and Information Systems, Osaka Prefecture University, 1-1 Gakuen-cho, Sakai, Japan
Keywords: Information Visualization, Edge Bundling, Graph Drawing, Multi-Type Graph, Quantitative Evaluation.
Abstract: This paper describes an evaluation of multi-type edge bundling methods showing for different types of edges.
Edge bundling methods such as force-directed edge bundling (FDEB) method have gained attention as one
of graph drawing methods that reduce visual clutter. Also, a multi-type edge bundling methods have been
proposed for multi-type graph that has an attached attribute to each edge. These methods are used for several
cases and evaluated qualitatively. However, there is no cases to evaluate them quantitatively. This paper
proposes one of the multi-type edge bundling methods extended from FDEB and visualizes the airline route
map in Japan. After that, this paper evaluates them to know the features of each bundling method by using
the three measures: mean edge length difference, mean occupation area, and edge density distribution.
1 INTRODUCTION
Recently, the utilization of network diagrams is a
common technique in information visualization
(Gansner et al. 1993). In utilizing network diagrams,
observers can recognize data by looking at their
relationships through connected links. The network
diagram is popular in research because of the
increasing popularity of social network services that
utilize graph data that consists of nodes and links. In
particular, the data of social network services
comprise big data. However, as the number of nodes
and links increases, graph visibility decreases due to
the formation of visual clutter that accompanies the
increases in the amount of data. This phenomenon is
becoming increasingly pervasive, especially in
today’s big data era.
The graph layout approach has been proposed to
reduce visual clutter (Mueller et al. 2006). The graph
layout approach changes attributes such as the
arrangement of elements and the type of line (line or
curve). By correctly rearranging the nodes, graph
visibility increases to a certain degree. However, this
approach cannot solve the problem encountered when
a graph contains enormous edges.
A new approach called edge bundling has been
proposed to address this issue (Holten 2006, Zhou et
al. 2008; Telea and Ersoy 2010). This method enables
observers to recognize the main stream of edges
through bundle edges based on certain rules. For
example, several methods based on the hierarchical
structure of nodes, parallel coordinates, and
mechanical models have been proposed. The
mechanical bundling method presented in previous
work has improved graph visibility by clarifying edge
bundles.
Several graphs contain multi-type edges. For
example, for an air route diagram where nodes are the
airports and the links are the air routes, the differences
in airline companies can be attributed as the types of
edges (see Figure 5 in section 4). In another example,
trend information can be expressed as different types
of edges in the FACT-Graph (Saga et al. 2012), as
shown in Figure 1. In this graph, the edge types are
categorized based on the appearance from past to
present, and different types of edges are illustrated in
the graph.
In order to support the differences in edge type for
edge bundling, Thus, previous methods do not
support the decrease in visual clutter for the multi-
type edge graph. Also there are no cases to evaluate
the edge bundling quantitatively.
In this paper, we propose new edge bundling
methods to treat multi-type edges. These methods
bundle the edges of each type. We demonstrate these
proposed methods by using Japanese airline flight
route information, where the nodes are located in
geographic information. and validate the usability of
the method. Also we evaluate edge bundling resutls
by using
Saga, R.
Quantitative Evaluation of Multi-Type Edge Bundling - Example for Japan Airmap .
DOI: 10.5220/0006638503270332
In Proceedings of the 13th International Joint Conference on Computer Vision, Imaging and Computer Graphics Theory and Applications (VISIGRAPP 2018) - Volume 3: IVAPP, pages
327-332
ISBN: 978-989-758-289-9
Copyright © 2018 by SCITEPRESS – Science and Technology Publications, Lda. All rights reserved
327
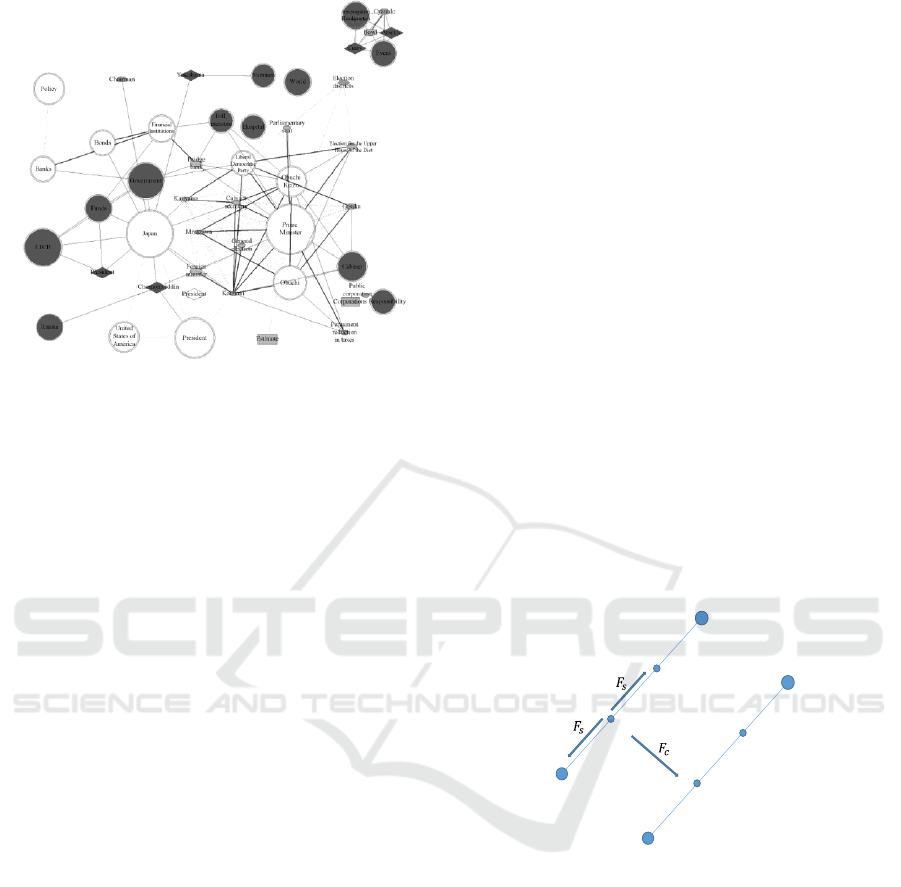
Figure 1: Example of a Multi-Type Edge Graph (From
Saga, R., Terachi, M., and Tsuji, H. (2012)) Notes. Three
edges exist in this graph: the bold line, the break line, and
the normal line. Each type of edge shows the trend
information.
2 RELATED WORKS
A network diagram is based on graph representation
in mathematics. A network consists of vertices and
edges, which also have attributes. Here, the vertex is
set as V, the edge set is E, and a network G
is shown
as G= G(). Furthermore, we call V and E the
network elements. Each vertex and each edge
has n and m attributes, that is,
,
.
The following related methods are known as
force-directed edge bundling (FDEB) and divided
edge bundling assume that n = m = 1. However, our
proposed methods are unlike the related two methods
in that our proposed methods treat m > 1.
2.1 Force-Directed Edge Bundling
Holten et al. proposed the force-directed edge
bundling method (Holten et al., 2009). This method
has been applied to undirected and single edge type
graphs. In this method, the edges are considered as a
spring with several control points and are bundled by
the spring force based on Hooke’s law and the
Columbic force as attractive force among the points.
The spring force
that works between two adjacent
control points
and
is presented as follows.
(1)
where
is the spring constant. The Columbic force
that works between two control points
in edge , and
in edge Q is presented as follows:
(2)
The Columbic force is calculated between the
same index on the other edges and the bundling
methods can reduce the computational complexity
from O(E
2
C
2
) to O(E
2
C), where E is the number of
edges and C is the number of control points.
However, when the forces are excessively strong,
the edges are likewise bundled excessively and the
node-link diagrams present incorrect relationships.
To solve this problem, Holten et al. introduced a
compatibility measure that works for the force among
the incorrect pairs of edges using the viewpoints of
length, position, angle or projection overlap (called
visibility) (see Holten et al., 2009 in detail), and
filtered them by threshold. Finally, the FDEB is
formulated as follows:
(3)
where
(P,Q) is the compatibility between P and Q.
Figure 2: Force-Directed Edge Bundling.
2.2 Divided Edge Bundling
Selassie et al. improved FDEB and proposed the
divided edge bundling method (2011). The divided
edge bundling method uses directed and single edge
type of graphs as the objects of bundling. In addition
to the spring force, Selassie et al. proposed
Coulomb’s force based on the potential where the
variable is the distance between the control points
and
. Control point
is attracted to point
,
which is the potential minimum point. As edges P and
Q approach in opposite directions,
moves to the
right of edge Q. Hence, Coulomb’s force changes
according to the current pair of edge attributions.
p
0
p
1
p
2
p
3
q
0
q
1
q
2
q
3
IVAPP 2018 - International Conference on Information Visualization Theory and Applications
328
Selassie et al. also introduced the parameter of
compatibility, which depends on the number of edges
in the minimum length path between edges P and Q.
This parameter strictly limits the bundling for graphs
with several subgraphs.
The potential minimum
and Coulomb’s force
based on the inverted Lorentzian that works at
are defined as follows
(4)
(5)
where l, , and
are the parameters,
is the vector
that defines the direction of
, is the index of the
control point (1 < < ), and is the number of
control points. Moreover, the complexity of divided
edge bundling is the same with the complexity of the
FDEB, O(E
2
C), because force computation uses the
complexity reduction trick described in the section of
FDEB
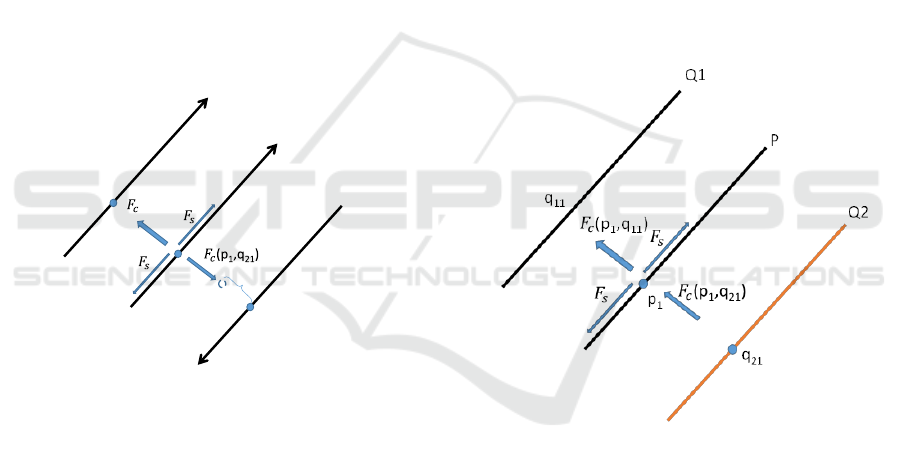
Figure 3: Divided Edge Bundling.
3 MULTI-TYPE EDGE
BUNDLING METHOD
3.1 Assumption and Principle of
Approach
In this paper, we assume that several edge types and
various common edge types exist. For example, in the
three edge types: A, B, or C, types A and B oppose
one another, whereas Type C may belong to both
types of edges (C=A B). Hooke’s law and
gravitational force work among all pairs of edges. In
addition, Coulomb’s force works between pairs of the
same attribution as an attractive force and between
pairs of different attributions as a repulsive force. The
edges are bundled by the same edge type based on
these forces. (Figure 4)
Furthermore, several pairs of edges are unsuitable
for bundling. Thus, we introduce compatibility
measures proposed in related studies to consider these
pairs. In Holten’s method, compatibility is calculated
by the angle, scale, position, and visibility of pairs. In
Selassie’s method, compatibility is measured by the
shortest path of edges, which severely limits bundling
in disjoint edges. In this paper, we introduced
Holten’s compatibility measure because graph
visibility is assumed to become clear when weights
are added to improper pairs of edges. In this case,
graph visibility becomes low when sparse parts of the
graph are forcibly bundled. Furthermore, bundling
disjoint edges in our data set is unnecessary.
Therefore, we also introduced Selassie’s
compatibility measure
In this paper, we propose two edge bundling
methods based on (1) the type compatibility approach
and (2) Lorentz Coulomb’s force approach.
Figure 4: Basic Ideas in Multi-type Edge Bundling.
3.2 Type Compatibility based Edge
Bundling
The first approach utilizes the simple idea that if two
edges P and Q are of different edge types, then P and
Q take inverse directions. To introduce this idea, we
define a new coefficient called the type compatibility
C
T
( P, Q) as follows:
(6)
The value of can be set in several ways. In this
research, we set C to 0.5. This compatibility can be
p
1
P
q
21
Q2
(p
1
,q
11
)
Q1
q
11
=m
1
m
2
lN
Quantitative Evaluation of Multi-Type Edge Bundling - Example for Japan Airmap
329

utilized together with other compatibilities for a
simple application.
3.3 Lorentzian Coulomb’s Force
Approach
This approach is based on the divided edge bundling
method. In this approach, we regard the direction of
edges as the type of edges. Hence, Coulomb’s force
is customized in our method. We defined m
j
and T
j
as
follows to represent the differences in the bundles of
each attribution more clearly.
(7)
(8)
where
is the potential minimum and
is the
direction of the force. That is, if two edges are of the
same type, then they are attracted to each other; if the
edges are of different types, then they remain far
away from each other
Handling edges as a spring is assumed to be
practical. Hence, Hooke’s law works in our method
according to Equation (1). Moreover, the customized
Coulomb’s force
is also effective.
is defined as follows:
(9)
(10)
where , , , and are the parameters,
is the
spring constant,
is the Coulombic constant, is
the number of control points, and
is the
compatibility between edges P and Q without type
compatibility. Furthermore,
p
is the value of the
current edge P with co-occurrences such as the
Jaccard coefficient and the Simpson coefficient.
Considering the idea that an important edge
should be the centre of the bundle, we adopt an edge
weight into the force via
. The total force
at
point
is as follows:
(11)
When the current pair of edges contains
attribution C, the force only behaves as a spring force.
When the pair consists of the same edge type,
Coulomb’s force works with an attractive force and
the pair is bundled tightly. When the pair consists of
different edge types, the force at work is repulsion.
4 APPLICATIONS
4.1 Dataset and Evaluation Method
We perform experiments to confirm the usability of
proposed method for real data. In this experiment, we
use airline flight route information in Japan, where
the nodes are fixed based on geographic information
in a manner different from the graph drawing
methods such as the Kamada–Kawai layout (1989).
We use airline flight route information in the year
2015 collected from the websites of All Nippon
Airways (ANA), Japan Airline (JAL), other airlines,
and Low Cost Carrier (LCC) like Peach Aviation. We
also count the number of flights for each edge and use
the normalized value of [0, 1] as edge values.
The collected route map is shown in Figure 5. In this
figure, an edge is regarded as a route between two
airports. In this route information, cyan edges are the
ANA information, magenta edges are the JAL
information, black edges represent information
shared by ANA and JAL, and yellow edges are others.
That is, the successful result shows that (1) the same
colors of edges are bundled, (2) cyan, magenta, and
yellow edges are separated, and (3) black and cyan /
magenta edges are bundled. Moreover, we run the
FDEB for comparison. As parameters, we set and
to 0.3 in Equation (9) and kc to 40000, l to 0.7, and s
to 50 in equation (8).
Figure 5: Original Airline Route Information
Tokyo
Sapporo
Osaka
Naha
Fukuoka
IVAPP 2018 - International Conference on Information Visualization Theory and Applications
330
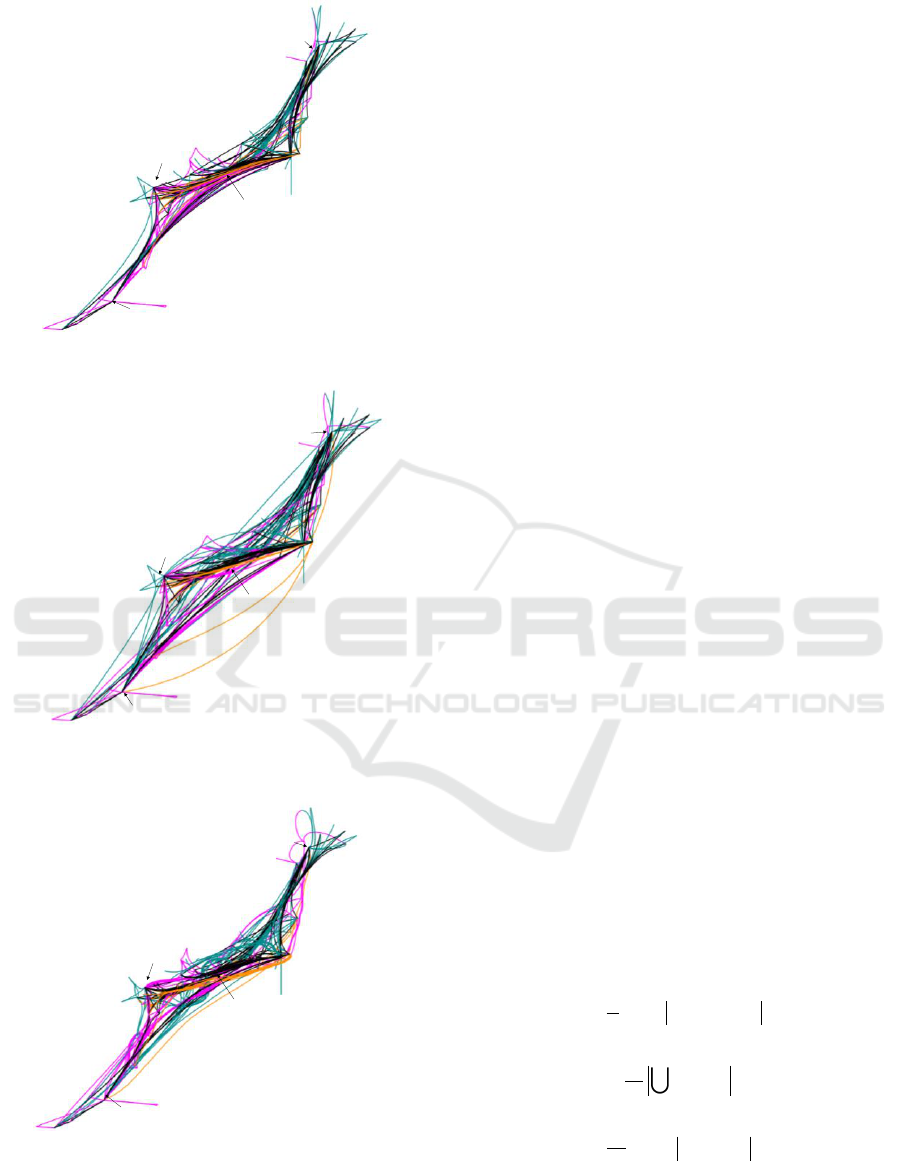
Figure 6: Result of Force-Directed Edge Bundling.
Figure 7: Result of Edge Bundling based on Type
Compatibility.
Figure 8. Result of Edge Bundling based on Inverted
Lorentzian force.
4.2 Visualization Result
Figure 6 to 8 show the results of force-directed edge
bundling and our proposed edge bundling methods.
Force-directed edge bundling can bundle these edges
but the bundling method, of course, ignore the edge
type because this method don’t consider edge type. In
Figure 7 which show the result by type compatibility,
the routes between Fukuoka and Tokyo and between
Naha to Tokyo are separated clearly differently from
Figure 6 although the same edges are close each other
and bundled. However, some edge position are
moved well, especially the edges from Naha to
Tokyo/ Osaka move to outer and expand. On the other
hand, in Figure 8 showing edge bundling by inverted
Lorentzian force, our proposed methods do bundling
among the same type edges but separate other edges.
From the results, we can understand our methods
work well for this data. However, the evaluation is
based on qualitative evaluation like “well” so that
next quantitative evaluation is performed.
4.3 Quantitative Evaluation
This evaluation uses three measures for quantitative
evaluation, mean edge length difference (MELD),
mean occupation area (MOA), and edge density
distribution (EDD) (Saga, 2016). MELD shows the
difference among the lengths before and after edge
bundling. In edge bundling, a lesser change in edge
lengths is assumed to indicate superior edge bundling
results because of over-bundling, wherein the large
change of edge length often loses the meaning of the
original network. MOA shows the degree among the
compressed areas before and after edge bundling
because better bundling can compress the area
occupied by the edges. EDD is rooted on the idea that
a better edge bundling method can gather edges
within a unit area and that the density per unit is high.
Based on these concepts, the measurements are
calculated by the following Equations (11), (12), and
(13):
Ee
eLeL
n
MELD )()('
1
(11)
1
()
eE
MOA O e
N
(12)
1
()
aA
EDD p a p
N
(13)
where n is the number of edges, L(e) is the length of
an edge e before edge bundling, and L’(e) is the length
after edge bundling in Equation (11). In Equation
Tokyo
Sapporo
Osaka
Naha
Fukuoka
Tokyo
Sapporo
Osaka
Naha
Fukuoka
Tokyo
Sapporo
Osaka
Naha
Fukuoka
Quantitative Evaluation of Multi-Type Edge Bundling - Example for Japan Airmap
331

(12), N is the number of total areas, O(e) is the set of
occupied areas by edge e over an occupation degree
(in this application, the value is 5% of unit area), and
| | shows the number of elements contained by a set.
In Equation (13), A is a set of unit areas, and p(a) is
the rate of the number of pixels, in which the edges
pass in Area a. Moreover, p is a mean of p(a).
Moreover, in Equations (12) and (13), the unit size is
set to 6, that is, each unit area is 6 pixels by 6 pixels.
Table 1 shows the result of quantitative evaluation
for each method and the original route information.
As we said, the result is regarded as better if the
MELD is low, MOA is low, and EDD is large. The
result shows that the methods based on type
compatibility and the inverted Lorentzian force are
better than the original visualization. The best one
except MELD is based on the inverted Lorentzian
force. Therefore, edge bundling based on type
compatibility shows a good average performance.
Furthermore, edge bundling based on inverted
Lorentzian force can bundle edges efficiently,
although the length of the edges will increase.
Table 1. Quantitative Evaluation Result.
Measurement
Original
TC
ILF
MELD
n/a
2.329
7.621
MOA
0.200
0.208
0.181
EDD
0.091
0.091
0.096
Notes. TC: Edge Bundling based on Type Compatibility (Figure 7),
ILF: Edge Bundling based on Inverted Lorentzian Force (Figure 8).
MELD is calculated before and after edge bundling the images, that
is, only the original image may not be calculated.
5 CONCLUSIONS
In this paper, we presented a multi-type of edge
bundling as an extension of FDEB and divided edge
bundling. We utilized two approaches, the type-
compatibility and the Lorentzian Coulomb’s force, to
separate edges of different types. Applying the
methods to airline route information validated the
usability and superiority of our proposed methods
through quantitative evaluation.
For future research, we must improve the visual
encoding, interaction, and joint node/edge layout.
Furthermore, if we will use big data, we must
consider improving the complexity, as the complexity
of our proposed methods is O(E
2
C). Also, in this
evaluation, just thinking about the three
measurements. However, we have to consider clarity
to understand the bundling at ease. So we develop
these points as future works.
REFERENCES
Ward, M., Grinstein, G., Keim, D., 2010. Interactive data
visualization. A. K. Peters / CRC Press.
Herman, I., Melançon, G., Marshall, M. S., 2000. Graph
Visualization and Navigation in Information
Visualization: a Survey. In IEEE Transactions on
Visualization and Computer Graphics, 6, 24-43. doi:
10.1109/2945.841119.
Gansner, E. R., Koutsofios, E. S., North, C., Vo, K. P.,
1993. A technique for drawing directed graphs. In IEEE
Transactions on Software Engineering. 19, 214-230.
doi: 10.1109/32.221135.
Mueller, C., Gregor, D., Lumsdaine A., 2006. Distributed
force-directed graph layout and visualization. In
Proceedings of the 6th Eurographics Conference on
Parallel Graphics and Visualization, 6, 83-90. doi:
10.2312/EGPGV/EGPGV06/083-090.
Holten, D., 2006. Hierarchical edge bundles: visualization
of adjacency relations in hierarchical data. In IEEE
Transactions on Visualization and Computer Graphics.
12, 1077-2626. doi: 10.1109/TVCG.2006.147.
Zhou, H., Yuan, X., Qu, H., Cui, W., Chen, B., 2008.
Visual Clustering in Parallel Coordinates. Computer
Graphics Forum. 27, 1047-1054. doi: 10.1111/j.1467-
8659.2008.01241.x.
Telea, A., Ersoy, O., 2010. Image-based edge bundles:
simplified visualization of large graphs, In EuroVis'10
Proceedings of the 12th Eurographics / IEEE - VGTC
conference on Visualization, 843-852.
Saga, R., Terachi, M., Tsuji, H. (2012). FACT-Graph:
Trend Visualization by Frequency and Co-occurrence.
Electronics and Communications in Japan, 95. 50-58.
doi: 10.1002/ecj.10347.
Holten, D., Wijk, J. J. V., 2009. Force-directed edge
bundling for graph visualization. In Computer Graphics
Forum, 28. 983-990. doi: 10.1111/j.1467-
8659.2009.01450.x.
Selassie, D., Heller, B., Heer, J., 2011. Divided edge
bundling for directional network data. In IEEE
Transaction Visualization and Computer Graphics. 17.
2354-2363. doi: 10.1109/TVCG.2011.190.
Kamada, T., Kawai, S., 1989. An algorithm for drawing
general undirected graphs. In Information Processing
Letters, 31. 7-15. doi: 10.1016/0020-0190(89)90102-6.
Saga, R., 2016. Quantitative evaluation for edge bundling
based on structural aesthetics, In Eurovis 2016,
doi:10.2312/eurp.20161131.
IVAPP 2018 - International Conference on Information Visualization Theory and Applications
332
