
Identifying Characteristic Physiological Patterns of Parkinson's
Disease Sufferers using Sample Entropy of Pulse Waves
Mayumi Oyama-Higa
1
, Tokihiko Niwa
2
, Wenbiao Wang
3
and Yoshifumi Kawanabe
4
1
Chaos Technology Research Laboratory, 5-26-5 Seta, Otsu, Shiga 520-2134, Japan
2
Kwansei Gakuin Senior High School, 1-155 Uegahara Ichibancho, Nishinomiya, Hyogo 662-0891, Japan
3
PricewaterhouseCoopers Aarata LLC, 1-1-1 Otemachi, Chiyoda-ku, Tokyo 100-0004, Japan
4
Shizuoka General Hospital, 4-27-1 Kita Ando, Aoi-ku, Shizuoka, Shizuoka 420-8527, Japan
Keywords: Parkinson’s Disease, Sample Entropy, Border of Parkinson Entropy (BPE), Largest Lyapunov Exponent
(LLE), Android Tablet for Real-Time Health Check.
Abstract: In this study, we identify characteristic physiological patterns of Parkinson’s disease patients, through
analysis of the data of their pulse waves. We find that the sample entropy values of pulse waves, with
certain parameters fix (In this case, we define the sample entropy value as “border of Parkinson entropy”, or
BPE), is statistically different between Parkinson’s disease sufferers and healthy individuals. In addition,
values of the largest Lyapunov exponent computed from the same data are also analysed, and significant
difference between the two groups are observed. At the end, we describe an Android tablet that we
developed for real-time measurement and analysis of BPE.
1 INTRODUCTION
With the aging of Japan’s population advancing,
incidence of various aging-related diseases is
becoming increasingly frequent. Parkinson’s disease
is one of them (Yamawaki et al., 2009). Studies have
shown that symptoms of neurological and mental
disorders are common in Parkinson’s disease, such
as depression (Lemke et al., 2004), dementia (Emre,
2004) and autonomic nerve system dysfunction
(Zesiewicz et al., 2003).
Meanwhile, in our recent studies, we have
discovered indicators – the largest Lyapunov
exponent (LLE) and the autonomic nerve balance
(ANB), both computed from pulse wave data – for
identifying mental status changes (Oyama-Higa et
al., 2008; Wang et al., 2012) and mental disorders,
including dementia (Oyama-Higa and Miao, 2006;
Oyama-Higa et al., 2008; Pham et al., 2015) and
depression (Oyama-Higa et al., 2008; Hu et al.,
2011; Pham et al., 2013). A comprehensive
explanation can be found in Oyama’s 2012 book.
Inspired by the relevance of Parkinson’s disease
to mental disorders and the effectiveness of the pulse
wave analysis in detecting mental disorders, we have
made an attempt to observe if any characteristic
patterns of Parkinson’s disease sufferers exist in
their pulse waves.
This study has succeeded in discovering such
characteristic patterns, by comparing the sample
entropy computed from the pulse wave data. More
precisely, what we applied is the sample entropy
with two parameters – the length of subsequences of
the data sequence and the tolerance – set to certain
fixed values. We define this indicator as “border of
Parkinson Entropy (BPE)”. Besides, in addition to
BPE, statistically significant difference is also in the
LLE values from the same pulse wave data.
Furthermore, we have incorporated the function
of BPE computation and result display into “Alys”,
an application installed on an Android tablet that we
developed for real-time mental health check-up
(Oyama-Higa et al., 2016). With “Alys”, not only
status of mental health, but also risk of Parkinson’s
disease can be checked in a convenient and
economical way.
2 COMPUTATIONAL METHODS
In this study, we mainly propose two indicators – the
border of Parkinson entropy (BPE) and the largest
Oyama-Higa, M., Niwa, T., Wang, W. and Kawanabe, Y.
Identifying Characteristic Physiological Patterns of Parkinson’s Disease Sufferers using Sample Entropy of Pulse Waves.
DOI: 10.5220/0006627801890196
In Proceedings of the 11th International Joint Conference on Biomedical Engineering Systems and Technologies (BIOSTEC 2018) - Volume 5: HEALTHINF, pages 189-196
ISBN: 978-989-758-281-3
Copyright © 2018 by SCITEPRESS – Science and Technology Publications, Lda. All rights reserved
189
Lyapunov exponent (LLE). We will start with the
introduction of sample entropy.
2.1 Sample Entropy
As a conventional method for studying the
complexity in biological time series, the sample
entropy is defined as the reciprocal of the natural
logarithm of the conditional probability that two
sequences that are similar for certain points within a
given tolerance still remain similar when one
consecutive point is included (Richman and
Moorman, 2000).
To begin with, given a time-series sequence
{x (1), …, x (N)},
(1)
its subsequence with a length of m can form a vector
X
m
(i) = ( x(i), x(i+1), …, x(i+m-1) )
(2)
and, in the same fashion, an (m+1) subsequence can
be denoted as
X
m+1
(i) = (x(i), x(i+1), …, x(i+m) ).
(3)
Here, the range of i is from 1 to N-m so that both (2)
and (3) are well-defined.
Next, the distance between two m-long
subsequences X
m
(i) and X
m
(j) is defined as
. (4)
For a given X
m
(i), its r-neighbourhood is
.
(5)
Let
denote the probability that another
subsequence is in its r-neighbourhood. Thus,
.
(6)
Note that when counting the number of such
subsequences in the numerator of (6), since X
m
(i)
itself should be excluded, there are a total of N-m-1
candidates. Hence the denominator N-m-1.
Regarding X
m+1
(i), we use a different notation
to denote the probability that another (m+1)-
long subsequence is in its r-neighbourhood:
.
(7)
For the whole time-series sequence (1), the
probability corresponding to (6) or (7) can be given
as an average taken over all subsequences, from i =1
to i =N-m, as follows.
(8)
(9)
The sample entropy with tolerance r for m-long
subsequences of an N-point time-series sequence is
therefore computed by the following formula.
(10)
In our recent studies on the indication of mental
health from pulse waves, the device “Lyspect”
(developed by Chaos Technology Research
Laboratory) has been frequently applied (Oyama-
Higa et al., 2012). We have upgraded the device to
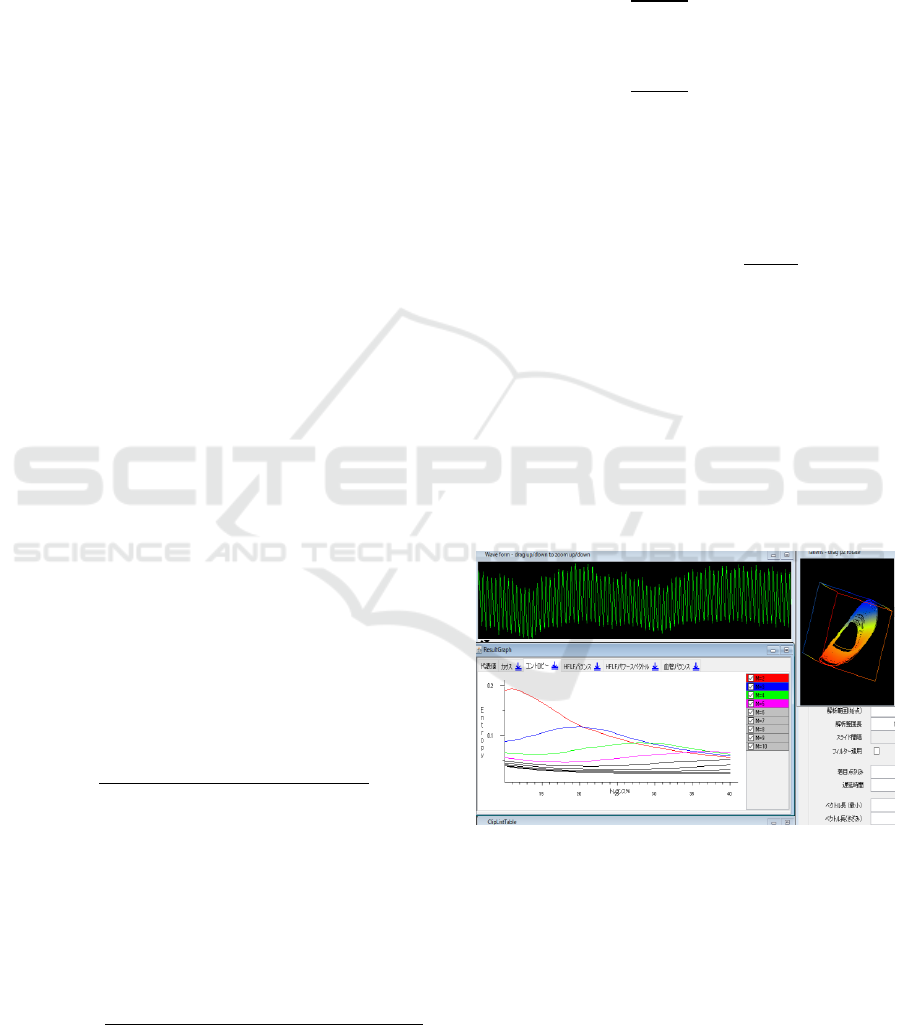
make the computation of sample entropy possible.
The following shows the value of sample entropy
(vertical axis) as a function of the tolerance r
(horizontal axis), with the length of subsequence m
fixed. A total 9 graphs are displayed, for m =2 to 10.
Figure 1: Display of sample entropy with “Lyspect”.
2.2 Border of Parkinson Entropy
We define the border of Parkinson entropy (BPE) as
the sample entropy with m=2 and r=10%, namely,
.
(11)
(The length of the time series sequence, N, is
dropped for convenience.) These two parameters
HEALTHINF 2018 - 11th International Conference on Health Informatics
190

were decided this way after trials and errors in
search for an ideal indicator that shows statistically
significant difference between Parkinson’s disease
sufferers and healthy individuals, as will be
explained in Section 4.1.
As mentioned at the end of Section 1, we have
imbedded the function of BPE computation in our
device “Alys”. A normalized result display is
applied with a semi-circular graph, in consistency
with the display of largest Lyapunov exponent and
autonomic nerve balance. We will introduce this
new performance in Section 5.
2.3 Largest Lyapunov Exponent
The mathematical definition and computation of the
largest Lyapunov exponent (LLE) is elaborated in
almost each of our papers on the indication of
mental health from pulse waves (for the most
updated work, refer to Oyama-Higa et al., 2016 and
Oyama-Higa et al., 2017). In this article, since we
mainly study the BPE, a detailed explanation on the
definition of LLE is omitted.
In our devices “Lyspect” (Oyama-Higa et al.,
2012) and “Alys” (Oyama-Higa et al., 2016), the
value of LLE is normalized to a range of 0-10 in the
result display. Our previous studies have shown that
the values of LLE of a mentally healthy individual
fluctuate from 2 to 7, centred at 5. When LLE is
abnormally high, the mental immunity of the
individual is so strong that he or she is likely to go to
extremes: such individual can be easily irritated and
take unexpected actions. On the other hand, when it
is abnormally low, the mental immunity is so weak
that the individual is prone to mental illnesses. In
other words, a high LLE indicates a mental status of
adapting to the external environment (we simply
called it “external adaptation” in some of our
previous articles), while a low LLE indicates a status
of “internal focusing”.
2.4 Autonomic Nerve Balance
The autonomic nerve balance (ANB) is another
important indicator in our recent studies (Oyama-
Higa et al., 2016 and Oyama-Higa et al., 2017). The
detailed explanation is omitted here. In our devices,
like LLE, we apply a 0-10 valued graph to display
the result of ANB. ANB < 5 indicates predominance
of parasympathetic nerve while ANB > 5 indicates
sympathetic predominance.
3 EXPERIMENT
3.1 Devices
As usual in our recent studies, we apply an infrared
sensor (UBIX Corporation) to take in pulse waves
from the subjects, and “Lyspect” (Chaos Technology
Research Laboratory) to analyse the data.
The pulse waves are taken in as 200 Hz analogue
data, saved as text file, and then input to “Lyspect”
for analysis. To reduce noise from the external
environment (such as the power supply), the fast
Fourier transform is applied in order that only data
with frequency less than 30 Hz (It has been shown
by additional trials that 8 Hz will suffice to produce
the same analytical results) is to be analysed.
3.2 Subjects
Two groups of subjects, the Parkinson’s disease
patients and healthy individuals, are studied.
The former group consists of 45 patients
diagnosed as Parkinson’s disease, aged from 40 to
65. The latter group consists of 113 healthy
university students, aged from 19 to 20.
3.3 Process of Measurement
Informed consent was obtained from all subjects in
the measurement.
For each subject, a 2-minute measurement was
performed for 2 to 3 times in a relaxed condition at
room temperature (25 ℃) and the average result of
measurement was used for analyse. Specifically, for
the healthy students, it was sufficient to take 2 times
because their results were stable, while for each of
the Parkinson’s disease sufferers, measurement was
performed 3 times at intervals.
For a part of the Parkinson’s disease sufferers, in
order to reduce measurement errors due to tremor, a
common symptom of the disease, the sensor was
attached to the subject’s earlobe instead of fingertip.
4 ANALYSIS AND RESULT
4.1 Comparison of Sample Entropy
As introduced at the end of Section 2.1, “Lyspect”
can display the sample entropy values SampEn (m,
r) as a function of r, for different m’s. We observed
that as m increases, the range of SampEn (m, r) tends
to concentrate and less sensitive to r, so we decided
Identifying Characteristic Physiological Patterns of Parkinson’s Disease Sufferers using Sample Entropy of Pulse Waves
191
to apply m=2. In the following, SampEn (2, r) is
compared between the two groups.
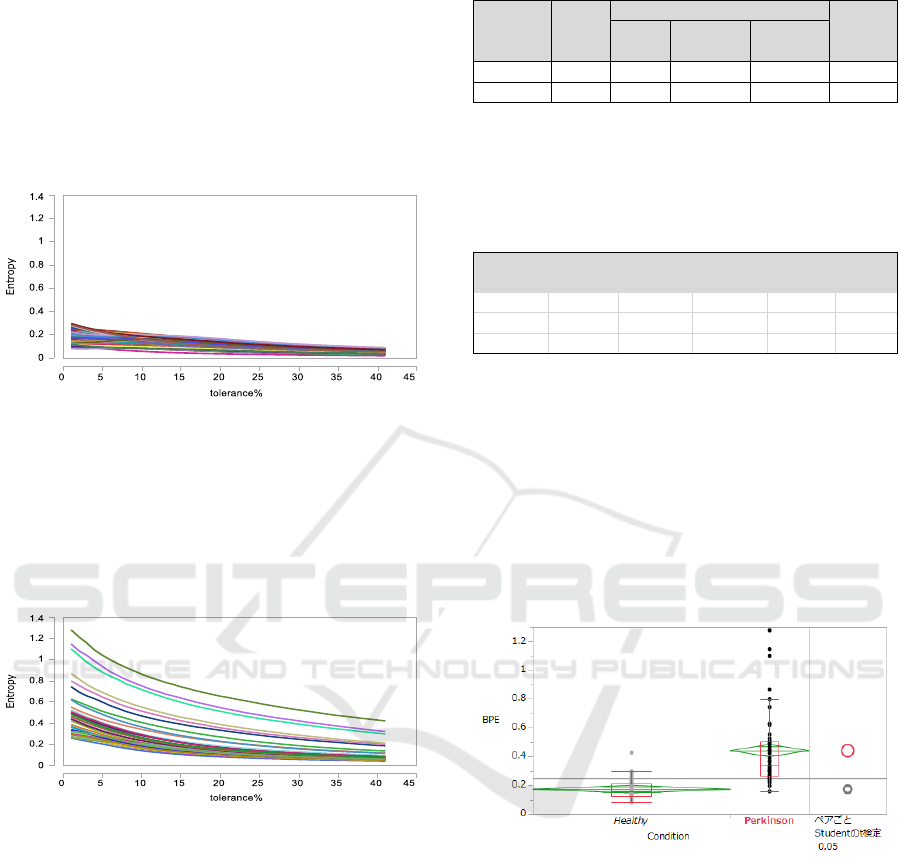
The following graph shows SampEn (2, r) for the
group of 113 healthy individuals. We observe that
when the tolerance r changes from a small value
over 0 to a little more than 40%, the sample entropy
value with m=2 monotonically decreases and the
range of SampEn (2, r) is bounded in (0, 0.4) for
each subject of this group.
Figure 2: Graph of SampEn (2, r) for healthy individuals.
Similarly, SampEn (2, r) for the group of
Parkinson’s disease suffers is shown in the following
graph. The tolerance changes in the same way as the
above. SampEn (2, r) is monotonically decreasing,
but the range of SampEn (2, r) is remarkably wider
than the healthy individuals’ group.
Figure 3: Graph of SampEn (2, r) for Parkinson’s sufferers.
In hopes of finding an ideal indicator to
distinguish Parkinson’s disease sufferers from
healthy individuals, based on the data from our
measurement, we have performed analysis of
variance (ANOVA) for various r’s. Consequently,
we found that when r = 10%, the result of ANOVA
shows highly statistically significant difference in
SampEn (2, 10%) between Parkinson’s disease
sufferers and healthy individuals. The basic
information of SampEn (2, 10%) values for the
analysis are given in the following table.
Table 1: SampEn (2, 10%) data information.
The ANOVA for the difference in SampEn (2, 10%)
between the two groups produces the following
result.
Table 2: ANOVA for the difference in SampEn (2, 10%).
Since the p value is less than 0.0001, the SampEn (2,
10%) values between the two groups are statistically
different at 0.01% significance level, or at 99.99%
confidence level. This is why we call SampEn (2,
10%) border of Parkinson’s entropy, or BPE. The
distribution of BPE values for the two groups can
also be compared in the following figure. One can
obviously observe that the Parkinson’s disease
sufferers exhibit a significantly higher BPE than the
healthy students.
Figure 4: Comparison of distribution of BPE values.
4.2 Sample Entropy and Progression of
Parkinson's Disease
Another observation made is that the sample entropy
value tends to increase as the Parkinson’s disease
sufferer deteriorates.
The following shows the status of SampEn (2, r)
for a same Parkinson’s disease sufferer on two
different dates of measurement. On July 31, 2016,
there was no particular problem reported, but after 3
months, on November 1, 2016, the patient reported
difficulty to move and occurrence of drooling, which
interfered the patient’s daily life. We clearly observe
T o ta l
w /o the
largest 5%
w /o the
sm a llest 5 %
H ealthy 113 0.17267 0.14588 0.1 9 9 4 5 0 .0 1 356
Parkinson 's 45 0.44105 0.39861 0.4 8 3 5 0 0 .0 2 1 4 9
M ean
G roup
N um b e r
of D ata
Points
S ta n d ard
D eviation
S ource
D egree of
Freedom
S um of
S quare s
M ea n S um
of S q u a res
F sta tistic p value
R egre ssion 1 2.3 1 8 1 5 0 5 2.31815 111.5 6 8 5 < .0 0 0 1 *
R esidual 156 3.2413411 0.02078
T ota l 157 5.5594916
HEALTHINF 2018 - 11th International Conference on Health Informatics
192
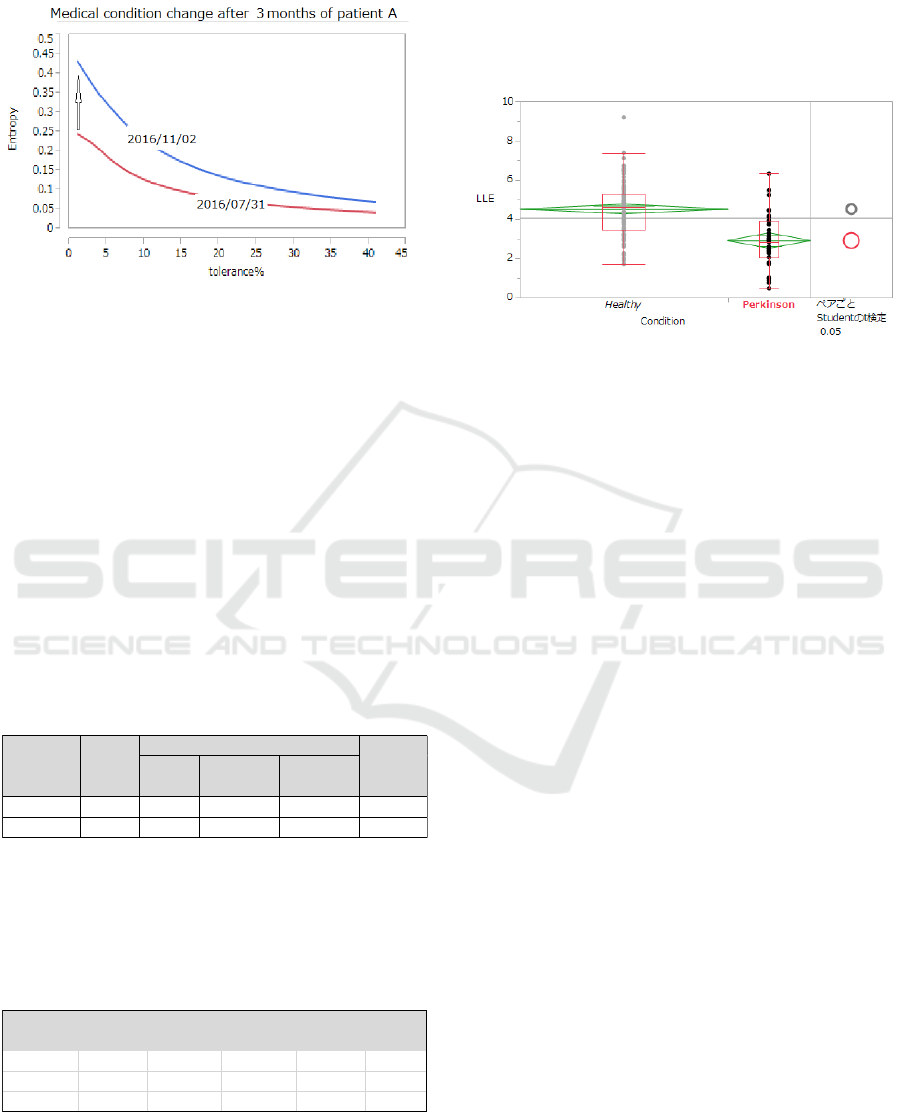
that for each tolerance r, SampEn (2, r) on the latter
date is higher than that on the former date.
Figure 5: Graph of SampEn (2, r) for a Parkinson’s
sufferer in different condition of disease progression.
Therefore, for a same patient, BPE may be a
potential indicator for checking the progression of
Parkinson’s disease. Doctors may refer to the BPE
value when they conduct medical examination by
interview.
4.3 Comparison of LLE and ANB
Since LLE has played a leading role in our studies
on the indication of mental health from pulse waves,
LLE values computed by “Lyspect” between the two
groups are also compared and analysed.
The basic information of LLE values for the
analysis are given in the following table.
Table 3: LLE data information.
Recall from Section 2.3 that the LLE value is
normalized to range from 0 to 10. Next, the result of
ANOVA for the difference in LLE between the two
groups is stated in the following table.
Table 4: ANOVA for the difference in LLE.
Since the p value is less than 0.0001, the LLE values
between the two groups are statistically different at
0.01% significance level, or at 99.99% confidence
level. The following figure compares the distribution
of LLE values between the two groups. Obviously,
the LLE of the group of Parkinson’s disease patients
is significantly lower than that of the healthy
individuals’ group.
Figure 6: Comparison of distribution of LLE values.
The above result is consistent with the fact that
depression is a common symptom of Parkinson’s
disease (Lemke et al., 2004) and the result we have
obtained in our recent studies that a low LLE
indicates weakness in mental immunity which leads
to depression (Oyama, 2012).
In addition, we have also looked over ANB
computed from the same data. Like in BPE and LLE,
we have obtained statistically significant difference
in the ANB values between the two groups.
However, since medicine that the patients are taking
can affect the nervous system and thus influence the
result of ANB, we withhold further analysis.
4.4 Discriminant Analysis of BPE
As presented in Section 4.1, the BPE can provide as
an indicator for identifying Parkinson’s disease
sufferers. Next, discriminant analysis is carried out,
with the help of statistical software, in order to
determine critical values of BPE to distinguish
Parkinson’s disease sufferers from healthy
individuals. The process and result of the
discriminant analysis are shown below.
T o ta l
w /o the
la rgest 5%
w /o the
sm a llest 5 %
H ealthy 113 4 .5 2 0 2 4 4.27080 4.76970 0.12627
Parkin son 's 45 2.91475 2.51950 3.3 1 0 0 0 0 .20 0 0 9
G roup
N um b e r
of D ata
Poin ts
M ean
S ta n d ard
D eviation
S ource
D egree of
Freedom
S um of
S quare s
M ea n S um
of S q u a res
F sta tistic p value
R egre ssion 1 82.95642 82 .9 5 6 4 46.0469 < .0001*
R esidual 156 281.04406 1.8016
T ota l 157 364.00048
Identifying Characteristic Physiological Patterns of Parkinson’s Disease Sufferers using Sample Entropy of Pulse Waves
193
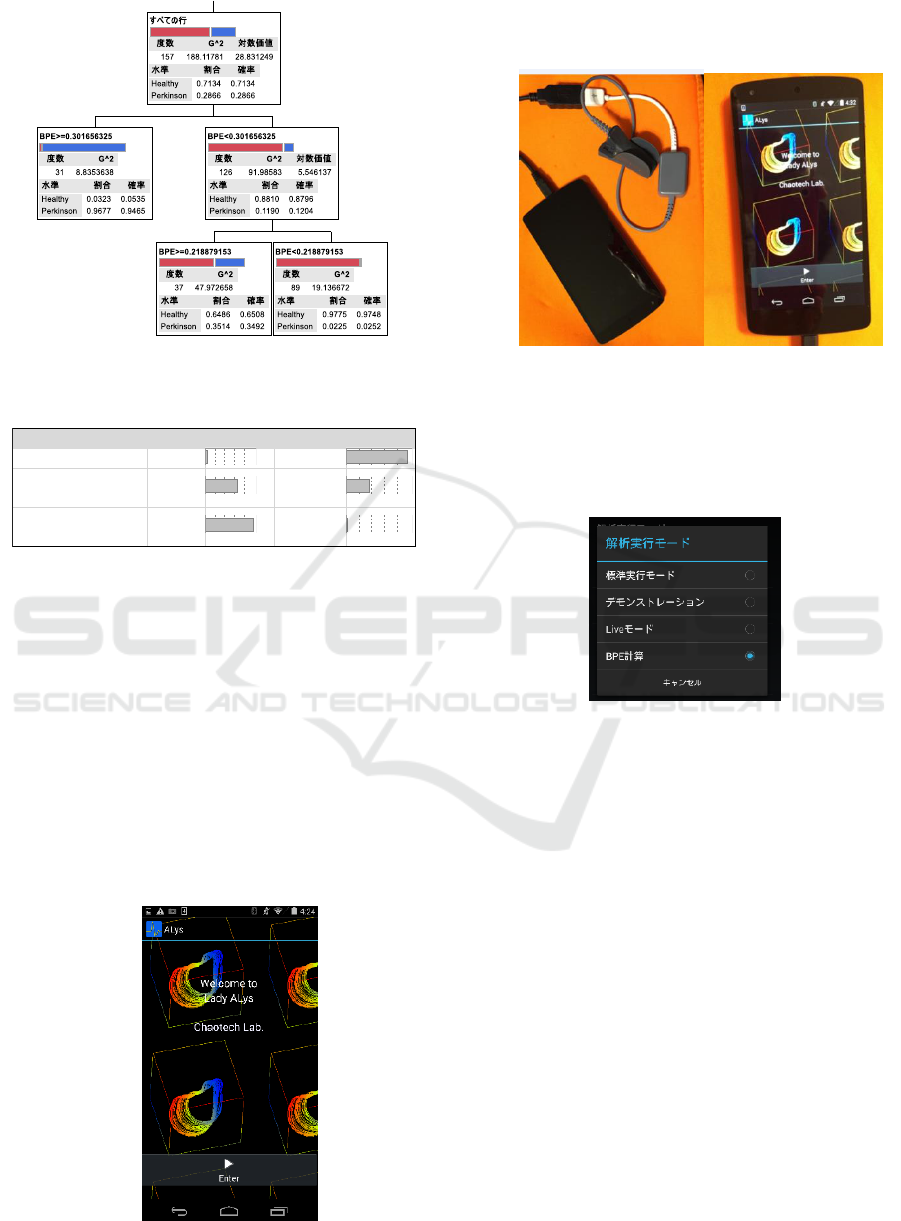
Figure 7: Process of discriminant analysis of BPE.
Table 5: Result of discriminant analysis of BPE.
From the result, we conclude that our pulse wave
data infer that if BPE ≥ 0.3017, the probability of
suffering Parkinson’s disease is 94.65%, and if BPE
< 0.2189, the probability of not suffering
Parkinson’s disease is 97.48%.
5 CHECKING BPE WITH “ALYS”
In this section, we introduce our upgraded version of
“Alys”, with which the analysis and result display of
BPE have become possible. We explain the
procedure of visualizing BPE with “Alys”.
1. Start “Alys”.
Figure 8: The welcoming window of “Alys”.
2. Connect the sensor to the tablet through a
USB connector.
Figure 9: Connection of the sensor and the tablet.
3. Click the tool mark on the upper right, select
“Set Properties” and then select “Compute
BPE” from the “Execution of Analysis
Mode”
Figure 10: Option list of“Execution of Analysis Mode”.
We may observe that the “Compute BPE” option
is at the bottom of the option list of “Execution of
Analysis Mode”, as it is a newly added function.
4. Back to the “Set Properties” menu, set the
measurement time (in second) and
determine the critical value of BPE that is to
be normalised to 5.0 in the result display.
When this setting is done once, it will be
saved so users need not set each time.
B PE range
B PE> = 0.30 1 6 5 6 3 25 5.35% 94.65 %
B PE< 0.301656325 &
B PE> = 0.21 8 8 7 9 1 53
65.08 % 3 4 .9 2 %
B PE< 0.301656325 &
B PE< 0.218879153
97.48 % 2.52%
R atio (H e a lthy)
R atio (Pa rkison's)
HEALTHINF 2018 - 11th International Conference on Health Informatics
194
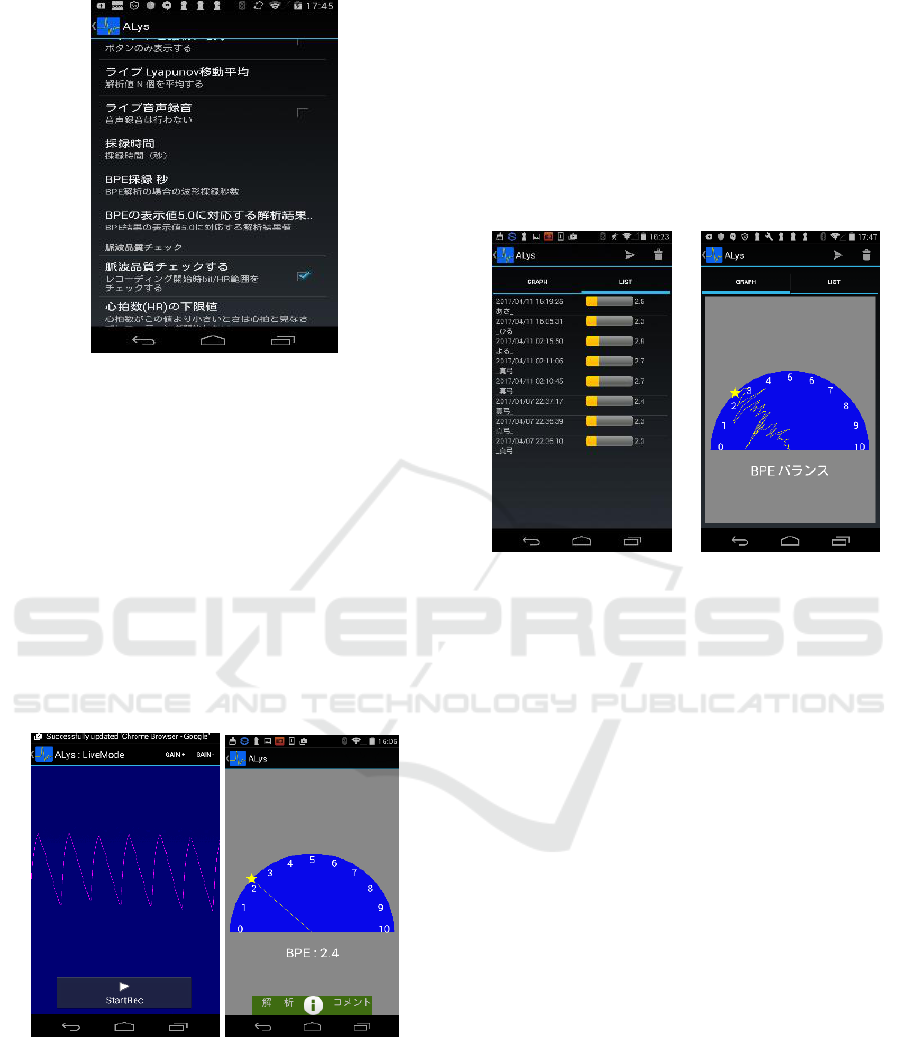
Figure 11: Option list of“Set Properties”.
We have improved the system so that analytical
result of BPE can be obtained with as short as 5
seconds of measurement.
Concerning the critical value of BPE, from the
result of discriminant analysis in Section 4.4, we
may use 0.31 (slightly higher than 0.3017) as the
critical value corresponding to 5.0, the central value
of the normalized BPE.
5. Start to take the pulse from a fingertip.
When the measurement time set in the previous
step has elapsed, the measurement will end and a
semi-circular graph will be displayed.
Figure 12: (Left) Display of waveform during a
measurement; (Right) Graph for normalized BPE.
The BPE is normalized to range from 0 to 10,
centred at 5.0, which corresponds to the critical BPE
value set at the previous step. From the above figure
we observe that the subject’s normalized BPE is 2.4,
which is less than 5.0, so this subject may not be a
Parkinson’s disease sufferer.
6. Other options.
Users may view their records of BPE values
taken in the past in both “List Mode” and “Graph
Mode”. The former makes a list of all recent records,
while the latter displays all results on the same semi-
circular graph.
Figure 13: Display of past records in “List Mode” (left)
and “Graph Mode” (right).
Moreover, the data saved in the tablet can be
sent through email.
6 CONCLUSION AND REMARK
In this study, we have proposed a new indicator, the
border of Parkinson’s entropy (BPE), for identifying
Parkinson’s disease sufferers. We have collected a
considerable number of pulse wave data, computed
the BPE values with our system, and performed
statistical analysis to obtain persuasive result. We
conclude that the BPE can provide as a potentially
effective indicator of Parkinson’s disease. However,
since this indicator is newly proposed, there is still
room for improvement regarding the parameters of
the sample entropy. We will strive to collect and
analyse more data in the future.
As to the upgraded “Alys”, since 5 seconds will
suffice to produce analytical result, we believe it can
enable users to conduct self-check in a convenient
and economical way, without time and space
limitation. We are now improving the tablet to make
its size smaller. We hope that “Alys” can contribute
to promoting better medical care.
Identifying Characteristic Physiological Patterns of Parkinson’s Disease Sufferers using Sample Entropy of Pulse Waves
195

REFERENCES
Emre, M. (2004) ‘Dementia in Parkinson's disease: cause
and treatment’, Current Opinion in Neurology, vol.
17(4), pp. 399-404.
Hu, Y., Wang, W., Suzuki, T. and Oyama-Higa, M. (2011)
‘Characteristic extraction of mental disease patients by
nonlinear analysis of plethysmograms’, AIP Conf.
Proc., vol. 1371, pp. 92-101.
Lemke, M.R., Fuchs, G., Gemende, I., Herting, B.,
Oehlwein, C., Reichmann, H., Rieke, J. and Volkmann
J. (2004) ‘Depression and Parkinson's disease’,
Journal of Neurology, vol. 251 (6 Supplement), pp.
vi24-vi27.
Oyama, M. (2012) Psychology of mental flexibility
(English edition, Kindle), Seattle: Amazon Services
International, Inc.
Oyama-Higa, M. and Miao, T. (2006) ‘Discovery and
application of new index for cognitive psychology’,
2006 IEEE Conf. on Systems, Man, and Cybernetics
Proc., vol. 4, pp. 2040–2044.
Oyama-Higa, M., Miao, T., Kaizu, S. and Kojima, J.
(2012) ‘Mental health self-check system using
“Lyspect” ’, Proc. of the Sixth International
Symposium on e-Health Services and Technologies,
Sixth International Symposium on e-Health Services
and Technologies (EHST 2012), Geneva, pp.9-18.
Oyama-Higa, M., Miao, T., Tsujino, J. and Imanishi, A.
(2008) ‘Possibility of mental health self-checks using
divergence of pulse waves’, Proc. of the First
International Conference on Biomedical Electronics
and Devices, BIOSIGNALS 2008, Funchal, pp. 361-
370.
Oyama-Higa, M., Niwa, T., Pham, T.D., Tsujino, J.,
Imanishi, A. and Wang, W. (2017) ‘Mental Health
Indicator Derived from Fingertip Pulse Waves and its
Application’, in Chapter 4 Section 3 of The Forefront
of Biological Data Application – Measurement and
Application of Bio-information using Smart Sensing
(in Japanese), Tokyo: Science & Technology Co., Ltd.
Oyama-Higa, M., Wang, W., Kaizu, S., Futaba, T. and
Suzuki, T. (2016) ‘Smartphone-Based Device for
Checking Mental Status in Real Time’, Proceedings of
the 9th International Joint Conference on Biomedical
Engineering Systems and Technologies, vol. 4
(BIOSIGNALS), pp. 207-214.
Pham, T.D., Oyama-Higa, M., Truong, C.T., Okamoto, K.,
Futaba, T., Kanemoto, S., Sugiyama, M. and Lampe, L.
(2015) ‘Computerized assessment of communication
for cognitive stimulation for people with cognitive
decline using spectral-distortion measures and
phylogenetic inference’, PLos One, vol. 10(3),
e0118739.
Pham, T.D., Thang, T.C., Oyama-Higa, M., Nguyen, H.X.,
Saji, H. and Sugiyama, M. (2013) ‘Chaos and
nonlinear time-series analysis of finger pulse waves
for depression detection’, Proc. of the International
Conference on Bio-inspired Systems and Signal
Processing, BIOSIGNALS 2013, Barcelona, pp. 298-
301.
Richman, J.S. and Moorman, J.R. (2000) ‘Physiological
time-series analysis using approximate entropy and
sample entropy’, American Journal of Physiology -
Heart and Circulatory Physiology, vol. 278(6), pp.
H2039-49.
Wang, W., Hu, Y., Oyama-Higa, M., Suzuki, T., Miao, T.
and Kojima, J. (2012) ‘Analysis of
electroencephalogram and pulse waves during music
listening’, Proc. of the Sixth International Symposium
on e-Health Services and Technologies, Sixth
International Symposium on e-Health Services and
Technologies (EHST 2012), Geneva, pp. 31-35.
Yamawaki, M., Kusumi, M., Kowa, H. and Nakashima, K.
(2009) ‘Changes in prevalence and incidence of
Parkinson's disease in Japan during a quarter of a
century’, Neuroepidemiology, vol. 32(4), pp. 263-269.
Zesiewicz, T.A., Baker, M.J., Wahba, M. and Hauser, R.A.
(2003) ‘Autonomic Nervous System Dysfunction in
Parkinson's Disease’, Current Treatment Options in
Neurology, vol. 5(2), pp. 149-160.
HEALTHINF 2018 - 11th International Conference on Health Informatics
196
