
DETCIC: Detection of Elongated Touching Cells with Inhomogeneous
Illumination using a Stack of Conditional Random Fields
A. Memariani
1
, C. Nikou
1,2
, B. T. Endres
3
, E. Bass
`
eres
3
, K. W. Garey
3
and I. A. Kakadiaris
1
1
Computational Biomedicine Lab, Department of Computer Science, University of Houston, Houston, TX, U.S.A.
2
Department of Computer Science and Engineering, University of Ioannina, Greece
3
Department of Pharmacy Practice and Translational Research, University of Houston, Houston, TX, U.S.A.
Keywords:
Cell Detection, Conditional Random Fields, Clostridium Difficile Infection.
Abstract:
Automated detection of touching cells in images with inhomogeneous illumination is a challenging problem.
A detection framework using a stack of two conditional random fields is proposed to detect touching elongated
cells in scanning electron microscopy images with inhomogeneous illumination. The first conditional random
field employs shading information to segment the cells where the effect of inhomogeneous illumination is re-
duced. The second conditional random field estimates the cell walls using their estimated cell wall probability.
The method is evaluated using a dataset of Clostridium difficile cells. Finally, the method is compared with
two region-based cell detection methods, CellDetect and DeTEC, improving the F-score by at least 20%.
1 INTRODUCTION
Developments in scanning electron microscopy
(SEM) have facilitated the acquisition of digital im-
ages of micron level cells, leading to improvements in
cell quantification for pharmaceutical and medical re-
search studies (Endres et al., 2016). However, micro-
scopic images may have inhomogeneous illumination
and are often degraded due to noise. Furthermore,
the cells have various sizes and are clustered together,
making the problem of cell detection challenging.
Recent cell detection methods fall into two cat-
egories. The first category assumes that the cells
are easily separable from the background. In this
family of methods, features are extracted from im-
age patches and are forwarded to a classifier, such as
random forests, to identify the cell centroids (Kainz
et al., 2015) using several distance metrics for the
classification score (Wu and Nevatia, 2009; Way-
alun et al., 2012; Saiyod and Wayalun, 2014; Minaee
et al., 2014). The second category includes region-
based detection methods. At first, cell candidate re-
gions are detected based on shape or statistical texture
descriptors. Then, the best candidates are selected
based on correlation clustering (Zhang et al., 2014),
optimization-based (Arteta et al., 2012; Arteta et al.,
2016; Memariani et al., 2016; Browet et al., 2016), or
heuristic methods (Keuper et al., 2011; Santamaria-
Pang et al., 2015).
DeTEC (Memariani et al., 2016) applied a se-
quence of two Markov random fields (MRF) to detect
touching elongated cells. The first MRF segments the
cells from the background using texture features. The
second MRF separates the touching cells by estimat-
ing the cell walls. However, DeTEC has the follow-
ing drawbacks: (i) It relies only on texture features
and cell wall probabilities to separate cells from their
background. Since the algorithm is unsupervised, the
features have the same level of importance. However,
inhomogeneous illumination may alter the local tex-
ture and hence decrease the accuracy of the segmen-
tation. (ii) It applies a number of edge detectors to
train a random forest, estimating the cell wall prob-
abilities. However, edge detectors are not robust to
noise. In case a cell is eroded due to a laboratory
treatment, the random forest detects the erroneous cell
walls. (iii) Noisy estimation of cell wall probabilities
leads to poor classification of cell walls. (iv) It relies
on superpixels; Inhomogeneous illumination hinders
the extraction of superpixels whose boundaries match
with the cell walls.
Deep neural networks have been applied to mi-
croscopy images. DeepCell (Van Valen et al., 2016)
applied convolutional neural networks (CNN) to learn
the features. However, training a CNN requires a
large dataset to tune the parameters and hyperpa-
rameters of the networks, which remains a challenge
574
Memariani, A., Nikou, C., Endres, B., Bassères, E., Garey, K. and Kakadiaris, I.
DETCIC: Detection of Elongated Touching Cells with Inhomogeneous Illumination using a Stack of Conditional Random Fields.
DOI: 10.5220/0006623305740580
In Proceedings of the 13th International Joint Conference on Computer Vision, Imaging and Computer Graphics Theory and Applications (VISIGRAPP 2018) - Volume 4: VISAPP, pages
574-580
ISBN: 978-989-758-290-5
Copyright © 2018 by SCITEPRESS – Science and Technology Publications, Lda. All rights reserved
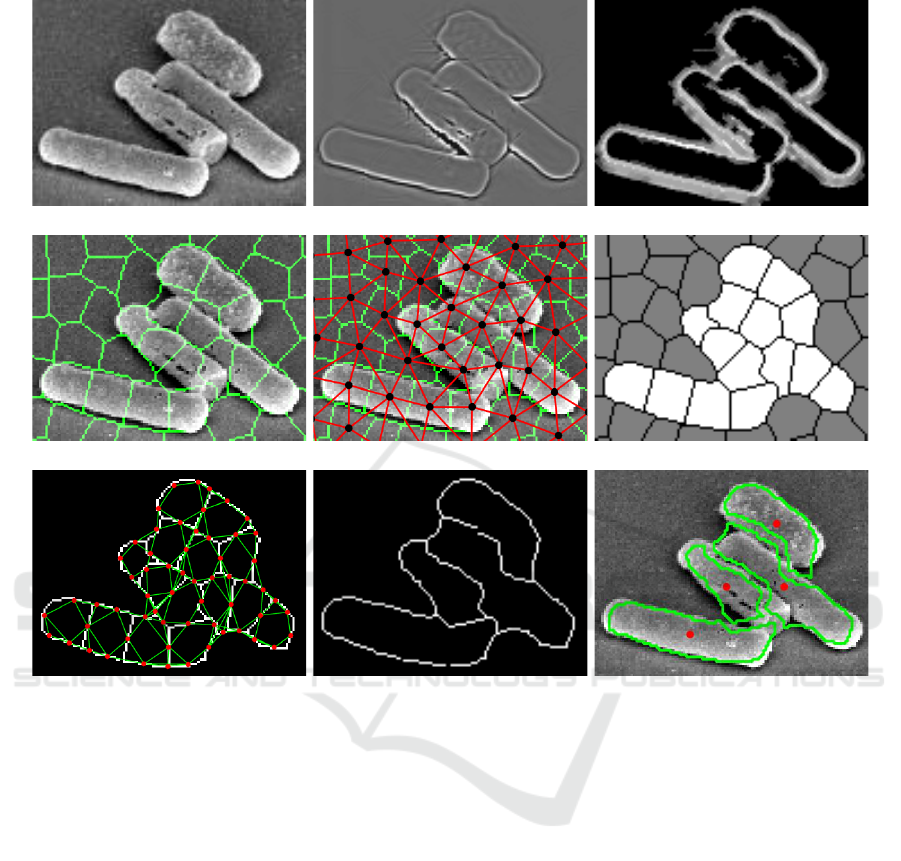
(i) (ii) (iii)
(iv) (v) (vi)
(vii) (viii) (ix)
Figure 1: Application of DETCIC to a Clostridium difficile cell image acquired via SEM imaging with 10,000x magnification.
(i) Depiction of original image. (ii) Illumination normalization is applied on original image. (iii) A random forest estimates
the cell wall probabilities. (iv) Image is divided into superpixels. (v) The first CRF is defined onto superpixels, which
segments the cells from their background. (vi) The first CRF segments the cells from their background. (vii) The second CRF
is imposed on superpixel boundary components to estimate the cell walls. (viii) The second CRF estimates the cell walls. (ix)
Detected cell centroids and their boundaries are shown.
specifically for images obtained by scanning electron
microscopy (SEM).
In this paper, DETCIC a detector of elongated
cells is proposed which improves the performance
of DeTEC with respect to the drawbacks mentioned
above. Specifically, (i) DETCIC considers shading
along with texture for feature extraction. (ii) it em-
ploys a shearlet based edge detector (King et al.,
2015) that is robust to noise to enhance the detection
of the cell wall pixels. (iii) DETCIC applies a stack
of two conditional random fields, which is a super-
vised method, in contrast to the MRF formulation of
DeTEC. (iv) DETCIC applies illumination normaliza-
tion, reducing the effect of inhomogeneous illumina-
tion.
The rest of the paper is organized as follows.
Section 2 describes the proposed algorithm. Exper-
imental results are presented in Section 3, comparing
the performance of DETCIC with the state-of-the-art
cell detection methods DeTEC and CellDetect (Arteta
et al., 2012). Finally, conclusions are drawn in Sec-
tion 4.
2 METHODS
DETCIC consists of a stack of two conditional ran-
dom fields (CRF): the first CRF selects the cell can-
didates from the background while the second CRF
separates the touching cells. Estimating the cell walls
is an important step for both CRFs. Figure 1 depits
the steps of the algorithm. This section describes how
DETCIC: Detection of Elongated Touching Cells with Inhomogeneous Illumination using a Stack of Conditional Random Fields
575
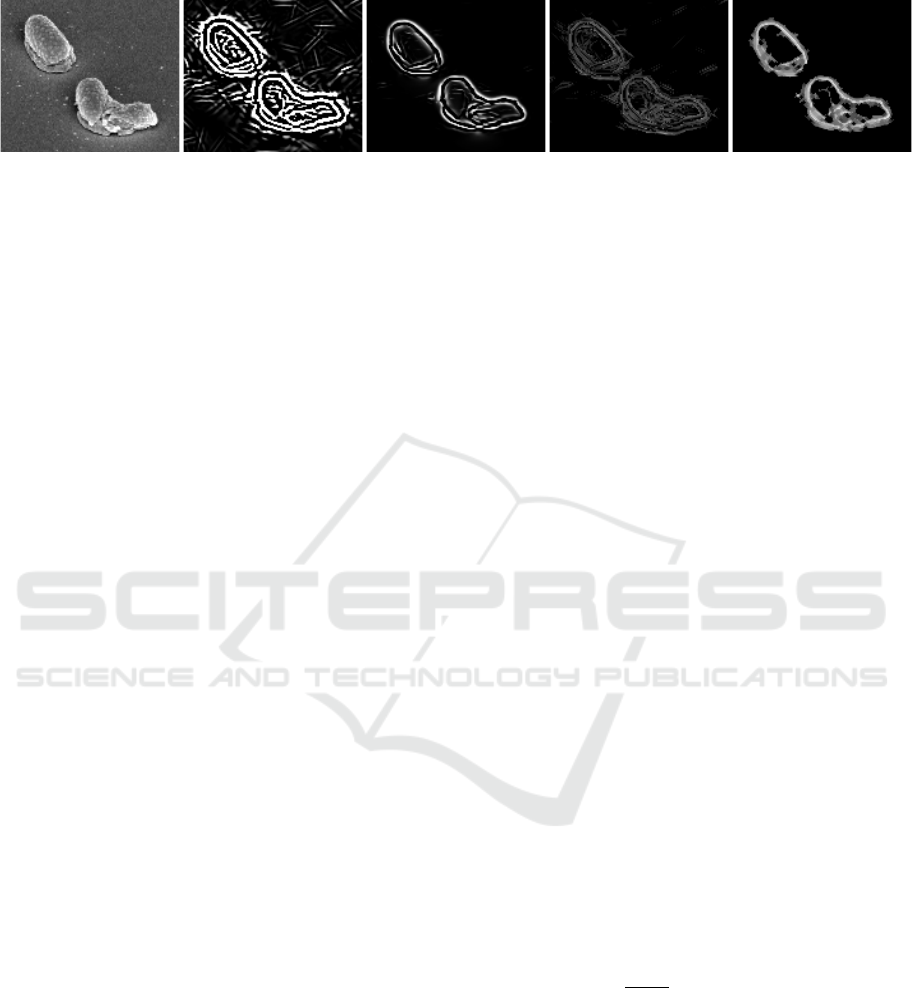
(a) (b) (c) (d) (e)
Figure 2: Depiction of edge detector features used for estimation of cell wall probabilities: (a) Original image, (b) Difference
of Gaussians, (c) Application of a vessel enhancement filter (Frangi et al., 1998), (d) Roberts edge detector, and (e) A shearlet-
based edge detector (King et al., 2015).
the cell walls can be estimated and how the cell wall
probabilities can be applied to form the potentials of
the two CRFs.
2.1 Estimation of the Cell Walls
Inhomogeneous illumination hampers the detection of
the cell walls. The illumination component is esti-
mated by smoothing the original image in the loga-
rithmic domain using a Gaussian filter. Then, the il-
lumination normalized image is obtained by dividing
the image intensities with the estimated illumination
in every image I:
I
n
= exp(log(I + 1) − log (I + 1) ∗ G), (1)
where, G is a Gaussian filter with standard devia-
tion σ
G
. The underlying assumption in Eq (1) is the
Retinex model (Zosso et al., 2013) of illumination
which states that an acquired image I is a pointwise
product of illumination and reflectance. The illumi-
nation component is present mainly in coarse scales
and it can be estimated by appropriately smoothing
the image. The reflectance component captures struc-
tures lying, in general, in finer scales.
The illumination normalization highlights the cell
walls, reducing the effect of inhomogeneous illumi-
nation. A shearlet-based total variation method is ap-
plied to obtain the denoised image D, retaining the
cell boundaries (Easley et al., 2009).
A random forest estimates the probability of a
pixel belonging to a cell wall in D. We compute a
matrix of edge detector features F
r
, including, differ-
ence of Gaussian, a vessel enhancement filter (Frangi
et al., 1998), Roberts, and a shearlet-based edge de-
tectors (King et al., 2015). The first two edge detec-
tors are selected because they create a narrow line for
cell walls though they may include some noise. On
the contrary, the last two features preserve the edges,
which have the shape of a curve, but they cover a
thicker area around the actual cell walls (Figure 2).
The random forest combines all the edge detectors to
provide robust boundaries representing the cell walls.
Next, a sequence of two CRFs is describe in which
the first CRF finds the cell candidate regions and the
second CRF separates cells by estimating their cell
walls.
2.2 Cell Candidate Segmentation
The denoised image D is divided into superpixels
(Mori, 2005). A CRF is applied onto the superpix-
els with the following objective function:
E
1
=
∑
t
∑
i
u
1
ti
(f
1
ti
, λ
1
ti
;w
1
) +
∑
i
∑
j∈G
1
ti
v
1
ti j
(λ
1
ti
, λ
1
t j
, P
1
ti j
;w
1
)
. (2)
The unary u
1
ti
and pairwise v
1
ti j
potentials are con-
sidered linear in the parameter w
1
. The feature vec-
tor f
1
ti
contains the mean of the shading (Zosso et al.,
2013) and intensity values of the i
th
superpixel.
The pairwise potential v
1
ti j
adds a penalty if the
neighboring superpixels have different labels. The
pairwise penalty is reduced if the boundary segment
between the superpixels i and j has a high probability
of belonging to cell wall:
P
1
ti j
=
1
|N
ti j
|
∑
x∈N
ti j
p
x
. cos α
ti j
, (3)
where N
ti j
is the set of all pixels separating the su-
perpixels i and j in the image t of the training set,
and p
x
is the probability of a pixel at position x be-
longing to a cell wall obtained by the trained random
forest. The angle α
ti j
is the angle between the su-
perpixel boundary component (SBC) and the corre-
sponding connected component estimated by the ran-
dom forest when the cell wall probability map is su-
perimposed onto the superpixel map (Figure 3).
VISAPP 2018 - International Conference on Computer Vision Theory and Applications
576
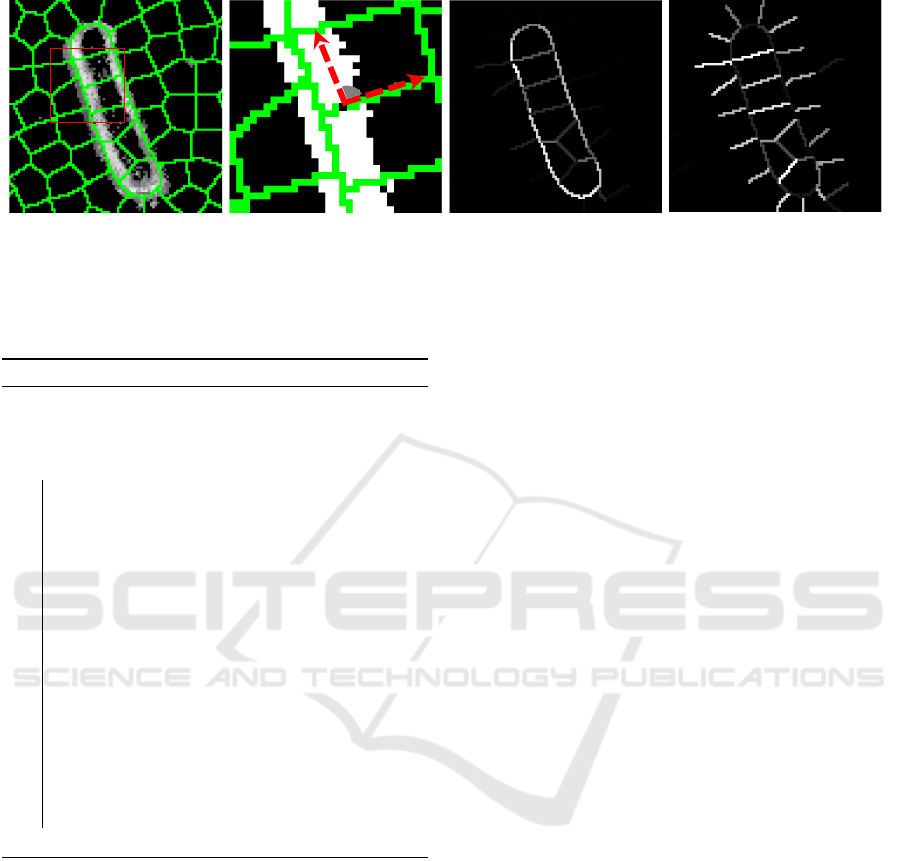
(a) (b) (c) (d)
Figure 3: (a) Superpixel map (green color) is overlaid onto the cell wall probability map. (b) Zoomed visualization of the area
inside the red square in (a). The gray angle is determined by the largest connected component in the probability map (white
color) and the superpixel boundary segments (green color). (c) The mean cell wall probabilities of the image depicted in (a).
(d) Depiction of the standard deviations of cell wall probabilities.
Algorithm 1: DETCIC training.
Input : Training images, cell annotations
Output: Trained random forest, CRF weight
parameters
1 begin
2 For every image I
t
(t = 1, ..., n
t
) in the
training set, compute the illumination
normalized image I
n
t
, shearlet denoised
image D
t
, superpixel map S
t
, and edge
detector feature map F
r
t
.
3 Given the feature map F
r
train a random
forest to estimate the cell wall
probability P
1
4 Given P
1
and S
t
train the first CRF on
superpixels, minimizing E
1
to obtain
weights w
1
5 For every S
t
(t = 1, ..., n
t
), extract SBCs
that belong to a cell wall.
6 Train the second CRF on SBCs,
minimizing E
2
to learn the weights w
2
.
7 end
The first CRF separates the cell regions from the
background by predicting the superpixel labels λ
1
ti
.
However, the cells may be clustered together. Thus,
A second CRF is imposed onto the SBCs of the se-
lected superpixels to estimate the cell walls and sepa-
rate cells.
2.3 Elongated Cell Separation
The second CRF is defined over the SBCs extracted
from the first CRF. The objective function aims to se-
lect SBCs that are probable to belong to a cell wall
and are elongated:
E
2
=
∑
t
∑
q
u
2
tk
(f
2
tq
, λ
2
q
, w
2
) +
∑
q
∑
r∈G
2
tq
v
2
tqr
(λ
2
q
, λ
2
r
, f
2
tq
, f
2
tr
, B
tqr
, w
2
)
. (4)
Similar to the first CRF, the unary and the pair-
wise terms are linear combinations of features and
weight parameters that minimize the energy function
E
2
. The unary feature vector f
2
tq
includes the mean
and standard deviation of the cell wall probabilities
P
2
t pq
. The pairwise feature vector includes the differ-
ence between the two unary features and the cosine
of the angle B
tqr
between SBCs q and r. The pair-
wise potential v
2
tqr
penalizes the objective function if
the predicted labels λ
2
q
and λ
2
r
are different. However,
the penalty is reduced if the two SBCs have different
unary features or do not form an elongated structure.
2.4 DETCIC Training and Inference
The DETCIC training set includes images
I
t
(t = 1, ..., n
t
), which are annotated manually.
Cell wall labels to train the random forest are the
boundaries of the annotations.
Moreover, the CRF objective function
E
1
is trained with the superpixel label set
L
1
t
= {l
1
ti
∈ {0, 1}|i = 1, ..., n
s
}, where n
s
is the
number of superpixels in the image. The first CRF
selects superpixels that are likely to belong to a
cell. The second CRF is trained with the label set
L
2
t
= {l
2
t p
∈ {0, 1}|p = 1, ..., n
b
}, where n
b
is the
number of SBCs extracted from the cell candidate
superpixels in the image t in the training set. Label
sets L
1
t
and L
2
t
are computed from the manual
annotations. Algorithm 1 outlines the training steps
for both CRFs. A graph cut provides the labels
DETCIC: Detection of Elongated Touching Cells with Inhomogeneous Illumination using a Stack of Conditional Random Fields
577
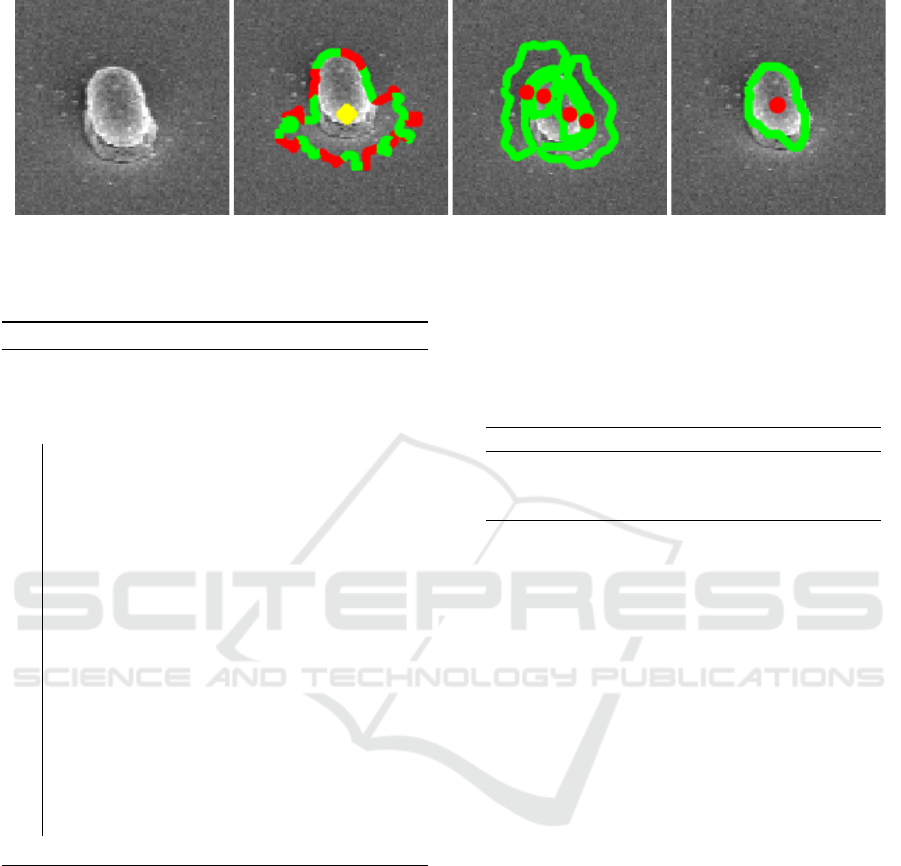
(a) (b) (c) (d)
Figure 4: Depiction of the effect of inhomogenous illumination: (a) Original image, (b) CellDetect (Arteta et al., 2012),
(c) DeTEC (Memariani et al., 2016), and (d) DETCIC.
Algorithm 2: DETCIC inference.
Input : A new image I
d
, the parameters of
the random forest and CRFs
Output: Cell centroids
1 begin
2 For the cell image I
d
, compute the
illumination normalized image I
n
d
, the
shearlet denoised image D
d
, the
superpixel map S
d
, and the edge
detector features F
r
d
3 Input F
r
d
to the trained random forest to
compute the cell wall probability map
P
d
4 Given P
1
, S
d
, and w
1
, apply graph cut to
obtain a segmentation on superpixels.
5 Extract the SBCs from the selected
superpixels.
6 Given P
2
, and w
2
, apply graph cut on
SBCs to estimate cell walls.
7 Use the estimated cell walls to create
morphological connected components.
8 Compute the cell centroids.
9 end
for each CRF while a gradient-based optimization
method selects the best parameter configuration w
that minimizes the objective function E .
Algorithm 1 learns the parameters (w
1
, w
2
).
Given a new image I
d
, computing the cell wall prob-
abilities P
d
requires computing the illumination nor-
malized image I
n
d
and denoised image D
d
similar to
the training images.
Then, DETCIC performs two graph cuts: the first
is applied to a rough segmentation of the cells from
the background and the second is applied to the SBCs
to determine the cell walls (Algorithm 2).
Table 1: Comparative results between DETCIC, DeTEC
(Memariani et al., 2016), and CellDetect (Arteta et al.,
2012), where the acceptable distance of detected centroids
from the ground truth is set to the length of the major axis
of the smallest cell in the dataset.
Method Precision Recall F-score
CellDetect 0.80 0.23 0.36
DeTEC 0.50 0.88 0.63
DETCIC 0.68 0.83 0.75
3 EXPERIMENTAL RESULTS
A dataset of Clostridium difficile cell images was ac-
quired via SEM imaging with 10,000x magnification
and 411×711 pixel resolution. A set of 19 images
(211 cells) with similar contrast and cell density were
selected for the experiments. The cells are inhomoge-
nously illuminated. Furthermore, cell densities are
low in most images but many cells are clustered to-
gether, making the detection challenging. In some
cases, the cells are partially destroyed due to a lab-
oratory treatment. A GUI is developped for the anno-
tating the cells and the annotations were verified by
the expert.
Cell centroids are manually annotated to provide
the ground truth. A cell is considered to be detected
if the detected centroid lies within a distance d from
the ground truth. The distance is set to the length of
the smallest cell in the dataset. Precision, recall, and
F-score are computed to measure the performance of
detection.
Table 1 provides the comparison of the perfor-
mance of DETCIC with CellDetect and DeTEC. The
training was based on a leave-one-out cross valida-
tion. CellDetect is a supervised region-based cell de-
tection method which applies extremal regions to de-
tect candidate cell regions (Matas et al., 2004). Then,
a statistical model selects the best extremal regions.
VISAPP 2018 - International Conference on Computer Vision Theory and Applications
578
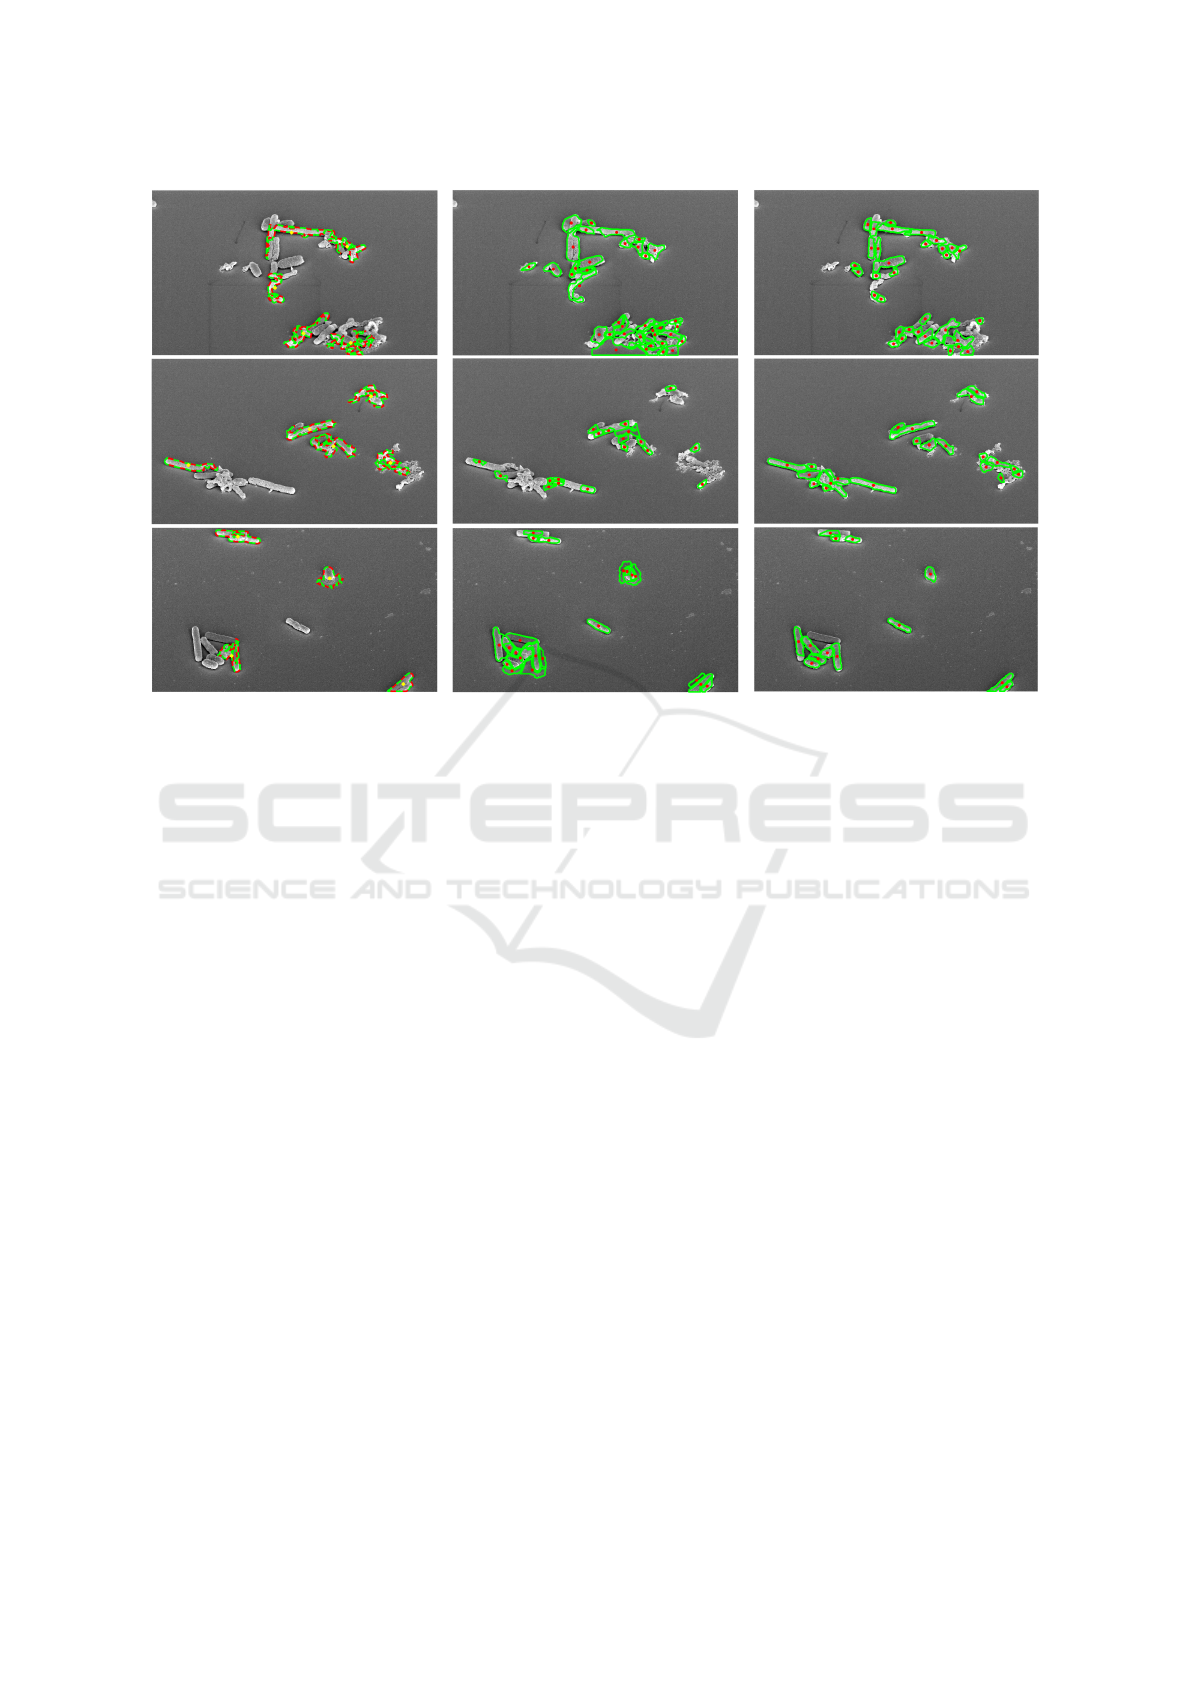
Figure 5: Depiction of the detected cell centroids and their estimated cell walls for CellDetect (Arteta et al., 2012) (Left),
DeTEC (Memariani et al., 2016) (Middle), and DETCIC (Right).
However, CellDetect fails to detect a fair amount of
cells, assuming there should exist some extremal re-
gions that can represent the cells (Arteta et al., 2016).
Therefore, CellDetect achieves a lower recall index
compared to the other two methods. DeTEC is an un-
supervised region-based method that applies an MRF
to segment the cell candidates, and a second MRF to
separate the best cell walls to detect the centroids. Al-
though DeTEC detects most cells, the detected cell
walls are sensitive to erosion which may be caused by
a pharmaceutical treatment. Therefore, some cells are
broken into smaller pieces, increasing the number of
false positives which leads to low precision. DETCIC
significantly improves the cell break downs due to a
better estimation of cell wall probabilities which are
used to train the second CRF.
Figure 4 depicts an instance where inhomoge-
neous illumination created shadows on the cell body
as well as the area around the cell. CellDetect falsely
includes shadows around the cell as part of the cell
body. Furthermore, the shadow on the cell body cre-
ate two bright side on both sides of the cell. DeTEC
considers these sides as separate cells and fails to de-
tect the entire cell. However, DETCIC is able to re-
duce the effect of illumination and detect the cell wall
accurately.
Figure 5 depicts examples of detected cells.
CellDetect does not detect many cells while failing
to separate clusters of touching cells. On the contrary
DETCIC is able to detect most cells. However, a few
cells are missing due to large shadows which make
the cells merge into the background.
DeTEC is able to detect most cells or a portion of
them. However, DeTEC fails to estimate the correct
boundaries in many cases. Also, DeTEC fails to dis-
tinguish between cells and small background regions
surrounded by cells due to its unsupervised nature.
Furthermore, DeTEC is more sensitive to inho-
mogeneous illumination compared to DETCIC. More
specifically, DeTEC fails to clearly distinguish be-
tween cells and background in image regions where
cell walls are covered by shadows. Figure 4 depicts
the detection of a cell effected by inhomogeneous il-
lumination.
4 CONCLUSIONS
A cell detection method (DETCIC) is proposed, that
can be used to extract cell meta-data (e.g., number of
cells, cell length, cell deformation, etc.). DETCIC is
applied on SEM images with inhomogeneous illumi-
nation to detect clostridium difficile cells. DETCIC
successfully separates touching elongated cells by es-
timating their cell walls.
DETCIC: Detection of Elongated Touching Cells with Inhomogeneous Illumination using a Stack of Conditional Random Fields
579

ACKNOWLEDEMENTS
This work was supported in part by the National Insti-
tutes of Health (NIH/NIAID 1UO1 AI-24290-01) and
by the Hugh Roy and Lillie Cranz Cullen Endowment
Fund. All statements of facts, opinion or conclusions
contained herein are those of the authors and should
not be construed as representing official views or poli-
cies of the sponsors.
REFERENCES
Arteta, C., Lempitsky, V., Noble, A., and Zisserman,
A. (2016). Detecting overlapping instances in mi-
croscopy images using extremal region trees. Medical
Image Analysis, 27:3–16.
Arteta, C., Lempitsky, V., Noble, J. A., and Zisserman, A.
(2012). Learning to detect cells using non-overlapping
extremal regions. In Proc. Medical Image Computing
and Computer Assisted Intervention, pages 348–356,
Berlin, Heidelberg.
Browet, A., Vleeschouwer, C. D., Jacques, L., Mathiah, N.,
Saykali, B., and Migeotte, I. (2016). Cell segmenta-
tion with random ferns and graph-cuts. In Proc. IEEE
International Conference on Image Processing, pages
4145–4149, Phonix, AZ.
Easley, G. R., Labate, D., and Colonna, F. (2009). Shearlet-
based total variation diffusion for denoising. IEEE
Transactions on Image Processing, 18(2):260–268.
Endres, B. T., Bassres, E., Memariani, A., Chang, L., Alam,
M. J., Vickers, R. J., Kakadiaris, I. A., and Garey,
K. W. (2016). A novel method for imaging the phar-
macological effects of antibiotic treatment on clostrid-
ium difficile. Anaerobe, 40:10–14.
Frangi, A., Niessen, W., Vincken, K., and Viergever, M.
(1998). Multiscale vessel enhancement filtering. In
Proc. Medical Image Computing and Computer As-
sisted Intervention, volume 1496, pages 130–137,
Cambridge, MA.
Kainz, P., Urschler, M., Schulter, S., Wohlhart, P., and
Lepetit, V. (2015). You should use regression to de-
tect cells. In Proc. Medical Image Computing and
Computer-Assisted Intervention, pages 276–283, Mu-
nich, Germany. Springer.
Keuper, M., Schmidt, T., Rodriguez-Franco, M., Schamel,
W., Brox, T., Burkhardt, H., and Ronneberger, O.
(2011). Hierarchical markov random fields for mast
cell segmentation in electron microscopic recordings.
In Proc. IEEE International Symposium on Biomedi-
cal Imaging: From Nano to Macro, pages 973–978,
Chicago, IL.
King, E., Reisenhofer, R., Kiefer, J., Lim, W., Li, Z., and
Heygster, G. (2015). Shearlet-based edge detection:
flame fronts and tidal flats. In Proc. SPIE Applications
of Digital Image Processing, volume 9599, pages 1–
11, San Diego, CA.
Matas, J., Chum, O., Urban, M., and Pajdla, T. (2004).
Robust wide-baseline stereo from maximally stable
extremal regions. Image and Vision Computing,
22(10):761–767.
Memariani, A., Nikou, C., Endres, B. T., Bass
`
eres, E.,
Garey, K. W., and Kakadiaris, I. A. (2016). DeTEC:
detection of touching elongated cells in sem images.
In Proc. International Symposium on Visual Comput-
ing, pages 288–297, Las Vegas, NV.
Minaee, S., Fotouhi, M., and Khalaj, B. (2014). A geomet-
ric approach to fully automatic chromosome segmen-
tation. In Proc. IEEE Signal Processing in Medicine
and Biology Symposium, pages 1–6, Philadelphia, PA.
Mori, G. (2005). Guiding model search using segmenta-
tion. In IEEE International Conference on Computer
Vision, pages 1417–1423.
Saiyod, S. and Wayalun, P. (2014). A hybrid technique
for overlapped chromosome segmentation of g-band
mataspread images automatic. In Proc. International
Conference on Digital Information and Communica-
tion Technology and its Applications, pages 400–404,
Bangkok, Thailand.
Santamaria-Pang, A., Rittscher, J., Gerdes, M., and Pad-
field, D. (2015). Cell segmentation and classification
by hierarchical supervised shape ranking. In Proc.
IEEE International Symposium on Biomedical Imag-
ing, pages 1296–1299, Brooklyn, NY.
Van Valen, D. A., Kudo, T., Lane, K. M., Macklin, D. N.,
Quach, N. T., DeFelice, M. M., Maayan, I., Tanouchi,
Y., Ashley, E. A., and Covert, M. W. (2016). Deep
learning automates the quantitative analysis of indi-
vidual cells in live-cell imaging experiments. PLoS
Computational Biology, 12(11):e1005177.
Wayalun, P., Chomphuwiset, P., Laopracha, N., and Wan-
chanthuek, P. (2012). Images enhancement of g-band
chromosome using histogram equalization, OTSU
thresholding, morphological dilation and flood fill
techniques. In Proc. 8
th
International Conference on
Computing and Networking Technology, pages 163–
168, Gueongju, China.
Wu, B. and Nevatia, R. (2009). Detection and segmentation
of multiple, partially occluded objects by grouping,
merging, assigning part detection responses. Interna-
tional Journal of Computer Vision, 82:185–204.
Zhang, C., Yarkony, J., and Hamprecht, F. A. (2014). Cell
detection and segmentation using correlation clus-
tering. In Proc. Medical Image Computing and
Computer-Assisted Intervention, pages 9–16, Boston.
Springer.
Zosso, D., Tran, G., and Osher, S. (2013). A unifying
retinex model based on non-local differential opera-
tors. In Proc. SPIE Computational Imaging, volume
8657, pages 865702–865702–16, Burlingame, CA.
VISAPP 2018 - International Conference on Computer Vision Theory and Applications
580
