
Early Prediction of MRSA Infections using Electronic Health Records
Thomas Hartvigsen
1
, Cansu Sen
1
, Sarah Brownell
2
, Erin Teeple
1
,
Xiangnan Kong
1
and Elke Rundensteiner
1
1
Worcester Polytechnic Institute, 100 Institute Rd., Worcester, MA, U.S.A.
2
Simmons College, 300 Fenway, Boston, MA, U.S.A.
Keywords:
MRSA, Healthcare-associated Infections, Risk Stratification, Machine Learning, Electronic Health Records.
Abstract:
Despite eradication efforts, Methicillin-resistant Staphylococcus aureus (MRSA) remains a common cause
of serious hospital-acquired infections (HAI) in the United States. Electronic Health Record (EHR) systems
capture MRSA infection events along with detailed patient information preceding diagnosis. In this work, we
design and apply machine learning methods to support early recognition of MRSA infection by estimating risk
at several time points during hospitalization. We use EHR data including on-admission and throughout-stay
patient information. On-admission features capture clinical and non-clinical information while throughout-
stay features include vital signs, medications, laboratory studies, and other clinical assessments. We evaluate
prediction accuracy achieved by core Machine Learning methods, namely Logistic Regression, Support Vector
Machine, and Random Forest classifiers, when mining these different types of EHR features to detect patterns
predictive of MRSA infection. We evaluate classification performance using MIMIC III – a critical care
data set comprised of 12 years of patient records from the Beth Israel Deaconess Medical Center Intensive
Care Unit in Boston, MA. Our methods can achieve near-perfect MRSA prediction accuracies one day before
documented clinical diagnosis. Also, they perform well for early MRSA prediction many days in advance of
diagnosis. These findings underscore the potential clinical applicability of machine learning techniques.
1 INTRODUCTION
1.1 Antibiotic Resistance and MRSA
The antibiotic resistance crisis presents a formidable
global health threat for the 21st century. The discov-
ery of antibiotics to treat bacterial infections trans-
formed medicine and saved millions of lives (Ven-
tola, 2015). Over time, however, the use of antibiotics
has resulted in the selection and spread of antibiotic-
resistant strains. Infections caused by organisms re-
sistant to traditional antibiotics are more difficult to
treat and may require the use of more expensive and
potentially more toxic alternative therapies, if any are
available (Neu, 1992).
Staphylococcus aureus is one of the most com-
mon causes of Hospital-Acquired Infections (HAIs),
accounting for an estimated 12% of HAIs between
2011-2014 and causing over 80,000 infections in the
United States in 2011 alone (Weiner et al., 2016;
Dantes et al., 2013). Methicillin-resistant Staphy-
lococcus aureus (MRSA) is one antibiotic-resistant
strain of this bacteria. MRSA infections may result in
serious complications including sepsis and death. Un-
fortunately, hospitals are known to be high-risk zones
for spread of MRSA because contamination may go
undetected. Also, many hospitalized patients are at
increased risk of infection (Maree et al., 2007).
1.2 Leveraging EHR Systems for
MRSA Infection Prediction
The construction of intelligent infection prediction
systems using machine learning presents one impor-
tant opportunity for confronting the challenges of an-
tibiotic resistance and the spread of infections such as
MRSA in healthcare environments (Sintchenko et al.,
2008). Infection prediction systems have shown to
be successfully identify early signals for other infec-
tions, such as Clostridium difficile (Sen et al., 2017).
An overview of such an approach is depicted in Figure
1. Before caregivers recognize or test for MRSA, ma-
chine learning algorithms have the potential to iden-
tify likely MRSA cases in advance based on patterns
learned from the medical information of previous
cases. Such early detection would facilitate (1) early
156
Hartvigsen, T., Sen, C., Brownell, S., Teeple, E., Kong, X. and Rundensteiner, E.
Early Prediction of MRSA Infections using Electronic Health Records.
DOI: 10.5220/0006599601560167
In Proceedings of the 11th International Joint Conference on Biomedical Engineering Systems and Technologies (BIOSTEC 2018) - Volume 5: HEALTHINF, pages 156-167
ISBN: 978-989-758-281-3
Copyright © 2018 by SCITEPRESS – Science and Technology Publications, Lda. All rights reserved
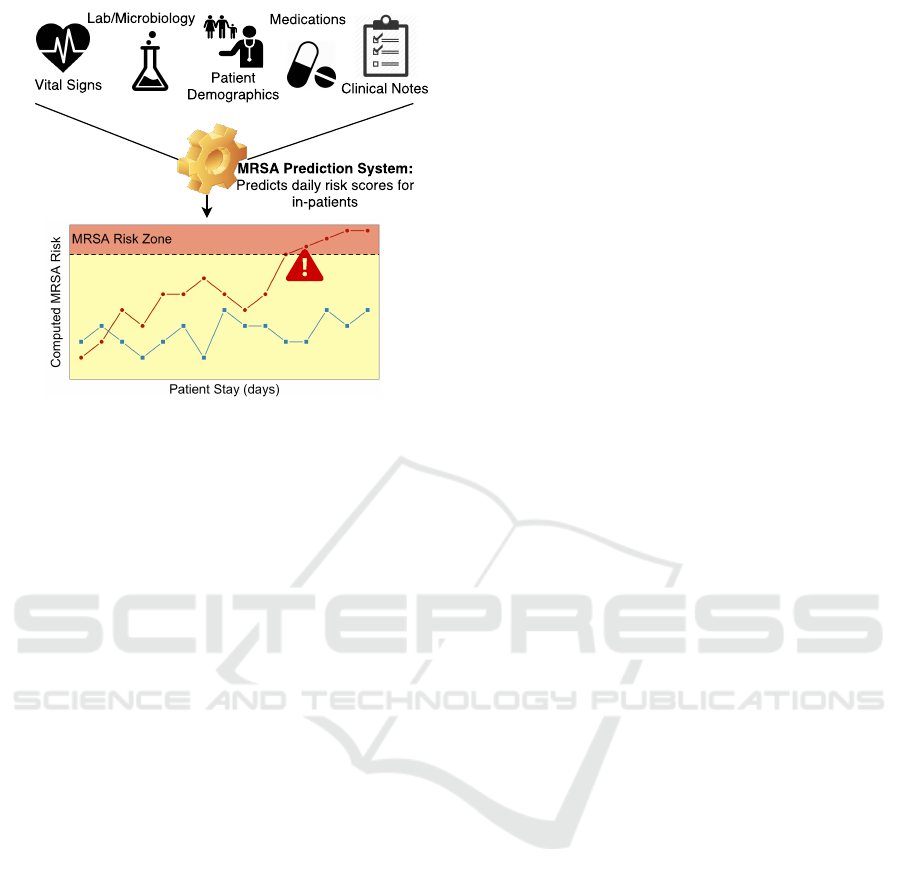
Figure 1: Overview of Intelligent Infection Prediction.
isolation to reduce spread of resistant strains within
the healthcare facility; (2) judicious, more precisely
targeted antibiotic usage; and (3) earlier initiation of
optimal treatments to improve patient outcomes. Us-
ing insights created through intelligent prediction sys-
tems, healthcare professionals could decide to initiate
precautionary measures or alter treatment plans. For
example, at the point of admission, high-risk patients
could benefit from contact precautions, such as glov-
ing, gowning, and/or environment alterations, or pa-
tient placement precautions, such as patient assign-
ment decisions based on risk factors (Shang et al.,
2000). Machine learning-guided patient assessment
thus offers an enhanced range of intervention points
to arrest the spread of MRSA.
Electronic Health Records (EHR) systems have
been universally adopted by medical facilities across
the United States as a result of the Health Informa-
tion Technology for Economic and Clinical Health
(HITECH) Act (Congress, 2009) and the Centers
for Medicare and Medicaid EHR Incentive Programs
(CMS, 2011). To date, however, data accumulated
within these systems has been largely underutilized
for predictive analytics (Celi et al., 2013). The
widespread digitalization of health records presents a
unique opportunity for healthcare innovation (Jensen
et al., 2012; Raghupathi and Raghupathi, 2014). It
is evident that there are signals embedded in these
complex patient data that could indicate the likeli-
hood of an evolving infection or other medically im-
portant conditions (Jensen et al., 2012; Raghupathi
and Raghupathi, 2014). Thus, in this work we fo-
cus on one such application, namely the prediction
of hospital-acquired MRSA infections using machine
learning methods.
1.3 Methods for MRSA Prediction
Previous research efforts have begun to explore the
application of intelligent systems to EHR data for
HAI prediction. In one such investigation, EHR data
was analyzed to generate predictions for HAI occur-
rence without specific determination of infection type
(Chang et al., 2011). This method used only 16 pa-
tient characteristics recorded at the beginning of the
hospital stay and classified patients using Logistic Re-
gression and Artificial Neural Networks. Even us-
ing this limited set of patient variables, the authors
reported high predictive accuracy. In another study
(Nseir et al., 2010), admission information was used
to identify multi-drug resistant bacterial infections us-
ing Logistic Regression methods. For MRSA infec-
tion prediction, (Dutta and Dutta, 2006) used Bayes’
Theorem and a Maximum Probability Rule to pre-
dict MRSA cases from medical-sensor data with up
to 99.83% accuracy. However, these authors did not
focus on early detection. Instead, they used data
available right up to microbiological MRSA confir-
mation. Last-minute detection has limited clinical
value. Another study by (Shang et al., 2000) used
EHR data collected at the time of admission to di-
agnose community-acquired MRSA using Logistic
Regression and simple Artificial Neural Networks,
but this approach did not incorporate information ob-
tained throughout the hospital stay.
1.4 Scope of this Work
In this investigation, we use Logistic Regression for
consistency with earlier diagnostic prediction stud-
ies (Chang et al., 2011; Shang et al., 2000), and we
also include Support Vector Machines and Random
Forests due to their previous use in detecting other in-
fections (Lebedev et al., 2014; Khalilia et al., 2011;
Wiens et al., 2012; Wu et al., 2010). All of these al-
gorithms are also known to be easily interpretable. In
contrast to earlier work, however, we focus on devel-
oping clinically translatable models. Previous studies
have either used data from immediately before diag-
nosis to achieve high predictive accuracy or used only
data collected at admission, which prevents the iden-
tification of conditions that evolve during hospitaliza-
tion. Our objective in this investigation is to balance
early prediction with high accuracy to achieve clini-
cally translatable MRSA detection methods.
We evaluate our techniques using the MIMIC
III database, a publicly-available critical-care data
set collected over 12 years from the Beth Israel
Deaconness Hospital Intensive Care Unit in Boston,
MA (Johnson et al., 2016). Our findings confirm that
machine learning is a highly effective technology for
Early Prediction of MRSA Infections using Electronic Health Records
157

early prediction using EHR data. Core machine learn-
ing methods are shown to effectively identify high-
risk MRSA patients. We report AUC scores of over
0.97 one day before diagnosis and 0.93 to 0.96 using
only the first day of EHR data for each patient. These
findings underscore the potential for machine learning
techniques to generate early warnings of infections.
2 METHODOLOGY
2.1 Objectives
There are many steps and possible options when ex-
tracting features from EHR databases. This is com-
plicated further when considering predictions for spe-
cific infections. In this work, data processing and
classification decisions were structured to answer the
following questions:
• Whether or not known risk factors alone can gen-
erate accurate predictions
• How many days should be used to make predic-
tions for each patient
• How early can accurate predictions be generated
2.2 The Dataset
The Medical Information Mart for Intensive Care
III (MIMIC III) is a publicly available critical care
database collected from the Beth Israel Deaconess
Medical Center Intensive Care Unit (ICU) between
2001 and 2012 (Johnson et al., 2016). It contains
58,000 admissions comprised of:
• Billing: Coded data recorded for billing and ad-
ministrative purposes (CPT, DRG, ICD codes).
• Descriptive: Demographic detail, admission and
discharge times, and dates of death.
• Interventions: Procedures such as dialysis.
• Laboratory: Blood chemistry, hematology, urine
analysis, and microbiology test results.
• Medications: Administration records of intra-
venous medications and medication orders.
• Notes: Free-form text notes such as provider
progress notes and hospital discharge summaries.
• Physiologic: Nurse-verified vital signs such as
heart rate and blood pressure.
Contained within these items are all known risk fac-
tors for MRSA infections. We display these features
and their availability in Table 2 (Aureden et al., 2010).
To identify MRSA patients, we extract the mi-
crobiology test associated with the organism 80293
(MRSA), found in the Microbiology Events table. We
use the microbiology test, as opposed to the ICD9
code, to extract the time of diagnosis. The presence
of this test in a patient’s record indicates a positive
result. Therefore we extract all 1,304 patients who
have a record of this test as our MRSA-positive pop-
ulation. As the vast majority of MIMIC consists of
patients who do not contract MRSA, the dataset is
imbalanced. To handle this, as we experiment with
different subsets of MRSA-positive patients, we ran-
domly subsample 1,304 patients who have no record
of a test for organism 80293, obtaining equally-sized
groups of positive and negative examples.
2.3 Feature Engineering
2.3.1 On-admission Features
Certain patient information is known at the time of
admission and does not change during a patient’s stay.
We refer to this as on-admission, or static, data. The
only known on-admission risk factor accessible in the
MIMIC III database is age. We extract a set of fea-
tures from the on-admission data and classify them
into two groups:
• Demographic features are immutable patient fea-
tures. These include age, gender, ethnicity, mari-
tal status, and religion.
• Stay-specific features describe a patient’s admis-
sion such as admission location, allowing infer-
ence on the patient’s condition. Stay-specific data
could be different for the same patient upon read-
mission. We extracted 3 such features: admis-
sion type (e.g., Emergency), admission location
(e.g., Transfer from another hospital), and insur-
ance (e.g., Medicaid).
We extracted a total of 9 on-admission features
and display the 4 that best contrast the MRSA-
positive and MRSA-negative patients in Table 1.
2.3.2 Throughout-stay Features
Throughout the hospital stay of a patient, observa-
tions such as laboratory results and vital signs are
recorded continuously. This results in throughout-
stay data. Additionally, for each day of a patient’s
stay, we generate multiple binary features flagging the
use of certain types of medication groups, such as an-
tibiotics. We extracted 80 throughout-stay features, as
summarized in Table 3.
One challenge is that each patient’s stay is
recorded as a series of clinical observations that tend
HEALTHINF 2018 - 11th International Conference on Health Informatics
158
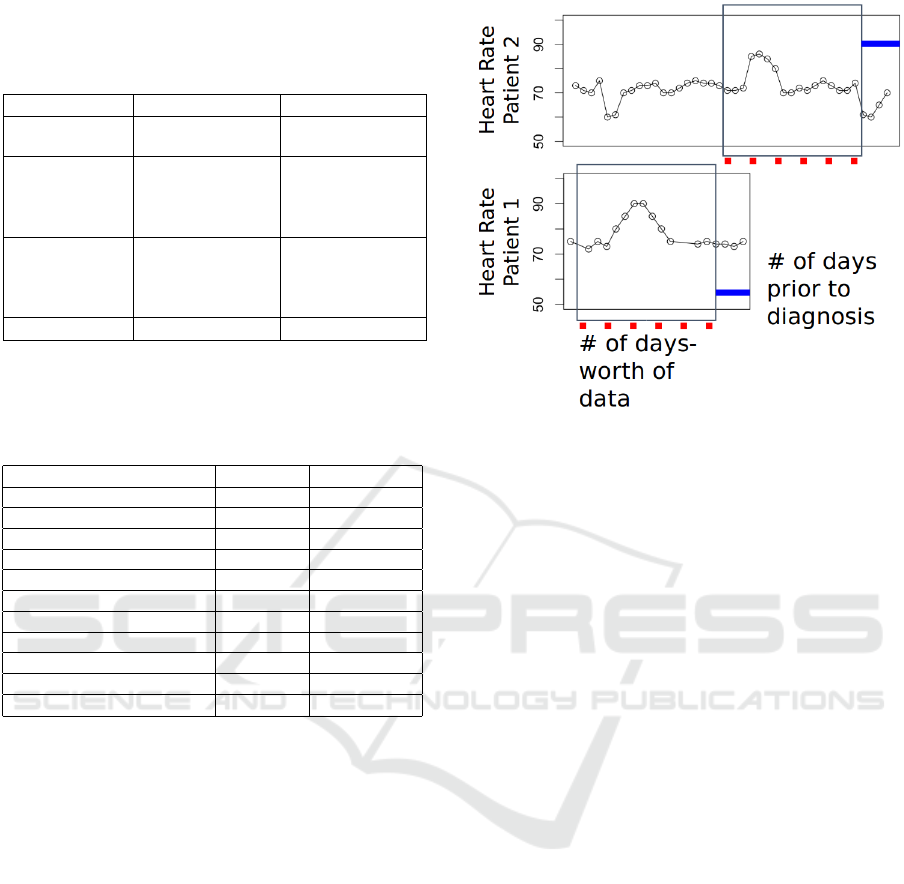
Table 1: Distributions of on-admission features for MRSA
and non-MRSA patients (in percent) in the database. We
only display variables that are notably different between
these two patient sets.
Variables MRSA (%) non-MRSA (%)
Gender Male: 57.5 Male: 55.1
Female: 42.5 Female: 44.9
Insurance Medicare: 68.7 Medicare: 52.8
Private: 20.1 Private: 35.1
Medicaid: 9.7 Medicaid: 9.3
Other: 1.5 Other; 2.8
Admiss. Type Emergency: 92.3 Emergency: 74
Elective: 6.8 Elective: 14.4
Newborn: 0 Newborn: 8.6
Urgent: 0.8 Urgent: 3.0
Age (av ± std) 68.5 ± 16.6 59.0 ± 24.2
Table 2: Known Risk Factors for MRSA (Fukuta et al.,
2012). Available column indicates if we can extract this
information, and source column indicates the table in
MIMIC.
Risk Factors Available Source
Old Age Yes Admission
Nursing Home Residence Unknown Unknown
Receipt of Transfusion Yes Services
Placing of Central Line Yes Chart
Respiratory Failure Yes Chart
Open Wounds Unknown Unknown
Severe Bacteremia Yes Lab Tests
Organ Impairment Yes Services
Other health conditions Yes Services
Previous Hospital Stay Yes Admission
Treatment with antibiotics Yes Medications
to be irregularly spaced. The frequency at which
these measurements are taken varies between patients
(e.g. once a day vs. multiple times a day). This varia-
tion is a function of (1) the observation (lab tests may
be taken only once a day while vital signs may be
measured multiple times a day); (2) each patient’s
condition (more severely ill patients must be mon-
itored more closely); and (3) the time of the day
(nurses are less likely to wake up patients in the mid-
dle of the night).
To make these data comparable across patients,
cleaning and aggregation are required. Here, we roll
up all observations taken more than once a day into
evenly sampled averages, resulting in one value per
day. If there are no measurements for a day, they are
considered missing values. To handle these empty
spaces, we compute the median value for each vari-
able and use it to fill in missing values.
A second challenge is that the total number of ob-
servations recorded per patient is not only a func-
tion of the frequency of observation, but also the
length of the patient’s stay. After the above described
Figure 2: Time alignment strategy. Number of days-worth
of data indicates the feature extraction window and the
number of days prior to diagnosis indicates the ending-
position of the window relative to actual diagnosis.
day-based aggregation, we apply a rectangulariza-
tion strategy to extract the same number of days for
each patient. This is achieved by time-aligning the
variable-length feature vectors such that the first days
for all patients are lined up with one another.
In our work, different pieces of each patient’s
records are extracted based on the experimental de-
sign. For example, we might extract the first day’s
worth of throughout-stay data, the first and second
days worth of throughout-stay data, and so on. The
data can then be directly compared since it has been
time-aligned.
Next, we define the feature extraction window for
patients. For MRSA patients, it starts on the day of
admission and ends n days before the MRSA diag-
nosis, n ∈ {1, . . . , 7}. For MRSA-negative patients,
there are a few alternatives for defining this window.
Prior research has used the discharge day as the end
of the risk period (Dubberke et al., 2011). However,
as the state of a patient can be expected to either im-
prove or decrease drastically near the discharge date,
this may lead to deceptive results (Wiens et al., 2012).
Instead, for the MRSA-negative patients, we use the
halfway point of each stay as the end of the risk pe-
riod or the minimum possible stay based on the ex-
perimental setup, whichever is greater.
Figure 2 shows the feature extraction window and
ending position of it for two different patients. The
optimal size of the feature extraction window and the
number of days prior to prediction are empirically de-
termined for each experiment.
Early Prediction of MRSA Infections using Electronic Health Records
159

Table 3: Throughout-stay feature descriptions.
Feature Explanation Example
Lab tests Daily average results of 20 lab tests White Blood Cell count, Potassium level
Vital signs Daily average results of 24 vital signs Heart Rate, Temperature
Services Categorical feature showing patient is on which
service that day
Cardiac Medical, Cardiac Surgery
Microbiology
tests
Daily average results of 13 microbiology tests Enterococcus Sp., Yeast
High-risk an-
tibiotics
Daily binary indicator of high-risk antibiotic pre-
scription
Cephalosporins, Fluoroquinolones
Antibiotics Daily binary indicator of antibiotic prescription Capreomycin
H2
antagonists
Daily binary indicator of H2 antagonist prescrip-
tion
Nizatidine
Proton pump
inhibitors
Daily binary indicator proton pump inhibitor pre-
scription
Rabeprazole
2.3.3 Label Generation
In supervised machine learning, each data object must
have an associated label, indicating the outcome. In
this work, the outcome is a binary flag indicating the
diagnosis of MRSA (1 for MRSA, 0 for non-MRSA),
stored in a vector with one label per patient.
2.4 Classification
In classification tasks, the goal is to divide data points
into predefined classes. For this work, there are two
distinct classes, MRSA-positive, labeled as 1, and
MRSA-negative, labeled as 0. This creates a binary
classification task, where we attempt to learn the re-
lationship between each patient’s historical EHR and
their associated label. Predicted labels were gener-
ated using three different machine learning methods:
Logistic Regression, Support Vector Machines, and
Random Forests. We evaluate these methods using a
popular holdout strategy: the algorithms were trained
on 80% of the patient records and tested on the re-
maining 20% of the patient records to ensure that the
selected models generalize to unseen patients effec-
tively. Performance estimation and hyper-parameter
selection were embedded in 5 cross validation folds
across the training set. The raw predictions generated
lie between 0 and 1, requiring transformation into ex-
actly 0’s or 1’s to be directly comparable to the binary
label vector. In this work, if a prediction is ≥ 0.5, then
it is converted to 1. Otherwise it is converted to 0.
2.4.1 L2-Regularized Logistic Regression
Logistic Regression is a classic machine learning
method based on the odds ratio of how the change
in individual features affects the outcome. This al-
gorithm is commonly used for diagnosis prediction
(Chang et al., 2011; Shang et al., 2000; Visser et al.,
2002; Wu et al., 2010). In our setting, each input is
a vector, x, containing a patient’s historical informa-
tion which will in turn be weighted by θ, a vector of
coefficients, as shown in Equation 1, where n is the
number of patients and p is the number of variables.
We also use L2-Regularization, controlled by param-
eter λ to normalize the values of θ, ensuring direct
comparisons between the variable weights. Finally,
the difference between the predictions made and the
true label vector y is minimized.
F(x) =
1
1 + e
−θ
>
x
+ λ
p
∑
i=1
θ
2
i
(1)
The task is to learn the proper coefficients that
project positively labeled data close to 1, and nega-
tively labeled data close to 0. In this setting, the value
predicted for a patient can be considered their proba-
bility of MRSA infection.
2.4.2 Soft-margin Support Vector Machine
Classification
Support Vector Machine Classification is another
popular solution to binary classification problems,
also commonly used for diagnosis (Wiens et al., 2012;
Wu et al., 2010). In contrast to Logistic Regres-
sion, this algorithm makes classifications based on
distances between data instances. In this case, we
compute the coefficients for a hyperplane that divides
the dataset based on the labels and the distance from
the hyperplane to a few select data instances, termed
support vectors. To accomplish this task, we again
tune the elements of a vector θ, which will subse-
quently be multiplied by the patient vector, x, to di-
vide the data by label. This is accomplished by min-
imizing Eq. 2, where n is the number of support vec-
HEALTHINF 2018 - 11th International Conference on Health Informatics
160

tors, x
i
is each support vector in turn, y
i
is the cor-
responding label for each support vector, λ is a regu-
larizing parameter, and b is a bias variable. The linear
kernel was used for all SVM experiments in this work.
1
n
n
∑
i=1
max
h
0, 1 − y
i
θ
>
x
i
− b
i
+ λkθk
2
2
(2)
2.4.3 Random Forests
Random Forests are the bootstrap aggregating im-
plementation of decision trees, a well known and in-
terpretable classification algorithm (Breiman, 2001).
They have been shown to be effective in predicting in-
fections (Lebedev et al., 2014; Khalilia et al., 2011) in
many domains while allowing easy access to relative
variable importances. To generate classifications, ran-
dom subsets of both data instances and variables are
iteratively used to generate decision trees and make
predictions on a training set. Then, once a set of de-
cision trees has been generated, testing instances are
input into each decision tree and the predictions from
each tree are recorded. Finally, the predictions made
by each decision tree are combined into one predic-
tion, typically via majority voting. This ensemble
learning technique emphasizes high levels of random-
ness, aiding the generalizability of our models.
2.5 Evaluation Criteria
The Receiver Operating Characteristic (ROC) Curve
quantifies the performance of a binary classifier using
the True Positive Rate (Equation 3) and False Positive
Rate (Equation 4).
True Positive Rate (TPR) =
TP
TP + FN
(3)
False Positive Rate (FPR) =
FP
TN + FP
(4)
When a binary classifier makes a probabilistic pre-
diction between 0 and 1, a decision criterion (a.k.a.
probability cutoff) decides which probabilities to as-
sign to which class. For example, setting cutoff = 0.5
means that class = 1 if probability > 0.5 while for
smaller probability values, class = 0. Based on the
decision criterion, a binary prediction can be made
and TPR (sensitivity) and FPR (1-specificity) can be
calculated. When evaluating the performance of a
clinical test, sensitivity quantifies the ability of a test
to correctly identify cases and specificity reflects the
ability of a test to correctly rule out the condition of
interest. An ROC curve is used to examine how TPR
and FPR change as the decision criterion varies from
0 to 1. The sum of the Area Under the Curve (AUC)
quantifies the ability of a classifier to distinguish be-
tween two classes. An AUC score of 0.5 indicates
a randomly-guessing classifier, and an AUC score of
1.0 indicates perfect classification.
AUC is widely used in clinical diagnosis predic-
tion and risk stratification tasks due to several ad-
vantages it brings (Hajian-Tilaki, 2013; Wiens et al.,
2012). First, it quantifies the success of a classifier
independent of a decision criterion. Second, sensitiv-
ity and specificity can be easily considered together
by examining the curve. Finally, for risk prediction
tasks, the optimal cut-off value can be determined us-
ing ROC curve analysis to determine at-risk patients.
2.6 Software and Availability
All preprocessing and machine learning are imple-
mented in Python 3.5. Specifically, Pandas 0.18
and Numpy 1.13 are used for preprocessing, Scikit-
Learn 0.18 is used to train machine learning al-
gorithms and Matplotlib 1.5 is used for visual-
izations. PostgreSQL 9.5 is used for data stor-
age and extraction. The scripts used in this work
are available at https://github.com/wpi-dsrg/MRSA-
prediction-healthinf.
3 RESULTS
3.1 On-admission Stratification
To evaluate how successfully we can predict likely
MRSA-positive patients at the time of admission, we
train a set of models based only on admission-time
data. We consider two training paradigms employ-
ing different feature sets: (1) Risk-Factor Models and
(2) Data-driven Models. Risk-factor models use only
known risk factors as their input, whereas data-driven
models use all extracted on-admission features as dis-
cussed in Section 2.3.1. By considering both of these
settings, we study the predictive power contained in
only known MRSA risk factors and how it compares
to the complete set of on-admission features.
Current clinical practice emphasizes assessment
of MRSA risk factors and observation of signs of in-
fection. From the on-admission data, the only known
risk factor as per CDC that we can capture in the EHR
data set is age. To understand its effect on MRSA di-
agnoses, we build classifiers using only age and com-
pare them to classifiers built using all on-admission
features, including age. To train these classifiers, we
use all 1,308 MRSA-positive patients and randomly
sample 1,308 MRSA-negative patients. We then split
these 2,616 patients into 80% training (2,093 patients)
Early Prediction of MRSA Infections using Electronic Health Records
161

Figure 3: Predictions using On-admission data only com-
paring known risk factors versus all available on-admission
data. Black bars indicate predictions made using only
on-admission risk factors (Age), white bars use all on-
admission data. Models were tuned on 2,093 training pa-
tients and tested on 523 unseen testing patients.
and 20% testing (523 patients). We train the algo-
rithms on the 2,093 training patients. Finally, we gen-
erate predictions for the 523 unseen patients to under-
stand how well our machine learning models general-
ize.
We show in Figure 3 that using the only on-
admission risk factor age leads to non-random pre-
dictions (AUC > 0.5) with AUC scores over 0.7 us-
ing Logistic Regression and SVM. However, they are
significantly less accurate than predictions made us-
ing all on-admission features. Support Vector Clas-
sifiers and Logistic Regression also outperform Ran-
dom Forests when considering all on-admission fea-
tures. We conclude that while age contains significant
predictive power, combining all features leads to our
best admission time MRSA predictions. The AUC
scores achieved here will also serve as a baseline for
our next experiments, as using only these features is
the minimum amount of information to base predic-
tions upon.
3.2 Throughout-stay Stratification
Throughout each patient’s stay, data are recorded that
quantify a patient’s condition. This may in turn re-
late to the risk of acquiring MRSA. To capture the
predictability of MRSA based on the current pa-
tient state, we trained machine learning models with
throughout-stay features collected throughout each
patient’s hospital stay.
To this end, we first define a baseline patient set.
This dataset consists of patients who have at least 5
days-worth of data to have a significant amount of
throughout-stay features, while not excluding many
patients. In the MIMIC III database, 998 of the total
1,308 MRSA-positive patients qualify. We randomly
subsample 998 MRSA-negative patients, creating a
balanced dataset of 1996 patients. Finally this dataset
is shuffled and split again into 80% training (1596 pa-
tients) and 20% testing subsets (400 patients). For
the following, we use this baseline dataset of 1996
patients and use 5-fold cross validation over the train-
ing patients, reporting the AUC scores for each fold.
Finally we average these scores over all 5 folds to
choose hyperparameters. We then validate the chosen
models on the unseen 400 testing patients.
3.2.1 Throughout-stay Risk-factor Model
Similar to the Risk-Factor model we train using on-
admission data, we also train a Risk-Factor model on
throughout-stay data. There are several known risk
factors for MRSA, and many of these are found in the
data recorded during inpatient hospitalization (Aure-
den et al., 2010). These risk factors include receipt
of transfusion, placing of a central line, respiratory
failure, bacteremia, organ impairment, and antibiotic
use (Table 2). We expect that these provide signifi-
cant predictive power for MRSA. To evaluate this, we
extract all known risk factors. We then train a set of
classifiers using only these risk factors as features.
Figure 4: Predictions using throughout-stay data compar-
ing known risk factors only versus all available throughout-
stay data. Black bars indicate predictions from known
throughout-stay risk factors (Table 2), while white bars in-
dicate predictions using available throughout-stay features.
Predictions are made on 400 previously unseen test cases.
Our Risk-Factor model trained on the throughout-
stay data achieve an average AUC of 0.94 as shown
in Figure 4. This is significantly higher than both
the Data-Driven models (mean AUC 0.70) and the
Risk-Factor models (mean AUC 0.62) trained on on-
admission data. This shows that throughout-stay data
is much more telling of a patient’s MRSA risk. How-
ever, there is more data available in the EHR records.
3.2.2 Throughout-stay Feature Groups
As discussed in Section 2.3.2, we propose that non-
risk factor features may contain strong predictive
HEALTHINF 2018 - 11th International Conference on Health Informatics
162

Figure 5: Throughout-stay clinical data subcategory predic-
tions. Dataset used consists of 5 days worth of throughout-
stay features for the 1996 patients who stayed over 5 days.
power. The MIMIC III database is categorized by the
type of data contained (e.g., Lab and Chart events).
These groups may each contain different predictive
power. We train predictive models on each group of
throughout-stay features to understand their respec-
tive predictive powers.
We see that there is a stark contrast between the
efficacy of these throughout-stay variable subsets, as
shown in Figure 5. The predictions made using the
Laboratory Events, Medication, or Services features
are far more accurate than those made using only
Chart Events or Microbiology Events. This indicates
that certain throughout-stay features should receive
particular attention in clinical practice.
3.2.3 Data-driven Model
After seeing that there is high predictive power con-
tained in non-risk factor data, we train a third set of
models using all throughout-stay features for the same
baseline patient cohort. We then compare the rela-
tive effectiveness of only leveraging known risk fac-
tors versus all available EHR data.
As seen in Figure 4, embracing a data-driven ap-
proach, our models achieve an even higher AUC than
the Risk-Factor model on the throughout-stay data.
These results indicate that even though there exist
well known risk factors for MRSA, machine learning
algorithms still benefit from additional data available
in EHR systems.
3.3 Rectangularization Strategies on
Throughout-stay Data
We have shown in Section 3.2.3 that throughout-stay
features contain more predictive power than only on-
admission features. However, throughout-stay data is
not as straightforward to use as on-admission data in
terms of feature extraction. Feature extraction from
throughout-stay data inherently creates one problem:
it requires a tabular representation, i.e., rectangular-
ization of data. Patients staying in the hospital for
different number of days create different amount of
data, hence different number of features we extract
for each patient.
To choose the rectangularization method, we con-
sider two parameters in these experiments: (1) how
far ahead from diagnosis to attempt to generate pre-
dictions and (2) which days to use to make these pre-
dictions. Varying these time-slice extraction param-
eters has the potential to dramatically alter classifier
performance.
3.3.1 Time-slice Extraction
To understand how each of these parameters affects
classification accuracy, we first extract 1402 patients
who either get MRSA after their 7th day in the hos-
pital, or who are MRSA-negative but stay longer than
7 days. This way we have a large patient set, all of
whom have significant amounts of days spend in the
hospital. We use these patients for the following ex-
periments. First, we hold the number of days-worth
of data extracted constant, and iteratively make pre-
dictions using data from earlier and earlier in each
patient’s stay. This way, we can understand the rela-
tionship between accuracy and the time of prediction.
Next, we repeat this for different numbers of days-
worth of data depending on the number of days avail-
able. For instance, if we extract 3 days-worth of data,
we make predictions up to 5 days prior to diagnosis.
Two charts from these experiments are shown in
Figure 6. These charts depict results of the experi-
ments where we use 1 day worth of data and make
predictions for {1, . . . , 7} days prior to diagnosis and
use 4-days-worth of data and make predictions for
{1, . . . , 4} days prior to diagnosis, respectively. In
both figures, we see a decrease in the AUC’s as we
achieve predictions farther in advance. As expected,
best predictions are made 1 day prior to diagnosis
while predictions made on the farthest day were still
respectable. However, AUC values remain high even
for the farthest predictions. This implies that signals
of MRSA are present in the data far in advance of the
actual diagnosis. Also, since predictions using 1 day
of data were on average lower than those made using
3 days of data, using more data tended to improve the
overall AUC values.
Early Prediction of MRSA Infections using Electronic Health Records
163
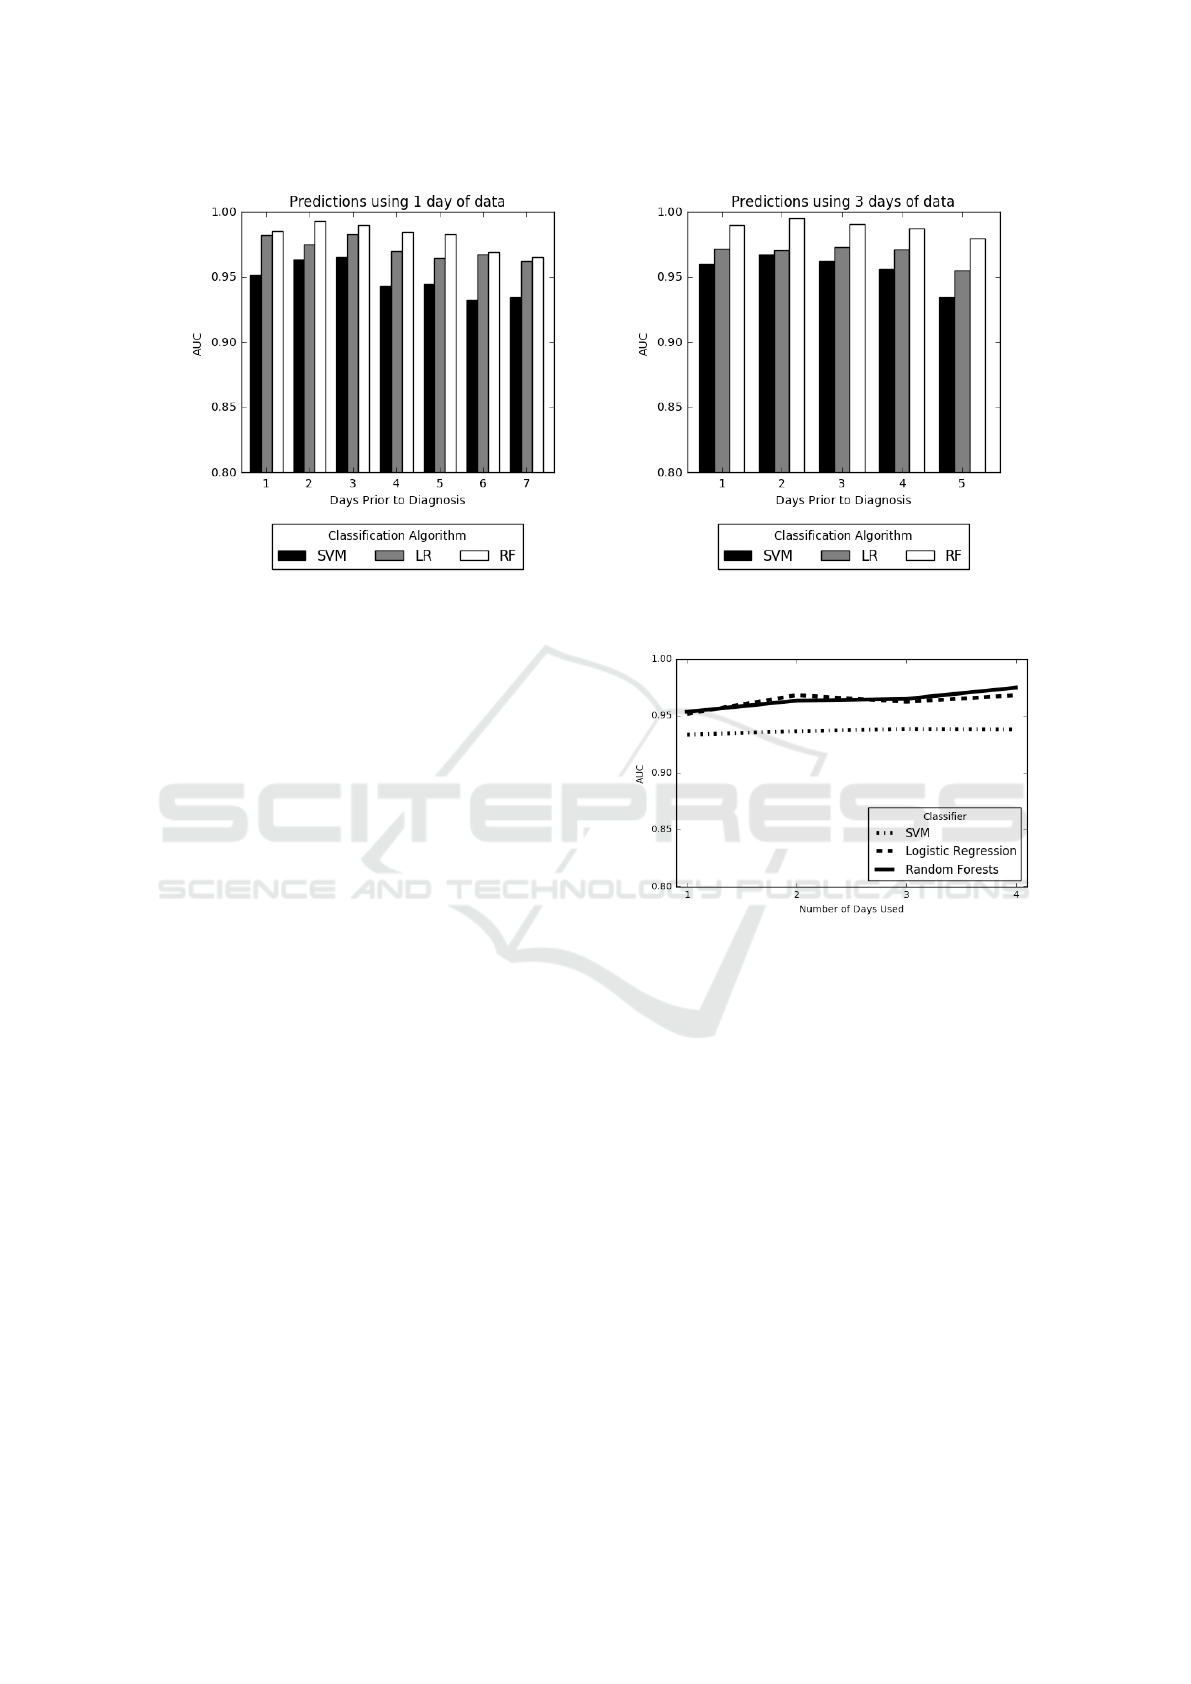
Figure 6: Prediction using days up until diagnosis. We vary the number of days before MRSA diagnosis the risk scores are
generated. Experiments shown are for 1402 patients who stayed more than 7 days in the ICU.
3.4 Optimizing Rectangularization for
Early MRSA Prediction
A recurring challenge in this domain is that a predic-
tion made the day before diagnosis will likely be ac-
curate but not particularly clinically actionable. On
the other hand, a prediction made at the time when a
patient is admitted will likely be inaccurate, but could
potentially lead to the most effective clinical actions.
Therefore, we next attempt to optimize our classifiers
to strike a balance between these two possibilities by
exploring predictive models trained in both situations
by considering the optimal prediction strategy: gener-
ating risk scores based only on the beginning of each
patient’s stay. In this setting, if a prediction is made
far enough in advance, caregivers can modify their ac-
tions to prevent the spread of infections. Here, the
task is to uncover how predictive the beginning of pa-
tient stays are, and how few days we can use to make
adequate predictions. Ideally, using only the first few
days worth of data for a patient will lead to an accu-
rate prediction of their likelihood for MRSA.
To train these models, we first extract all patients
who stayed 7 or more days in the hospital. Thus,
we have many patients (1402) who have significantly
long stays. We then generate predictions using only
their first day of data and record the AUC scores. We
then repeat this process using first 2, 3, and 4 days of
these patients’ stays. We stopped at 4 days as the goal
in these experiments to predict the infection early and
there are patients in our cohort who are diagnosed on
the 8th day.
The results from these experiments are displayed
in Figure 7. We see that with only 1 day’s worth of
Figure 7: Predictions using increasing number of days start-
ing at the beginning of each patient’s stay.
time-variant data added to the on-admission data, we
achieve an AUC of over 0.95 with Random Forests,
indicating very strong performance from the binary
classifiers far in advance of any MRSA diagnoses. As
we use more days of data, we achieve a nearly per-
fect AUC. However, we note that since these classi-
fiers are making predictions for all patients who have
7 days of data, some of the 4-day predictions are pre-
dicting only 3 days in advance. These experiments in-
dicate that we can make accurate early predictions for
MRSA, which is more actionable than making strong
predictions close to the date of diagnosis.
4 DISCUSSION
By accurately assessing MRSA infection risk using
information recorded long before the time of clinical
diagnosis, we have shown that there are strong signals
HEALTHINF 2018 - 11th International Conference on Health Informatics
164

in EHR data permitting early MRSA infection pre-
diction. The establishment of a MRSA infection risk
prediction system using the methods presented in this
paper could offer new data-driven insights to inform
clinical decisions and enhance patient outcomes. The
predictions generated by our method permit health-
care providers to identify patients as either likely or
unlikely to develop a MRSA infection at the time
of admission and later throughout their hospital stay.
While these methods can make an almost perfect pre-
diction the day before diagnosis, it is even more clin-
ically impactful to be able to deliver an accurate pre-
diction many days before diagnosis. In this study, we
show that some patients can be reliably classified us-
ing only on-admission data, including demographic
and stay-specific information (e.g. admission loca-
tion). For other patients, more data is required, but
typically within the first few days of a patient’s stay,
an accurate risk stratification can be generated, up to
an AUC score of over 0.95.
The goal of an intelligent MRSA infection predic-
tion system is to support clinical decision-making and
inform infection control efforts by leveraging infor-
mation contained within EHR data. Currently, most
hospitals in the United States have EHR systems in
place, with the most popular system being Epic (Jones
et al., 2010). In practical use, MRSA risk scores could
be communicated to healthcare providers through re-
porting systems integrated with hospital EHR sys-
tems, thus allowing for ongoing system training and
easy provider access. Integrating additional informa-
tion technology with existing EHR systems is now
well-recognized as a key strategy for improving pa-
tient care while saving costs (Murdoch and Detsky,
2013).
Predictive analysis using data directly retrieved
from EHR systems can be integrated into healthcare
work processes in several ways. At the individual pa-
tient level, warning reports generated when a patient’s
MRSA-acquisition risk score exceeds a set warning
threshold can provide useful information for physi-
cians, nurses, and other healthcare providers. Based
on clinical context, providers can decide if additional
studies or labs are indicated, if isolation precautions
should be instituted, or if empirical antibiotic therapy
should be started. Alternatively, intelligent systems
might also supply information supportive of conser-
vative care choices, such as continued observation.
While the use of signals detected within EHR data
for patient risk stratification and diagnosis requires
further clinical validation, this strategy offers great
promise for developing cohesive systems in which re-
trieval, analysis, and reporting of data would be con-
tained within the EHR software in clinical use. Inte-
gration of health records systems with advanced sig-
nal detection functionality could then permit not only
the recognition of specific medical diagnoses but also
the active identification of risk factors and prognostic
indicators within facilities and among unique popula-
tions.
A limitation of the current study is that our data
come from intensive care units in one hospital in the
United States. As such, these patients do not equally
represent the conditions of general hospitalized pop-
ulations or the demographics of other regions. The
stay-specific data (See Table 1) indicate that while
there are diverse groups within the data set, the major-
ity of patients are ethnically white and the gender is
predominantly male. In the future, we intend to evalu-
ate the performance of our MRSA risk prediction sys-
tem using multiple EHR datasets and to ensure gener-
alizability through transfer learning techniques. We
also plan to expand these models to predict multi-
ple HAIs concurrently to better serve current hospital
needs. An all-encompassing prediction system is the
ultimate future goal of this research.
5 CONCLUSION
Early-warning systems can be used in real time for
risk stratification as well as early HAI detection. In
this study, a prediction system was designed to gener-
ate MRSA risk scores from easily available EHR data.
Clinical time series data, mixed with data collected
upon admission, contain strong predictive power for
MRSA infection, even for risk scores generated far
in advance of MRSA diagnosis dates. Three binary
classification algorithms were trained using histori-
cal EHR data, leading to highly accurate predictions
(Mean AUC = 0.98) on the day before diagnosis. We
maintained high performance (Mean AUC > 0.95 )
even when forcing early predictions by using only the
first few days of patients’ stays. Both of these classifi-
cation settings lead to results far superior to our base-
line classifiers trained using only on-admission data
(Accuracy = 0.725, AUC = 0.665). We also consid-
ered the predictive power contained in different types
of clinical data, concluding that known MRSA risk
factors are not sufficient when generating predictions
and that the Laboratory, Medication, and Service-
related variables are the most indicative of MRSA.
We successfully trained machine learning algorithms
to detect MRSA far in advance of MRSA diagnosis
dates by using on-admission data mixed with the first
few days of throughout-admission data. This led to
reliable predictions. The evidence indicates that an
early warning system could be implemented for hos-
Early Prediction of MRSA Infections using Electronic Health Records
165

pital patients, to be updated with stay progression,
generating reliable daily risk scores to aid clinical
decision-making and facilitate preventive measures.
ACKNOWLEDGEMENTS
Thomas Hartvigsen thanks the US Department of Ed-
ucation for supporting his PhD studies via the grant
P200A150306 on “GAANN Fellowships to Support
Data-Driven Computing Research”, while Cansu Sen
thanks WPI for granting her the Arvid Anderson
Fellowship (2015-2016) to pursue her PhD studies.
Sarah Brownell thanks the National Science Founda-
tion for undergraduate research funding for Summer
2017 through the NSF REU grant #1560229 entitled
”REU SITE: Data Science Research for Safe, Sustain-
able and Healthy Communities”. We also thank the
DSRG and Data Science Community at WPI for their
continued support and feedback.
REFERENCES
Aureden, K., Arias, K., Burns, L., et al. (2010). Guide
to the elimination of methicillin-resistant staphylococ-
cus aureus (mrsa): Transmission in hospital settings.
washington, dc. APIC.
Breiman, L. (2001). Random forests. Machine learning,
45(1):5–32.
Celi, L. A., Mark, R. G., Stone, D. J., and Montgomery,
R. A. (2013). “big data” in the intensive care unit.
closing the data loop. American Journal of Respira-
tory and Critical Care Medicine, 187(11):1157–1160.
Chang, Y., Yeh, M., Li, Y., Hsu, C., Lin, C., Hsu, M., and
Chiu, W. (2011). Predicting hospital-acquired infec-
tions by scoring system with simple parameters. PloS
One, 6(8):e23137.
CMS (2011). Electronic health records (ehr) incentive pro-
grams. https://www.cms.gov/Regulations-and-Guida
nce/Legislation/EHRIncentivePrograms/index.html.
Congress, U. S. (2009). American recovery and reinvest-
ment act. www.healthit.gov/policy-researchers-
implementers/health-it-legislation.
Dantes, R., Mu, Y., Belflower, R., Aragon, D., Dumyati,
G., Harrison, L. H., Lessa, F. C., Lynfield, R., Nadle,
J., Petit, S., et al. (2013). National burden of inva-
sive methicillin-resistant staphylococcus aureus infec-
tions, united states, 2011. JAMA Internal Medicine,
173(21):1970–1978.
Dubberke, E. R., Yan, Y., Reske, K., Butler, A., Doherty,
J., Pham, V., and Fraser, V. (2011). Development and
validation of a clostridium difficile infection risk pre-
diction model. Infection Control & Hospital Epidemi-
ology, 33(4):360–366.
Dutta, R. and Dutta, R. (2006). Maximum probability rule
based classification of mrsa infections in hospital en-
vironment: Using electronic nose. Sensors and Actu-
ators B: Chemical, 120(1):156–165.
Fukuta, Y., Cunningham, C. A., Harris, P. L., Wagener,
M. M., and Muder, R. R. (2012). Identifying the
risk factors for hospital-acquired methicillin-resistant
staphylococcus aureus (mrsa) infection among pa-
tients colonized with mrsa on admission. Infec-
tion Control & Hospital Epidemiology, 33(12):1219–
1225.
Hajian-Tilaki, K. (2013). Receiver operating characteristic
(roc) curve analysis for medical diagnostic test evalua-
tion. Caspian Journal of Internal Medicine, 4(2):627.
Jensen, P. B., Jensen, L. J., and Brunak, S. (2012). Mining
electronic health records: Towards better research ap-
plications and clinical care. Nature Reviews. Genetics,
13(6):395.
Johnson, A. E., Pollard, T. J., Shen, L., Lehman, L.-w. H.,
Feng, M., Ghassemi, M., Moody, B., Szolovits, P.,
Celi, L. A., and Mark, R. G. (2016). Mimic-iii,
a freely accessible critical care database. Scientific
Data, 3.
Jones, D. A., Shipman, J. P., Plaut, D. A., and Selden, C. R.
(2010). Characteristics of personal health records:
Findings of the medical library association/national
library of medicine joint electronic personal health
record task force. JMLA: Journal of the Medical Li-
brary Association, 98(3):243.
Khalilia, M., Chakraborty, S., and Popescu, M. (2011). Pre-
dicting disease risks from highly imbalanced data us-
ing random forest. BMC Medical Informatics and De-
cision Making, 11(1):51.
Lebedev, A., Westman, E., Van Westen, G., Kramberger,
M., Lundervold, A., Aarsland, D., Soininen, H.,
Kłoszewska, I., Mecocci, P., Tsolaki, M., et al. (2014).
Random forest ensembles for detection and prediction
of alzheimer’s disease with a good between-cohort ro-
bustness. NeuroImage: Clinical, 6:115–125.
Maree, C., Daum, R., Boyle-Vavra, S., Matayoshi,
K., and Miller, L. (2007). Community-associated
methicillin-resistant staphylococcus aureus isolates
and healthcare-associated infections. Emerging Infec-
tious Diseases, 13(2):236.
Murdoch, T. and Detsky, A. (2013). The inevitable applica-
tion of big data to health care. Jama, 309(13):1351–
1352.
Neu, H. C. (1992). The crisis in antibiotic resistance. Sci-
ence, 257(5073):1064–1074.
Nseir, S., Grailles, G., Soury-Lavergne, A., Minacori, F.,
Alves, I., and Durocher, A. (2010). Accuracy of
american thoracic society/infectious diseases society
of america criteria in predicting infection or coloniza-
tion with multidrug-resistant bacteria at intensive-care
unit admission. Clinical Microbiology and Infection,
16(7):902–908.
Raghupathi, W. and Raghupathi, V. (2014). Big data an-
alytics in healthcare: Promise and potential. Health
Information Science and Systems, 2(1):3.
HEALTHINF 2018 - 11th International Conference on Health Informatics
166

Sen, C., Hartvigsen, T., Rundensteiner, E., and Claypool,
K. (2017). Crest - risk prediction for clostridium diffi-
cile infection using multimodal data mining. Lecture
Notes in Computer Science, pages 49–60. Springer.
Shang, J. S., Lin, Y. E., and Goetz, A. M. (2000). Diag-
nosis of mrsa with neural networks and logistic re-
gression approach. Health Care Management Science,
3(4):287.
Sintchenko, V., Coiera, E., and Gilbert, G. L. (2008). Deci-
sion support systems for antibiotic prescribing. Cur-
rent Opinion in Infectious Diseases, 21(6):573–579.
Ventola, C. L. (2015). The antibiotic resistance crisis: Part
1: Causes and threats. Pharmacy and Therapeutics,
40(4):277.
Visser, H., le Cessie, S., Vos, K., Breedveld, F. C., and
Hazes, J. M. (2002). How to diagnose rheumatoid
arthritis early: a prediction model for persistent (ero-
sive) arthritis. Arthritis & Rheumatology, 46(2):357–
365.
Weiner, L., Webb, A., Limbago, B., Dudeck, M., Pa-
tel, J., Kallen, A., Edwards, J., and Sievert, D.
(2016). Antimicrobial-resistant pathogens associated
with healthcare-associated infections: summary of
data reported to the national healthcare safety net-
work at the centers for disease control and prevention,
2011–2014. Infection Control & Hospital Epidemiol-
ogy, 37(11):1288–1301.
Wiens, J., Guttag, J., and Horvitz, E. (2012). Learning
evolving patient risk processes for c. diff. coloniza-
tion. In ICML Workshop on Machine Learning from
Clinical Data.
Wu, J., Roy, J., and Stewart, W. F. (2010). Prediction
modeling using ehr data: challenges, strategies, and a
comparison of machine learning approaches. Medical
Care, 48(6):S106–S113.
Early Prediction of MRSA Infections using Electronic Health Records
167
