
Fully Automatic Faulty Weft Thread Detection using a Camera System
and Feature-based Pattern Recognition
Marcin Kopaczka
1
, Marco Saggiomo
2
, Moritz Güttler
1
, Thomas Gries
2
and Dorit Merhof
1
1
Institute of Imaging and Computer Vision, RWTH Aachen University, Aachen, Germany
2
Institut für Textiltechnik, RWTH Aachen University, Aachen, Germany
Keywords:
Automated Visual Inspection, Industrial Image Processing, Air-jet Weaving Machine.
Abstract:
In this paper, we present a novel approach for the fully automated detection of faulty weft threads on air-
jet weaving machines using computer vision. The proposed system consists of a camera array for image
acquisition and a classification pipeline in which we use different image processing and machine learning
methods to allow precise localization and reliable classification of defects. The camera system is introduced
and its advantages over other approaches are discussed. Subsequently, the processing steps are motivated
and described in detail, followed by an in-depth analysis of the impact of different system parameters to
allow chosing optimal algorithm combinations for the problem of faulty weft yarn detection. To analyze the
capabilities of our solution, system performance is thoroughly evaluated under realistic production settings,
showing excellent detection rates.
1 INTRODUCTION
Automated weaving is a key technology in modern in-
dustrial textile production. In weaving, a number of
parallel yarns (the so-called warp yarns) oriented and
tensioned in production direction is displaced verti-
cally by a mechanical frame. The most basic weav-
ing pattern, the plain weave, is formed by moving ev-
ery second warp yarn upwards while displacing the
other yarns downwards. The space between the dif-
ferently displaced warp yarns is the shed. The weav-
ing itself is the process of inserting a further yarn
thread, the weft yarn, into the shed perpendicular to
the warp yarns. After weft yarn insertion the positions
of top and bottom yarns are switched and the next
weft yarn is inserted. Among weaving machines, air-
jet weaving machines are widely used due to their su-
perior productivity of up to 1500 insertions per minute
and their high reliability. In air-jet weaving, the weft
yarn is inserted using compressed air. Additional air
ducts maintain a defined air flow along the whole shed
width, allowing the weft yarn to quickly move be-
tween the warp yarns. However, in some cases the
weft yarn may not reach its destination as it collides
with a warp yarn or its trajectory is altered by other
causes. In these cases, the weft yarn remains in the
shed and needs to be removed before weaving can
continue. Weaving faulty weft threads into the textile
would result in defects that affect the optical appear-
ance and mechanical properties of the fabric. To avoid
this problem, air-jet weaving machines are equipped
with a sensor that detects whether the weft yarn has
been inserted correctly into the shed. More precisely,
weft yarn defects are detected with photoelectric or
laser-based weft sensors such as (Wada, 1984) that
detect whether the weft yarn arrived correctly at the
receiving end of the machine. While currently ma-
chine or yarn status are not monitored using computer
vision systems, a large number of publications with
focus on inspection of the produced textile itself have
been published. The reasons behind fabric inspection
being such an active research area are two-fold: First,
textile inspection is currently often a manual proce-
dure performed by human workers, making it an ex-
pensive and time-consuming task. At the same time,
trials have shown that human performance in textile
inspection degrades quickly and that humans find no
more than 60% of defects in textile fabric (Karayian-
nis et al., 1999). This emphasizes the need for au-
tomated approaches that could help increasing defect
detection rates and decrease quality control expenses.
The second reason is that textile inspection is a prob-
lem that allows for a wide variety of approaches from
different computer vision disciplines. Therefore, a
broad range of algorithms has been developed and
adapted to allow localizing and identifying defects
124
Kopaczka, M., Saggiomo, M., Güttler, M., Gries, T. and Merhof, D.
Fully Automatic Faulty Weft Thread Detection using a Camera System and Feature-based Pattern Recognition.
DOI: 10.5220/0006591301240132
In Proceedings of the 7th International Conference on Pattern Recognition Applications and Methods (ICPRAM 2018), pages 124-132
ISBN: 978-989-758-276-9
Copyright © 2018 by SCITEPRESS – Science and Technology Publications, Lda. All rights reserved
in textiles. Notable reviews include (Kumar, 2008),
where also a taxonomy of fabric inspection methods is
introduced, furthermore in (Ngan et al., 2011), where
the authors extend the range of algorithms to include
methods that allow defect detection in patterned fab-
rics, and most recently in the work by (Hanbay et al.,
2016), which also puts emphasis on the image acqui-
sition and imaging hardware. While the devices used
for weft yarn monitoring such as the laser sensors de-
scribed above can be defined as optical sensors, their
output signal is purely scalar and allows for no im-
age processing at all. If a faulty weft yarn is detected,
then textile production is stopped and an automated
weft yarn removal procedure is initiated. However,
while the error detection itself is highly reliable, the
faulty yarn removal succeeds only in 80% of the cases
where a defect is detected, making the system not ap-
plicable for industrial textile production.
To increase system reliability, we therefore intro-
duce a camera-based inspection system that allows to
check if a faulty weft yarn is present in the shed after a
weft yarn defect has been detected. A combination of
specialized imaging hardware and an image process-
ing pipeline developed especially for this task is pre-
sented. We analyze the effect of using different meth-
ods for image preprocessung that allow enhancing the
visual appearance of faulty weft threads in combi-
nation with image descriptors sensitive to structures
which can be found in our image data. The system
is described in detail and its performance on a real
industrial weaving machine is evaluated throughly,
allowing to define the optimal pipeline to solve the
problem of faulty weft yarn detection. To the best
of our knowledge, our approach is the first to allow
highly reliable weft yarn defect detection using com-
puter vision.
2 PREVIOUS WORK
A specific subgroup of approaches related closely to
our research area are systems for online (or, in this
specific context, onloom) analysis of woven fabrics
using a camera system attached directly to the loom.
An early approach has been presented by (Sari-Sarraf
and Goddard, 1999), where yarn density is measured
on the loom by applying Fourier transform to im-
ages acquired by a camera attached to the machine.
In (Stojanovic et al., 2001), the authors introduce a
system for onloom defect detection in woven fab-
rics that is tested on a loom mockup. The algo-
rithms use texture analysis to detect defects such as
holes in the textile. The currently most advanced sys-
tem has been introduced in (Schneider et al., 2014),
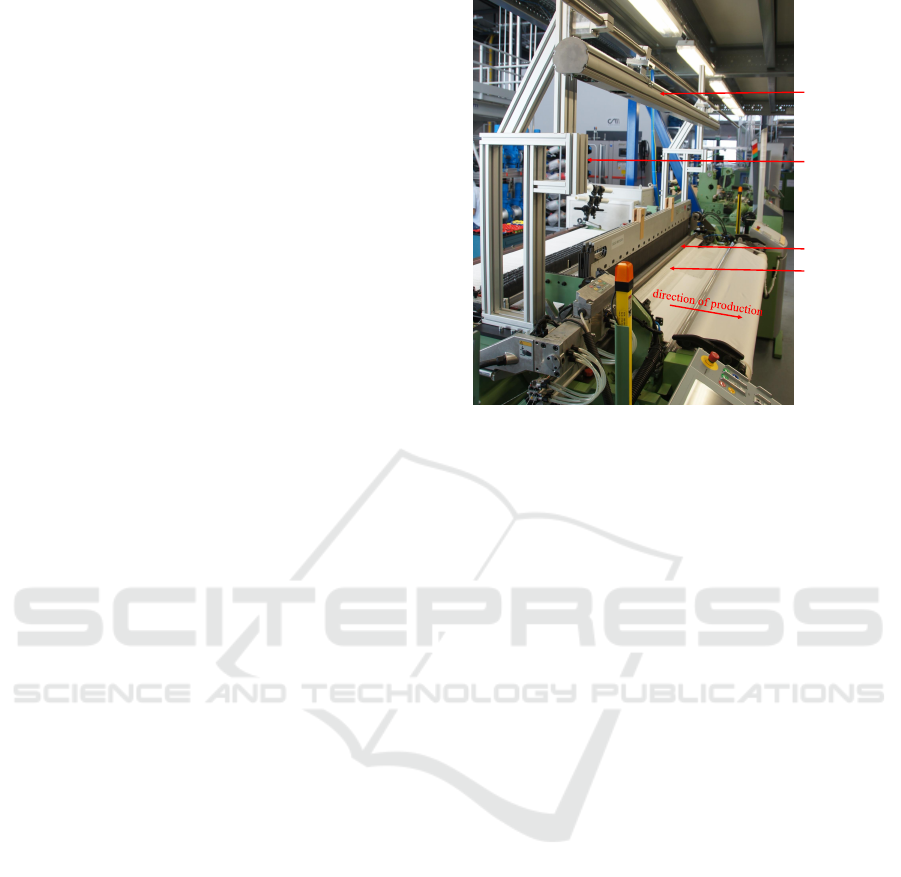
camerasystem
shed
reed
mounting structure
Figure 1: The visual inspection system mounted to an auto-
matic weaving machine.
where a vibration-stabilized high resolution camera
traverses along the loom and allows capturing images
with a spatial resolution of 1000 dpi. Real-time GPU-
enhanced image processing algorithms allow the pre-
cise localization of single yarns in the produced fabric
and thereby the detection of various types of challeng-
ing defects.
In contrast to previously published methods, our
method does not analyze the produced fabric, but in-
stead it focuses on the detection of faulty weft yarns
in the shed, allowing the operator to react and correct
the machine state before any defective fabric is pro-
duced. This approach is highly innovative as it allows
to increase product quality by avoiding defects caused
by weaving defective yarns into the product.
3 MATERIALS AND METHODS
This section gives detailed information on the devel-
oped methods. We start with a description of the
image acquisition setup and basic data preprocess-
ing steps, followed by our processing pipeline for im-
age enhancement, feature extraction and classifica-
tion. Finally, we describe the decision rule used to
compute the confidence if an alert should be raised or
not.
3.1 Overview
Fig. 3 shows an overview of our pipeline. Images
are acquired using a multi-camera array and subse-
quently processed in order to allow feature extraction
Fully Automatic Faulty Weft Thread Detection using a Camera System and Feature-based Pattern Recognition
125
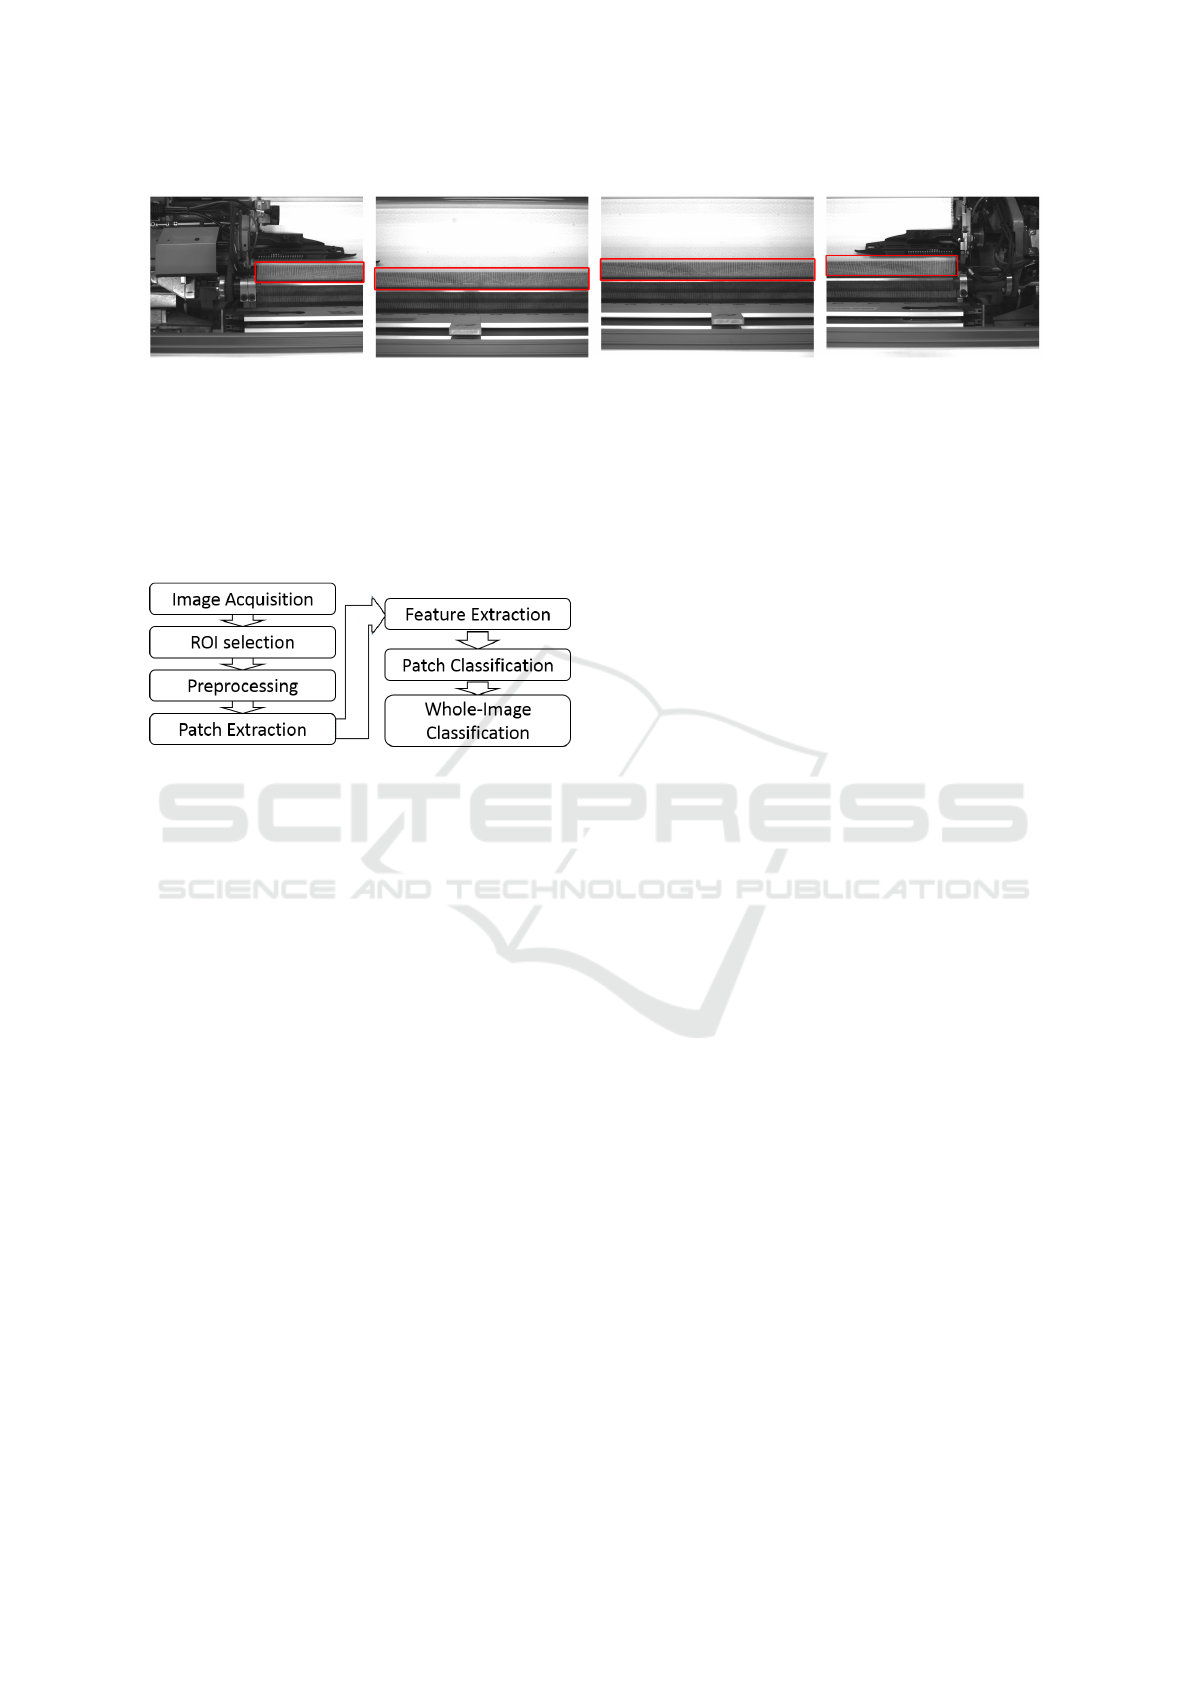
Figure 2: Top view of the shed as captured by the four cameras. The used ROIs are outlined in red (high-resolution images,
best viewed in color on a computer display).
and classification of small image patches. Based on
the patch-based classification, a final per-image clas-
sification is implemented to automatically decide if
an image contains a faulty weft yarn. The following
subsections provide a more detailed description of the
implemented steps.
Figure 3: Overview of the implemented pipeline.
3.2 Camera Setup and Image
Preparation
Image acquisition was performed using an array of
four industrial cameras. The cameras were spaced
equidistantly in a sensor bar above the shed with the
cameras facing downward, allowing a clear view at
the shed’s contents at a resolution of 200 dots per inch
(dpi). Implementing an array of several cameras in-
stead of a single fixed or moving camera yields sev-
eral benefits:
• The system can be modified easily to fit different
machine widths by varying the number of cameras
used.
• Using several cameras allows to better match the
monitored area to the strongly elongated shape of
the shed.
• The cameras forming the array may have low res-
olutions whild still providing a high resolution
composite, allowing working without specialized
high-resolution cameras
• While the same benefits could have been gained
by using a single moving camera as in (Schnei-
der et al., 2014), constructing a traversing system
poses additional challenges such as camera posi-
tion retrieval and potentially motion blur that can
be avoided by using an array of cameras mounted
in fixed positions.
Since the area captured by the cameras was still larger
than the shed itself, fixed regions of interest (ROI)
were defined for each of the cameras in which all re-
gions except the shed were masked out. All image
analysis was performed on the ROIs only, ignoring
the non-shed parts of the image. Figure 2 shows full
images and the respective ROIs used for further pro-
cessing.
3.3 Preprocessing
With the images ready for further analysis, several
preprocessing steps aimed at enhancing defect ap-
pearance have been implemented. Since the domi-
nant structure in defect-free images is the repeating,
vertical pattern formed by the weft yarns and defects
break this regularity by introducing non-vertical com-
ponents, our implemented preprocessing steps aim at
increasing the contrast between defect and non-defect
areas by enhancing defect appearance. To this end,
we take advantage of the direction difference and use
orientation-sensitive preprocessing methods. A sam-
ple image and filter results are shown in Fig. 4. The
filters include:
• Basic edge and contour detectors, namely the
Sobel and Prewitt gradient operators. Computa-
tionally efficient, these basic filter kernels allow a
good enhancement of horizontal structures when
applied in their horizontal form. Since they are
known to be sensitive to noise and grain in the im-
age data, we also analyzed the impact of adding an
additional Gaussian smoothing filter before com-
puting the gradients. A sample result is shown in
Fig. 4b.
• Gabor Filters, a group of algorithmically de-
fined filter kernels that allow enhancing image
structures with a defined orientation and length
(Bovik et al., 1990). In contrast to the basic Sobel
and Prewitt filters, Gabor filters allow more fine-
grained control over the type of structure to be
enhanced thanks to their multiparametric nature.
ICPRAM 2018 - 7th International Conference on Pattern Recognition Applications and Methods
126
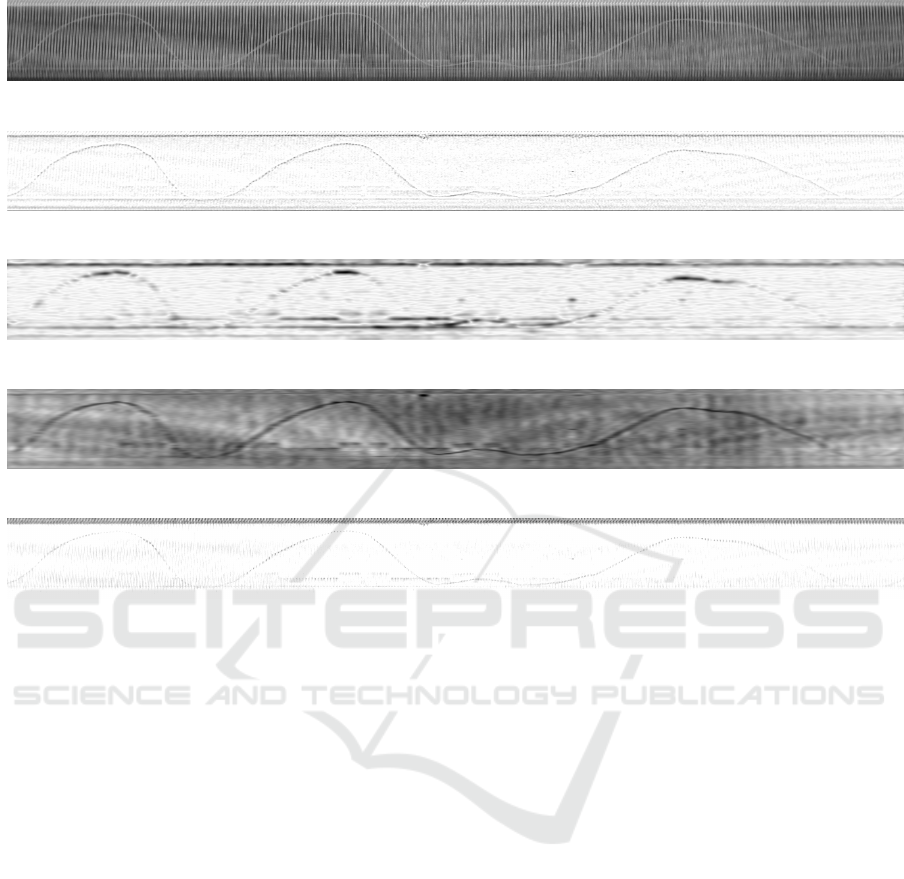
(a) Unprocessed original image
(b) Sobel filter after Gaussian smoothing
(c) Gabor filtering
(d) Directional lowpass using two-dimensional discrete Fourier transform (DFT)
(e) Directional unsharp masking by subtracting DFT result from original image
Figure 4: Visual appearance of the different preprocessing methods applied to the images in order to enhance defect visibility.
Preprocessing results are shown with inverted gray values to increase contrast for the reader.
While commonly used in groups as filter banks
for texture and image classification, in our pre-
processing implementation we use only horizon-
tal Gabor filters with a constant length to enhance
horizontal structures in the images as shown in
Fig. 4c.
• Spectral lowpass filters based on Discrete
Fourier Transform (DFT) that allow controlling
filter characteristics in a very fine-grained man-
ner. In our case, the filter is applied by comput-
ing the DFT of the image, centering the resulting
spectrum and multiplying it with a binary mask
designed to eliminate vertical structures in the im-
age while at the same time enhancing horizontal
patterns. The filtered image is the result of apply-
ing inverse DFT to the lowpass-filtered spectrum
(Fig. 4d). This approach can be extended to a
directional lowpass mask by subtracting the low-
pass result from the original image. In our case,
this solution eliminates the regular pattern formed
by the warp yarns and thereby allows further en-
hancement of the relevant weft yarns (Fig. 4e).
3.4 Feature Extraction and Image
Classification
Classification is performed by dividing the prepro-
cessed images into small patches, applying a feature
extraction method and feeding the resulting feature
vectors into a machine learning-based classifier. All
feature extractors and classifiers used in this work will
be described in this section. Since the classifiers ap-
plied are supervised learning methods, a method for
labeling each of the patches differently depending on
whether or not they show defective warp threads has
been developed as well. This section gives a detailed
overview of all steps involved in the classification
chain.
First, we extract small non-overlapping patches sized
30 × 30 pixels from the ROIs. Working on patches
instead of whole images yields several advantages:
First, we drastically increase the amount of training
data for the classifiers while at the same time reduc-
ing feature vector length, both being important factors
for successful training of classifiers with greater reli-
ability and faster classification speed. Furthermore,
Fully Automatic Faulty Weft Thread Detection using a Camera System and Feature-based Pattern Recognition
127
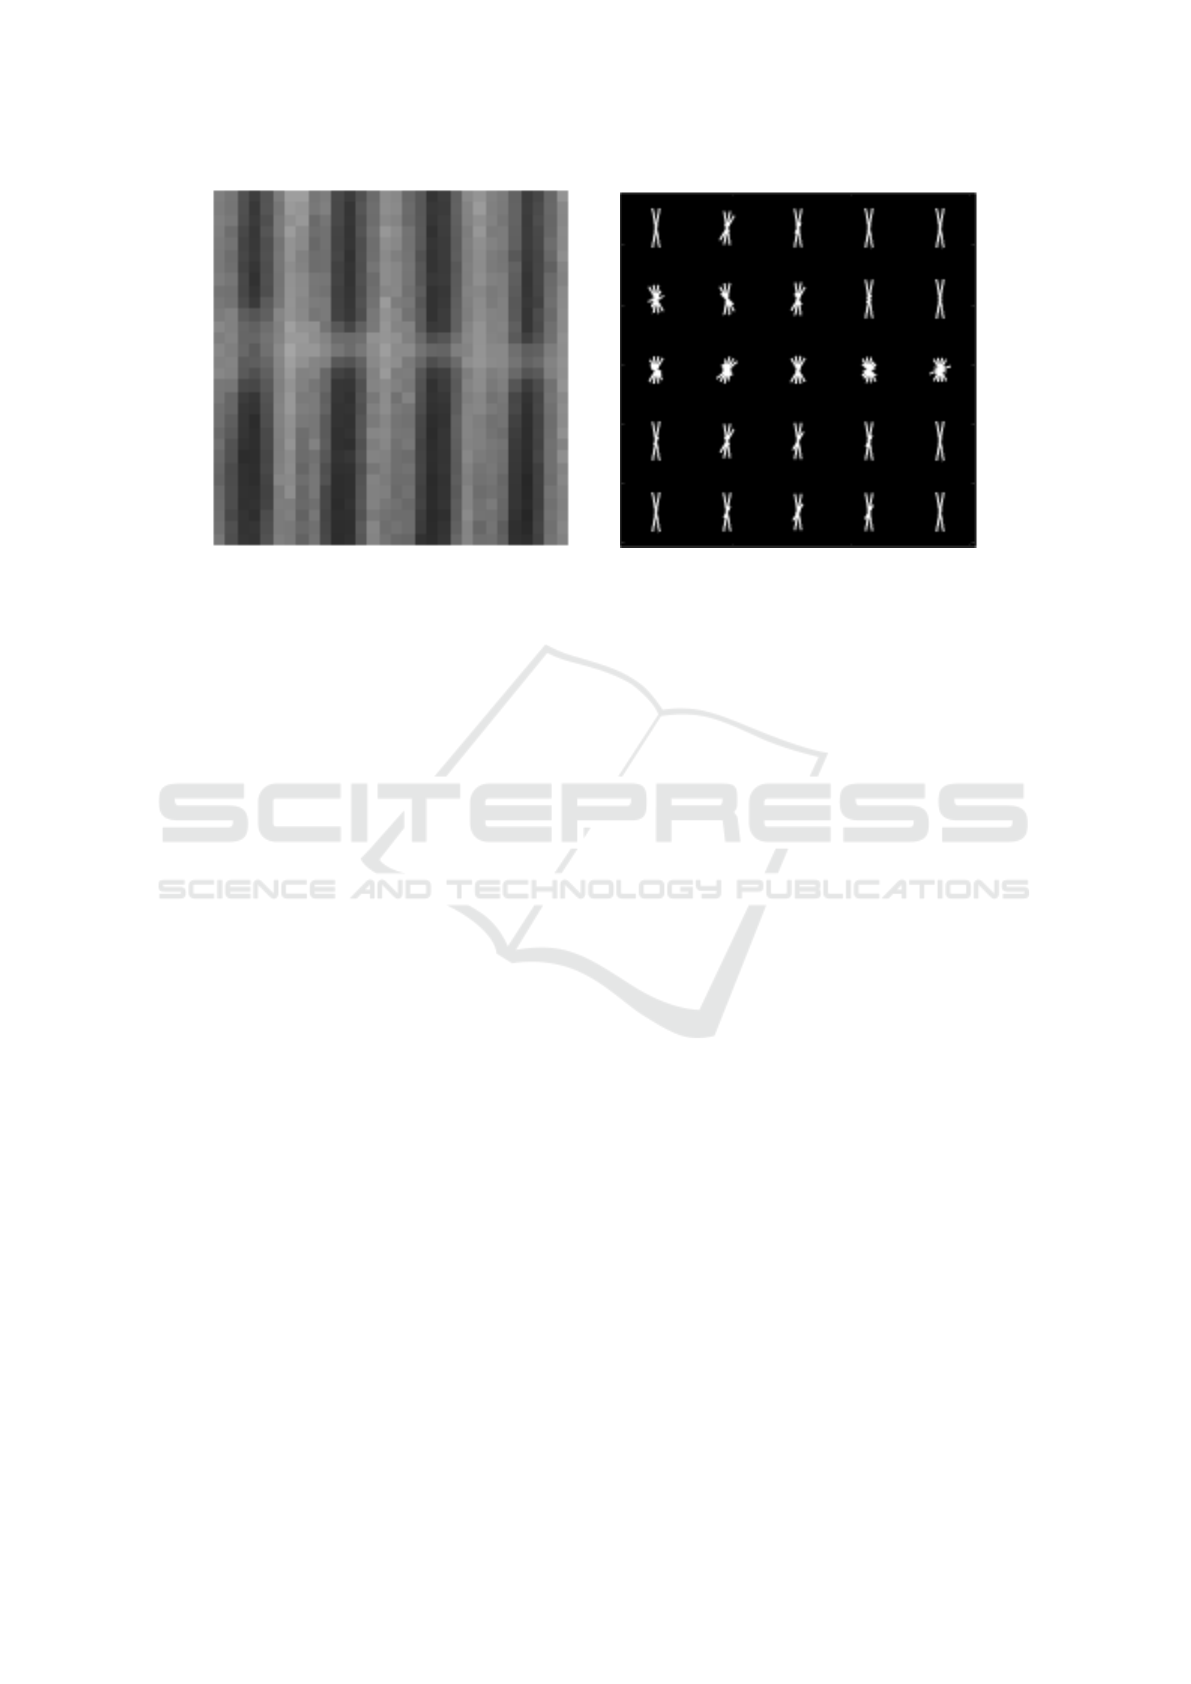
(a) Patch (b) HOG Visualization
Figure 5: Feature extraction is done on patches with 30 × 30 pixels
a classification based on small image fragments al-
lows a precise localization of defect warp yarns,
thereby allowing analysis of defect positions for fur-
ther processing. After patches have been extracted,
we assign a label to each patch depending on the
amount of defective thread visible in the center area of
the patch. Preliminary experiments were conducted
and we found that declaring a patch defective if it con-
tains at least 50 defective pixels is a well-performing
labeling rule.
After patches have been extracted and labeled,
feature extraction is applied to allow better descrip-
tions of the image data. We used three feature de-
scriptors that either have been proven to perform well
in textile image analysis tasks or have properties that
allow enhancing visual structures that are occur in our
data:
• The pixel intensity values themselves. Feeding
the image directly into the classifier requires no
additional computing time for feature extraction
and allows to analyze absolute intensities and lo-
cal structures (Fig. 5a), however the classifier can-
not benefit from gradient and neighborhood infor-
mation that extractors provide.
• Histograms of Oriented Gradients (HOG), a
descriptor that allows to extract local gradient in-
formation at the cost of discarding the intensity
data (Dalal and Triggs, 2005). As Fig. 5b shows,
a well-parametrized HOG operator allows to cre-
ate feature vectors that discriminate well between
defect and non-defect patches. An analysis of the
performance of different HOG variants is given in
Sec. 4.
• Local Binary Patterns (LBPs), another well un-
derstood method that extracts statistical neigh-
borhood information to form a texture descrip-
tor (Ojala et al., 2002). In our work, we use the
homogeneous LBPs, as they have shown better
performance than their rotation-sensitive counter-
parts (See Sec. 4).
The extracted feature vectors were subsequently
fed into a binary classifier to compute label predic-
tions for each patch. We tested the performance
of several widely used state-of-the art classifiers, in-
cluding the k-nearest-neighbors classifier (kNN), bi-
nary decision trees (BDT) and random forests (RF)
(Breiman, 2001). The key parameters of the classi-
fiers were varied systematically to determine optimal
values for our problem (Sec. 4). The final decision
whether a defect is visible in the image is computed
using a maximum a posteriori (MAP) approach as de-
scribed in (Bishop, 2006). MAP computes class prob-
abilities by multiplying a likelihood with a prior, with
the likelihood being the observation (in our case the
percentage of patches in an image reported as defec-
tive) and the prior the known base probability of an
image displaying a defect, i
˙
e
˙
the ratio of defect vs
˙
non-
defect images. Fig. 6 shows the process in more de-
tail.
4 EXPERIMENTS AND RESULTS
The conducted experiments served two major goals:
Evaluation and optimization of the classifier perfor-
mance and validation of the developed algorithms on
realistic data. To this end, the system was mounted
on a modern industrial automatic weaving machine
(Dornier A1) and 75 sets of four images each were
acquired, with 60 sets showing a faulty warp thread
ICPRAM 2018 - 7th International Conference on Pattern Recognition Applications and Methods
128
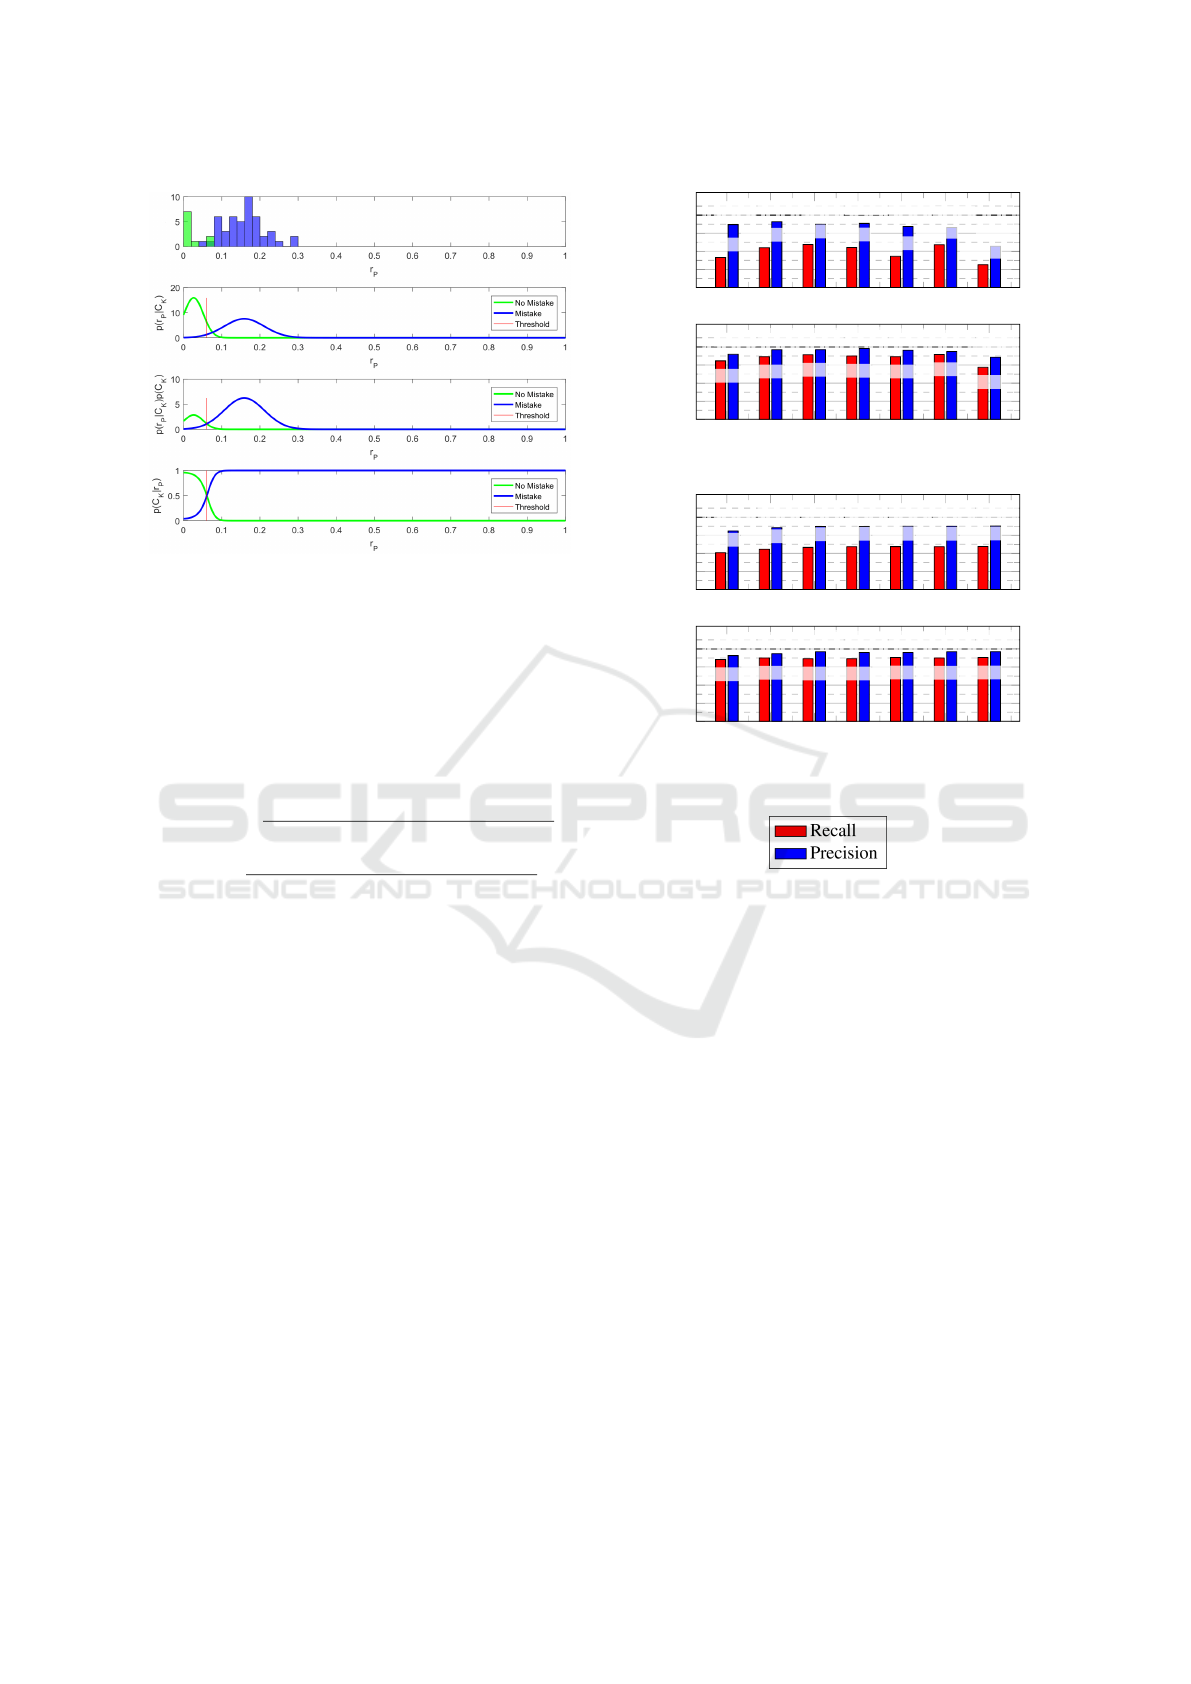
Figure 6: MAP procedure. Top row: The percentage of
patches classified as defective is noted in a histogram. 2nd
row: Gaussian distributions are fitted to the data. 3rd row:
Both distributions are multiplied with a-priori knowledge
about the class distributions. Bottom row: The normalized
class probabilities. The decision boundary is located at the
intersection of the probabilities.
and the other 15 being defect-free. Key performance
indicators used to assess algorithm performance were
precision and recall, defined as
precision =
number of correctly detected defects
total number of detections
recall =
number of correctly detected defects
total number of defects
.
Since the classification pipeline consists of two steps
- patch-wise classification and image classification -
the performance of each step has been evaluated inde-
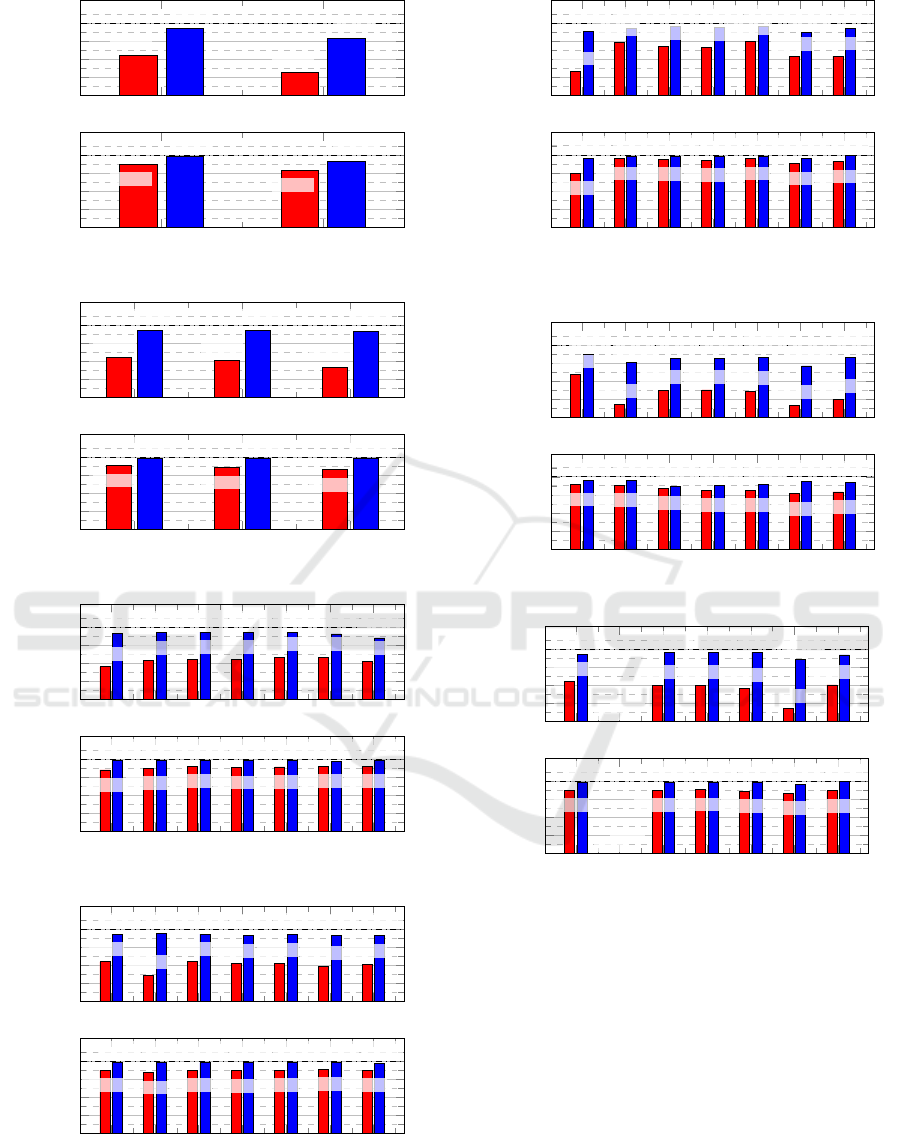
pendently. The following figures each show two bar
charts. The upper one presents the patch-wise classifi-
cation performance, the lower one presents the image
classification performance (Fig. 9). In a first trial we
evaluated the impact of descriptor type and parame-
ters on the classification result. All tests were per-
formed using the same classifier, namely a random
forest classifier with 30 trees, as this algorithm has
shown good overall performance and robustness to-
wards descriptor variations in preliminary tests. No
additional preprocessing was applied for these trials.
First, the HOG descriptor was evaluated, where cell
size and histogram bin count at a constant block size
of 1 × 1 have been analyzed. First, cell size has been
varied in a range from 3 × 3 to 30 × 30 pixels. As
shown in Fig. 7, classifier performance remains sta-
ble over a wide range of settings with only very small
and very large cell sizes having a negative impact on
the result. The impact of the histogram’s bin count
at a constant cell size of 6 × 6 pixels is shown in
Fig. 8. Again, the descriptor shows stable rates, yet
3 5 6
7
8 10 30
20%
40%
60%
80%
100%
53.1%
89.5%
63.9%
92.6%
67.5%
89.9%
64.2%
90.9%
54.6%
87.4%
67.2%
86.4%
45.2%
65.7%
3 5 6
7
8 10 30
20%
40%
60%
80%
100%
84.6%
91.9%
89.2%
96.8%
91.3%
96.9%
90.0%
98.2%
89.2%
96.4%
91.7%
94.8%
77.5%
88.6%
Figure 7: HOG: Quadratic cell size variation for 7 bins.
3 4 5 6
7
8 9
20%
40%
60%
80%
100%
60.7%
84.7%
64.5%
88.4%
66.6%
89.6%
67.3%
89.6%
67.4%
89.9%
67.3%
90.0%
67.6%
90.1%
3 4 5 6
7
8 9
20%
40%
60%
80%
100%
88.3%
92.6%
90.0%
94.7%
89.2%
96.8%
89.2%
96.0%
90.4%
96.0%
90.0%
96.9%
90.4%
96.9%
Figure 8: HOG: Histogram bin count variation for 6 × 6
cells.
Figure 9: Legend for bar charts. The upper charts of the fig-
ures present the patch-wise classification performance. The
lower charts present the image classification performance.
the rates increase slightly with increasing bin count.
For LBPs, we analyzed the impact of using rotation-
invariant versus conventional LBPs and the effect of
varying the number of neighbors as well as changing
descriptor radius and histogram cell size. As shown
in Figures 10, 11, 12 and 13, varying rotational vari-
ance or descriptor radius have a strong impact on the
classification performance, while the effects of vary-
ing cell size or the neighbor count are more subtle.
If not otherwise specified, cell size is 6 × 6, neigh-
bor count is 7, radius is 1 and the rotationally invari-
ant version is used. After analyzing descriptors and
choosing optimized parameter settings, we evaluated
the effects of the different implemented preprocess-
ing methods when classifying using either pixel in-
tensity values, HOG or LBP results as feature vectors.
The results are shown in Figures 14, 15 and 16. It
can be seen that preprocessing yields the biggest im-
provement when no additional descriptor is used, with
Gabor and Sobel-of-Gaussian filtering having the best
classification rate of 96.4%. The impact of prepro-
Fully Automatic Faulty Weft Thread Detection using a Camera System and Feature-based Pattern Recognition
129
invariant variant
20%
40%
60%
80%
100%
64.7%
94.4%
45.3%
83.5%
invariant variant
20%
40%
60%
80%
100%
89.6%
98.2%
83.3%
92.6%
Figure 10: LBP: Rotational variance.
1 2 3
20%
40%
60%
80%
100%
64.7%
94.0%
61.4%
94.1%
53.5%
93.7%
1 2 3
20%
40%
60%
80%
100%
90.4%
98.2%
88.3%
99.1%
85.8%
99.0%
Figure 11: LBP: Radius variation for cell size 7 × 7.
3 5 6
7
10 15 30
20%
40%
60%
80%
100%
56.3%
92.7%
62.8%
94.1%
64.2%
94.5%
64.2%
94.1%
66.7%
93.9%
67.0%
92.6%
62.6%
88.2%
3 5 6
7
10 15 30
20%
40%
60%
80%
100%
87.9%
98.1%
89.6%
98.6%
91.7%
98.2%
90.4%
98.2%
91.3%
98.2%
91.7%
97.8%
92.1%
98.2%
Figure 12: LBP: Quadratic cell size variation.
3 4 5 6
7
8 9
20%
40%
60%
80%
100%
64.0%
93.8%
49.1%
95.6%
64.1%
94.6%
61.9%
93.0%
62.4%
94.0%
59.0%
92.9%
61.4%
93.5%
3 4 5 6
7
8 9
20%
40%
60%
80%
100%
90.0%
98.2%
87.1%
98.6%
89.6%
98.2%
89.2%
98.2%
90.0%
98.6%
90.8%
98.2%
90.0%
97.7%
Figure 13: LBP: Neighbor count variation.
No
Gab
Prew
Sob SoG
DFT
Diff
20%
40%
60%
80%
100%
46.5%
91.3%
78.5%
94.0%
74.7%
95.9%
73.3%
95.7%
80.0%
96.4%
62.8%
89.5%
63.2%
93.7%
No
Gab
Prew
Sob SoG
DFT
Diff
20%
40%
60%
80%
100%
80.0%
96.5%
95.8%
98.7%
95.0%
98.3%
94.2%
98.7%
95.8%
98.3%
90.4%
96.4%
92.5%
99.1%
Figure 14: Different preprocessing methods for pixel inten-
sity feature vector.
No
Gab
Prew
Sob SoG
DFT
Diff
20%
40%
60%
80%
100%
67.5%
90.0%
34.5%
80.5%
50.0%
84.9%
50.4%
85.3%
48.9%
85.9%
33.5%
76.9%
40.1%
86.6%
No
Gab
Prew
Sob SoG
DFT
Diff
20%
40%
60%
80%
100%
91.3%
96.1%
90.4%
96.0%
87.5%
89.7%
85.4%
90.3%
85.0%
91.5%
81.3%
94.7%
83.3%
93.9%
Figure 15: Different preprocessing methods for HOG.
No
Gab
Prew
Sob SoG
DFT
Diff
20%
40%
60%
80%
100%
63.9%
94.6%
0.0%
0.0%
60.5%
96.1%
60.4%
96.1%
56.8%
96.5%
34.3%
88.6%
60.6%
93.7%
No
Gab
Prew
Sob SoG
DFT
Diff
20%
40%
60%
80%
100%
90.0%
98.2%
0.0%
0.0%
90.0%
98.6%
90.4%
98.6%
88.8%
98.2%
86.3%
95.8%
89.2%
99.1%
Figure 16: Different preprocessing methods for LBP.
cessing decreases when HOG is used as feature de-
scriptor. In this case, using no preprocessing outper-
forms the other methods with a whole-image classi-
fication rate of 96.1%. Gabor filtering and apply-
ing HOG delivers good whole-image classification re-
sults while at the same time showing slightly lower
patch-wise classification performance. Finally, LBPs
show a constantly high classification rate regardless
of the used feature vectors, peaking around 90% with-
out preprocessing as well as for the Sobel and Prewitt
filters.
For testing the performance of different classi-
fiers and their settings, we have chosen three well-
performing preprocessing/feature descriptor combi-
ICPRAM 2018 - 7th International Conference on Pattern Recognition Applications and Methods
130
nations and analyzed how the classification rates
vary when applying different classifiers and vary-
ing their main parameters. The chosen combinations
are: Gabor filter and pixel intensity values, Sobel-of-
Gaussian and pixel intensity values, and finally ap-
plying LBPs to a non-preprocessed image (Fig. 20).
These are the three combinations that have shown the
best image classification rates. Since the image rates
were already high, we analyzed the patch rates under
the assumption that an increased patch-wise classifi-
cation rate corresponds to a higher classifier robust-
ness, thereby increasing chances of correctly classi-
fying new, more challenging patches.
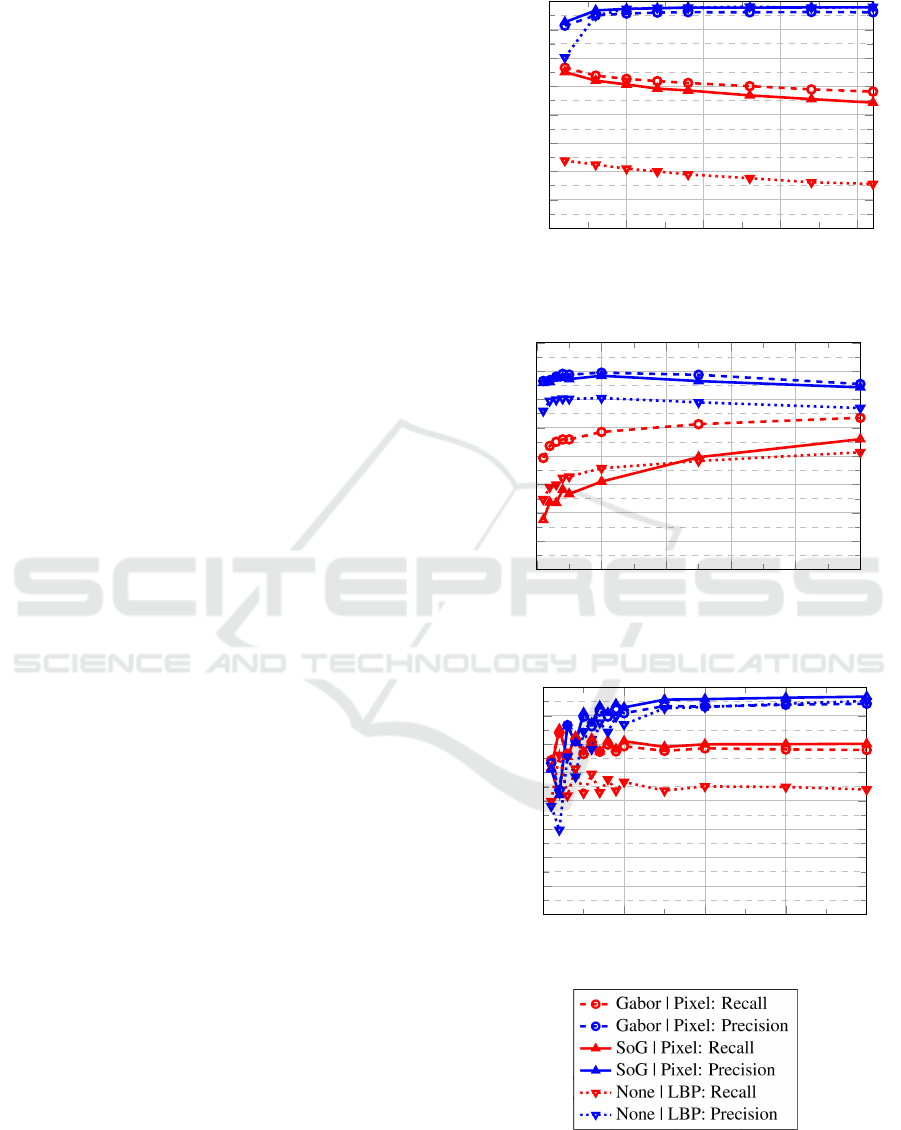
The first inspected classifier is kNN. This algorithm’s
only adjustable parameter is the number of neigh-
bors k. The results in Fig. 17 shows that the choice
of k has only marginal impact on classification rates,
with the precision being constantly high even with
only one contributing neighbor, while the recall drops
continuously with increasing neighbor count.
An analysis of the binary decision tree (Fig. 18)
shows that less deep trees yield higher precision val-
ues while increasing the number of tree nodes in-
creases recall for all descriptors. In a subsequent step
we changed the number of trees in the random forest
classifier while leaving each tree’s depth at its default
value (Fig. 19). Results show that the classification
results increase with the number of trees until a num-
ber of about 15 trees is reached; from that point on the
classification rates remain constant.
Finally, the optimized per-patch results were used
to define a decision rule that allows detecting whether
a ROI contains a defective thread or not. To this end,
we analyzed the number of positives returned by the
classifiers (corresponding to the likelihood of a de-
fect being present in the image or not) for both de-
fect and non-defect ROIs and normalized it by image
size. Results have shown that defect and non-defect
images form two distinctive distributions. To find the
optimal decision rule, the likelihoods were multiplied
with the prior class distributions of the used image set.
Per-image classification rates are displayed in the bot-
tom bar charts of image 7 to to 16, showing that the
MAP approach allows to classify images with high
accuracy even by using results acquired from classi-
fiers with strongly varying patch-wise classification
performance.
5 DISCUSSION
Our results show that the problem of localizing de-
fective yarns is well solvable using computer vision
methods, however the different algorithm combina-
0
5
10
15
20
20%
30%
40%
50%
60%
70%
80%
90%
100%
Patch Classification
Figure 17: KNN: Variation of k.
0 200 400
600
800 1,000
20%
30%
40%
50%
60%
70%
80%
90%
100%
Patch Classification
Figure 18: BDT: Variation of depth.
0 10 20 30 40
20%
30%
40%
50%
60%
70%
80%
90%
100%
Patch Classification
Figure 19: RF: Variation of number of trees.
Figure 20: Legend for classification analysis.
Fully Automatic Faulty Weft Thread Detection using a Camera System and Feature-based Pattern Recognition
131

tions evaluated in this workstrongly differ in their per-
formance. Results show that preprocessing has a high
impact on classifier performance and that basic edge-
enhancing methods allow the best class separability,
outperforming direction-sensitive approaches such as
the Sobel-of-Gaussian or Gabor Filters. An interest-
ing fact is that the per-image classification rate gen-
erally remains constantly high and is generally robust
towards drops in the patch-wise classification perfor-
mance.
6 CONCLUSION
In this paper, we have described and thoroughly eval-
uated a solution for the fully automated detection of
faulty weft threads in automated weaving machines
using computer vision. First, we developed a robust
multi-camera setup capable of capturing the entire
shed area with high resolution. The resulting images
were divided into small patches and each patch was
classified independently. We described and evaluated
a number of methods for preprocessing, feature ex-
traction and feature-based classification. Parameter
variations of the extraction and classification methods
were analyzed and optimized settings were reported.
Finally, we introduced a maximum-a-posteriori-based
method for the final defect classification of a whole
image based on the detection distributions in positive
and negative test images. Results have shown that
our presented methods allow a reliable error detec-
tion with high classification rates, making the system
suitable for future industrial applications.
REFERENCES
Bishop, C. M. (2006). Pattern recognition. Machine Learn-
ing, 128.
Bovik, A. C., Clark, M., and Geisler, W. S. (1990). Multi-
channel texture analysis using localized spatial filters.
IEEE transactions on pattern analysis and machine
intelligence, 12(1):55–73.
Breiman, L. (2001). Random forests. Machine learning,
45(1):5–32.
Dalal, N. and Triggs, B. (2005). Histograms of oriented gra-
dients for human detection. In 2005 IEEE Computer
Society Conference on Computer Vision and Pattern
Recognition (CVPR’05), volume 1, pages 886–893.
IEEE.
Hanbay, K., Talu, M. F., and Ömer Faruk Özgüven
(2016). Fabric defect detection systems and meth-
odsâC”a systematic literature review. Optik - In-
ternational Journal for Light and Electron Optics,
127(24):11960 – 11973.
Karayiannis, Y. A., Stojanovic, R., Mitropoulos, P., Koula-
mas, C., Stouraitis, T., Koubias, S., and Papadopoulos,
G. (1999). Defect detection and classification on web
textile fabric using multiresolution decomposition and
neural networks. In Electronics, Circuits and Systems,
1999. Proceedings of ICECS’99. The 6th IEEE Inter-
national Conference on, volume 2, pages 765–768.
IEEE.
Kumar, A. (2008). Computer-vision-based fabric defect de-
tection: a survey. IEEE transactions on industrial
electronics, 55(1):348–363.
Ngan, H. Y., Pang, G. K., and Yung, N. H. (2011). Auto-
mated fabric defect detectionâ
C”a review. Image and
Vision Computing, 29(7):442–458.
Ojala, T., Pietikainen, M., and Maenpaa, T. (2002). Mul-
tiresolution gray-scale and rotation invariant texture
classification with local binary patterns. IEEE Trans-
actions on pattern analysis and machine intelligence,
24(7):971–987.
Sari-Sarraf, H. and Goddard, J. S. (1999). Vision system
for on-loom fabric inspection. IEEE Transactions on
Industry Applications, 35(6):1252–1259.
Schneider, D., Holtermann, T., and Merhof, D. (2014). A
traverse inspection system for high precision visual
on-loom fabric defect detection. Machine Vision and
Applications, pages 1–15.
Stojanovic, R., Mitropulos, P., Koulamas, C., Karayiannis,
Y., Koubias, S., and Papadopoulos, G. (2001). Real-
time vision-based system for textile fabric inspection.
Real-Time Imaging, 7(6):507–518.
Wada, Y. (1984). Optical weft sensor for a loom. US Patent
4,471,816.
ICPRAM 2018 - 7th International Conference on Pattern Recognition Applications and Methods
132
