
Acoustic Analysis of Chronic Laryngitis
Statistical Analysis of Sustained Speech Parameters
João Paulo Teixeira
1,2
, Joana Fernandes
1
, Filipe Teixeira
1
and Paula Fernandes
1,2,3
1
Polytechnic Institute of Bragança, Campus Sta. Apolónia 5301 857 Bragança, Portugal
2
Applied Management Research Unit (UNIAG), Portugal
3
Research Unit in Business Sciences (NECE-UBI), Portugal
Keywords: Chronic Laryngitis, Acoustic Analysis, Jitter, Shimmer, HNR, NHR, Auto Correlation.
Abstract: This paper describes the statistical analysis of a set of features extracted from the speech of sustained vowels
of patients with chronic laryngitis and control subjects. The idea is to identify which features can be useful in
a classification intelligent system to discriminate between pathologic and healthy voices. The set of features
analysed consist in the Jitter, Shimmer Harmonic to Noise Ratio (HNR), Noise to Harmonic Ratio (NHR) and
Autocorrelation extracted from the sound of a sustained vowels /a/, /i/ and /u/ in a low, neutral and high tones.
The results showed that besides the absolute Jitter, no statistical significance exist between male and female
voices, considering the classification between pathologic or healthy. Any of the analysed parameters is likely
to be a statistical difference between control and Chronic Laryngitis groups. This is an important information
that these features can be used in an intelligent system to classify healthy from Chronic Laryngitis voices.
1 INTRODUCTION
The process of speech production conveys several
types of information, namely non-linguistic
information, para-linguistic information and
linguistic information, according to Fujisaki (2002).
The non-linguistic elements are related to physical
and emotional aspects not controlled by the speaker.
These kind of constrains take part in the speech
production process at the level of the physical speech
production apparatus. The paralinguistic elements
conveys intentional, attitudinal and stylistic
manifestations of the speaker. These elements
interfere with the utterance planning phase of the
speech production and are related to the superposition
of the supra-segmental elements of the speech
(prosody parameters such as Fundamental Frequency
- F0, segmental durations and energy of the
segments). The linguistic elements carries lexical,
syntactic and semantic information to the message
planning level that is ruled by a set of grammar rules
to create the utterance.
Fig. 1 presents the processes by which various
types of information are manifested in the segmental
and supra-segmental features of speech, according to
the Fujisaki model (Fujisaki, 2002). According to this
model the chronic laryngitis imposes physical
constrains at the speech sound production apparatus
and/or physiologic constrains at the motor command
generations process.
The laryngitis occur when the vocal fold get
irritated or swollen. This very common condition,
often causes hoarseness or loss of voice. The
laryngitis can be acute or chronic. Both cases has
similar symptoms. The acute laryngitis comes
suddenly and disappears in days or one week. The
chronic laryngitis rests for longer periods of time like
several weeks or months. The chronic laryngitis can
be caused by smoke for long periods of time,
gastroesophageal reflux, infections (bacterial, viral,
fungal), bronchitis, autoimmune, irritative, traumatic
or allergic factors, pneumonia, excessive exposure to
toxic chemicals, complications of influenza or
chronic cold (Tusaliu et al, 2016).
The techniques of voice analysis are often used for
voice disorders assessment
(Brockmann-Bauser,
2011; Bielamowicz et al., 2006; Salhi et al., 2010).
Such techniques rely upon the non-invasive character
when compared with, for example, laryngoscopy
exams.
168
Teixeira, J., Fernandes, J., Teixeira, F. and Fernandes, P.
Acoustic Analysis of Chronic Laryngitis - Statistical Analysis of Sustained Speech Parameters.
DOI: 10.5220/0006586301680175
In Proceedings of the 11th International Joint Conference on Biomedical Engineering Systems and Technologies (BIOSTEC 2018) - Volume 4: BIOSIGNALS, pages 168-175
ISBN: 978-989-758-279-0
Copyright © 2018 by SCITEPRESS – Science and Technology Publications, Lda. All rights reserved
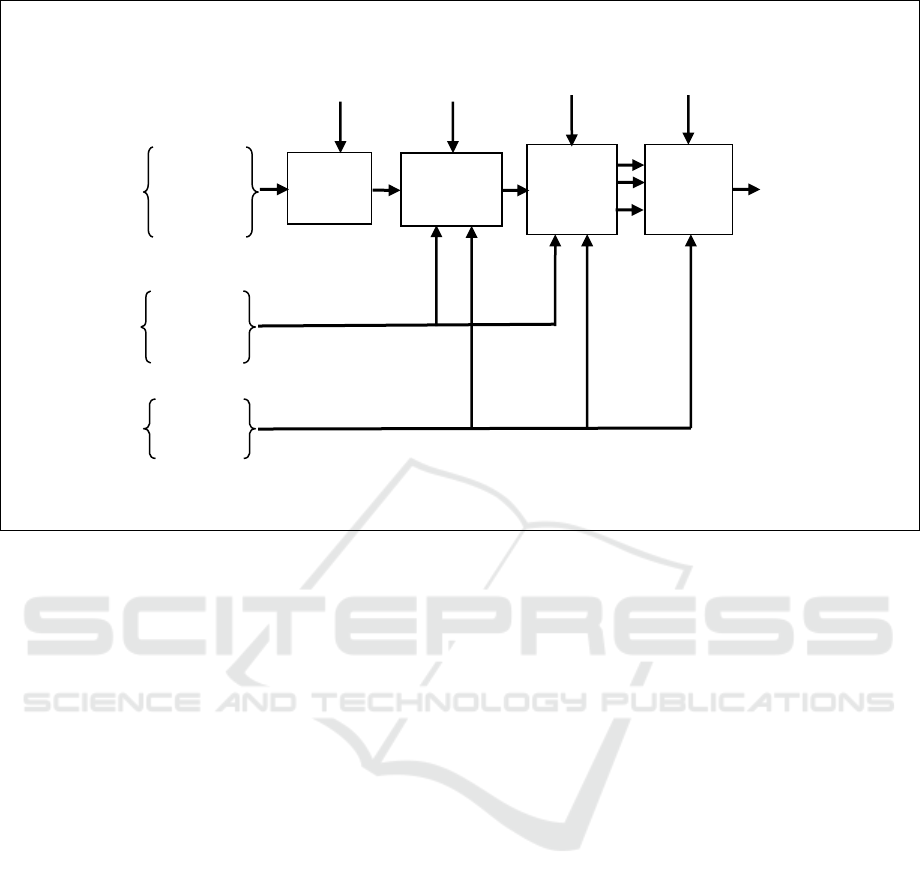
Figure 1: Speech production process. (Figure published in Fujisaki, 2002, edited with courtesy of Hiroya Fujisaki).
Alternatively, voice disorders can be diagnosed
by an auditory perceptual analysis, although this may
lead to different results depending on the practitioner.
The long-term scope of this study is the
development of a classifier system based in Artificial
Neural Network and/or Support Vector Machines to
classify with very high accuracy speech signal
between the classes of chronic laryngitis and healthy
controls (Teixeira et al., 2017).
This paper reports the statistical analysis of a set
of parameters over the groups of control (healthy
group) and the pathologic group (Chronic Laryngitis
group). In a first step, the groups were separated by
gender but once it has concluded that no statistical
differences exist between gender, the analysis
proceeds with male and female voices together. Next
section presents the set of parameters used. Section 3
presents the statistical analysis and finally the
conclusions sections summarises the major remarks
of the research.
2 CHARACTERIZATION OF
SUSTAINED SPEECH
PARAMETERS
The parameters analysed in this work were extracted
from sustained speech sounds of the vowels /a/, /i/
and /u/ at low, normal and high tones. Parameters
related with the variations of the periodicity such as
jitter and shimmer were used, namely the absolute
and relative measures of jitter and also the absolute
and relative measures of shimmer. Additionally,
measures related with harmonic and unharmonic
components were also used, namely the harmonic to
noise ratio, noise to harmonic ratio and
autocorrelation.
2.1 Jitter and Shimmer Parameters
Jitter is defined as a measure of the variation of the
glottal period between successive cycles of vocal fold
vibration. Subjects who cannot control vocal chords
vibration tend to have higher jitter values. The jitter
can be measured in four different ways (Teixeira and
Gonçalves, 2014). However, in this study only two of
these forms were used, relative jitter and absolute
jitter. The other two measures are relative average
perturbation (rap) and the period perturbation
quotient (ppq5) that measures the same variability
within a window of 3 and 5 glottal periods. Previous
statistical analysis (Teixeira and Fernandes, 2015)
showed that relative jitter has similar results as rap
and ppq5.
Absolute jitter (jitta) is the glottal period variation
between cycles, that is, the mean absolute difference
between consecutive periods, expressed by Eq. 1.
Linguistic
Non-
linguistic
Para-
linguistic
Message
Planning
Utterance
Planning
Motor
Command
Generation
Lexical
Syntactic
Semantic
Pragmatic
Input
Information
Rules of
Grammar
Rules of
Prosody
Physiological
Constrains
Physical
Constrains
Intentional
Attitudinal
Stylistic
Physical
Emotional
Segmental
and
supra-
segmental
features
of speech
Speech
Sound
Production
Acoustic Analysis of Chronic Laryngitis - Statistical Analysis of Sustained Speech Parameters
169

The relative jitter (jitter) is the average absolute
difference between consecutive glottal periods
divided by the average period and expressed as a
percentage (Eq. 2).
The shimmer was another extracted parameter and
is related to the magnitude variation along the glottal
periods. A reduction in glottal resistance and lesions
may cause variations in glottal magnitude correlated
with breathiness and noise emission, giving rise to
higher shimmer values. The shimmer can be
measured in four different ways (Teixeira and
Gonçalves, 2014), however, in this study only two of
them will be studied, relative shimmer (Shim) and
absolute shimmer (ShsB). The other two measures are
Amplitude Perturbation Quotient in 3 cycles (APQ3)
and Amplitude Perturbation Quotient in 5 cycles
(APQ5) that measures the same variability within a
window of 3 and 5 glottal periods, respectively.
Previous statistical analysis (Teixeira and Fernandes,
2015) showed that relative shimmer has similar
results as APQ3 and APQ5.
The absolute shimmer (ShdB) is expressed as the
peak-to-peak magnitude variation in decibel, that is,
the logarithm of base 10 of the absolute mean of the
magnitude ratio between consecutive periods
multiplied by 20. It is expressed in decibel (Eq. 3).
The relative shimmer (Shim) is defined as the
mean absolute difference between magnitudes of
consecutive periods, divided by the mean magnitude,
expressed as a percentage (Eq. 4).
In equations 1-4 T
i
is the length of time of the
glottal period i. A
i
is the magnitude of the glottal
period i. N is the total number of glottal periods.
(1)
(2)
(3)
(4)
2.2 Harmonic Parameters
The harmonic characteristics of the voice can be
measured into three parameters, HNR (Harmonic to
Noise Ratio), NHR (Noise to Harmonic Ratio) and
Autocorrelation. The HNR is a parameter in which
the relationship between harmonic and noise
components provides an indication of overall
periodicity of the speech signal by quantifying the
relation between the periodic component (harmonic
part) and aperiodic component (noise). The overall
HNR value of a signal varies because different vocal
tract configurations imply different amplitudes for
harmonics.
Different authors propose their own way to
measure the HNR (Boersma, 1993; Shama et al,
2007). One possibility consists in measure the energy
of the first peak of the normalised autocorrelation and
consider that this is the energy of the harmonic
component of the signal, and consider the remaining
energy as the noise energy given by the difference
between 1 and the harmonic energy. In this equation
H is the harmonic component given by the energy of
the first peak of the normalised autocorrelation of the
signal.
The NHR tends to be the invers of the HNR,
anyhow once the measure is made at the logarithmic
domain (dB), their values tend to move in opposite
directions but the values are not exactly the inverse.
The Autocorrelation function gives a measure of
the similar parts of speech repeated along the signal.
As higher the autocorrelation value higher is the
repetitions of similar events along the signal.
3 STATISTICAL ANALYSIS
One first analysis consists in comparing the
parameters by gender for the control and pathologic
group. The second analysis consist in comparing the
control and pathologic groups for each parameter.
The parameters were extracted using the Praat
software (Boersma and Weenink) from a set of files
in the wave file format with 16 bits resolution and
sampling frequency of 50 kHz. For each subject a set
of 9 files were used. Each file has a sound with a
length between 1 and 3 seconds. This 9 files consist
in the vocalisation of the sustained sound
corresponding to the vowels /a/, /i/ and /u/ at a low,
neutral and high tones.
BIOSIGNALS 2018 - 11th International Conference on Bio-inspired Systems and Signal Processing
170

3.1 Speech Sound Database
The Saarbrücken Voice Database (SVD) (Barry and
Pützer) was used in this work. For each voice, one
segment of speech record was used for sustained
vowels /a/, /i/ and /u/ for High, Low and Mid/Neutral
tones in a total of 9 speech segments. Each segment
of speech consists in a steady state sustainable
pronunciation of the respective vowel. For each
speech segment a set of jitter, shimmer and harmonic
parameters, was determined using the Praat software.
The subjects selected for this work sample
consists in the subjects of the SVD with the pathology
of chronic laryngitis. The control group was selected
along the list of healthy subjects with similar age
(mean and standard deviation). Table 1 displays the
characterization of the sample selected for this work
concerning these aspects.
Since the number of female subjects with chronic
laryngitis only were not so extensive, it was
considered to include also in the patients group
subjects with chronic laryngitis and other or others
pathologies. This allowed to increase the length of the
male pathologic group with chronic laryngitis, from
25 to 40, and increase the length of the female
pathologic group with chronic laryngitis from 16 to
30 subjects. Table 2 presents the characterization of
the pathologic group by gender and discriminates the
number of subjects with others pathologies besides
chronic laryngitis. In this table laryngitis means
chronic laryngitis.
The total number of samples used for this analysis
were 70 pathologic subjects by 9 samples given a total
of 630 samples for each parameter of the pathologic
group. Similarly, a total number of 828 samples for
each parameter of the control group were used.
Table 1: Characterization of Sample.
Male
Female
Control
Patient
Control
Patient
Length of sample
33
40
59
30
Average age
50,2
52,5
47,9
49,2
Standard
deviation of ages
14,9
12,6
14,3
13,4
Table 2: Characterization of Pathologic group.
Pathology
Male
Female
Laryngitis
25
16
Laryngitis + Dysphonia
2
1
Laryngitis + Reinke’s Edema
-
4
Laryngitis + Leukoplakia
8
4
Laryngitis + hyper functional
dysphonia
1
1
Laryngitis + Polyp
1
1
Pachydermia laryngis
1
-
Laryngitis + Carcinoma in the
epiglottis
-
1
Laryngitis + recurrent laryngeal
nerve palsy
-
1
Laryngitis + case study
1
-
Laryngitis + Carcinoma
1
-
Laryngitis + hyper functional
dysphonia l + leucoplakia
-
1
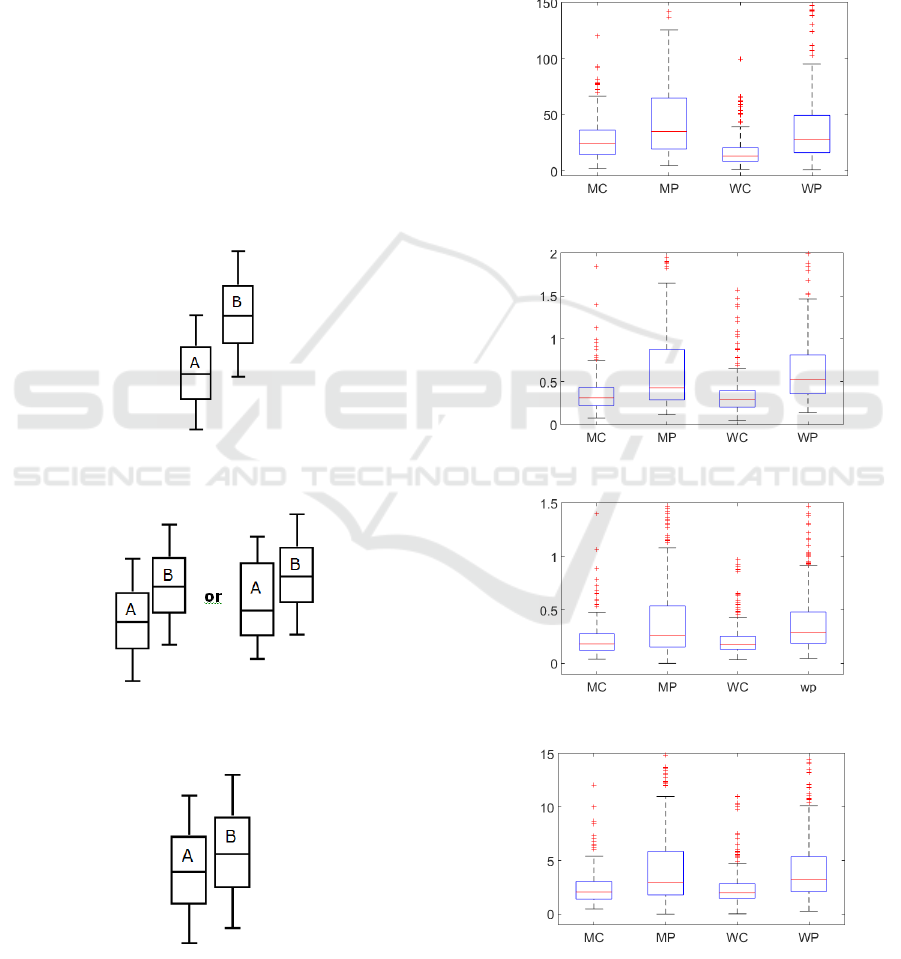
3.2 Statistical Analysis Tool - Box Plot
The box plot box or whiskers plot is used for a
descriptive statistical analysis. This tool is a method
for graphically depicting groups of numerical data
through their quartiles. Box plots may also have lines
extending vertically from the boxes (whiskers)
indicating variability outside the upper and lower
quartiles (Mann, 2010; Hubert and Vandervieren,
2008).
Outliers
Outliers
Upper limit
Lower limit
Median
3rd quartile
1st quartile
Figure 2: Box plot description.
Figure 2 presents the statistical values indicated
under a box plot and its whiskers. The box is limited
by two lines indicating the 1
st
and 3
rd
quartile limits.
Inside there is a line indicating the median value. The
band between the 1
st
and 3
rd
quartile limits is the
InterQuartile Range (IQR). Outside the box there is
the whiskers that end with the lower and upper limits.
The upper limit is determined by the higher sample
value below the 3
rd
quartile plus 1.5 IQR. The lower
Acoustic Analysis of Chronic Laryngitis - Statistical Analysis of Sustained Speech Parameters
171
limit is determined by the lower sample value upper
the 1
st
quartile minus 1.5 IQR. Outside the lower and
upper limits still the outlier samples.
When comparing two groups a box-and-whisker
plot can be used (Barton, 2004). A Sample size of at
least 30 is needed to generalize about a population.
Three situations may occur in this comparison. For
instance comparing two groups: A and B.
The situation 1 (represented by Figure 3) where B
is greater than A. No overlap in boxes, or 3rd quartile
is below 1st quartile. So there IS a difference between
group A and B.
The situation 2 (represented by Figure 4) where
boxes overlap but not both medians. Or 1st quartile
below median (or median below 1st quartile), so there
IS LIKELY to be a difference between group A and
B.
The situation 3 (represented by Figure 5) where
boxes overlap with both medians. NO difference can
be claimed.
Figure 3: Box plot for comparing two groups. Situation 1 -
B is greater than A.
Figure 4: Box plot for comparing two groups. Situation 2 -
It is likely that B is greater than A.
Figure 5: Box plot for comparing two groups. Situation 3 -
We cannot tell if there is a difference.
3.3 Gender Comparison
A statistical analysis was made for each parameters
comparing the male and female genders for the
pathologic and control groups. Figure 6 to figure 12
displays the boxplot for each parameter. One box is
displayed for each group: MC - Men’s Control group;
MP - Men’s Patient group; WC - Woman’s Control
group; WP - Woman’s Patient group.
Figure 6: Absolute Jitter (jitta).
Figure 7: Relative Jitter (jitter).
Figure 8: Absolute Shimmer (ShdB).
Figure 9: Relative Shimmer (Shim).
BIOSIGNALS 2018 - 11th International Conference on Bio-inspired Systems and Signal Processing
172
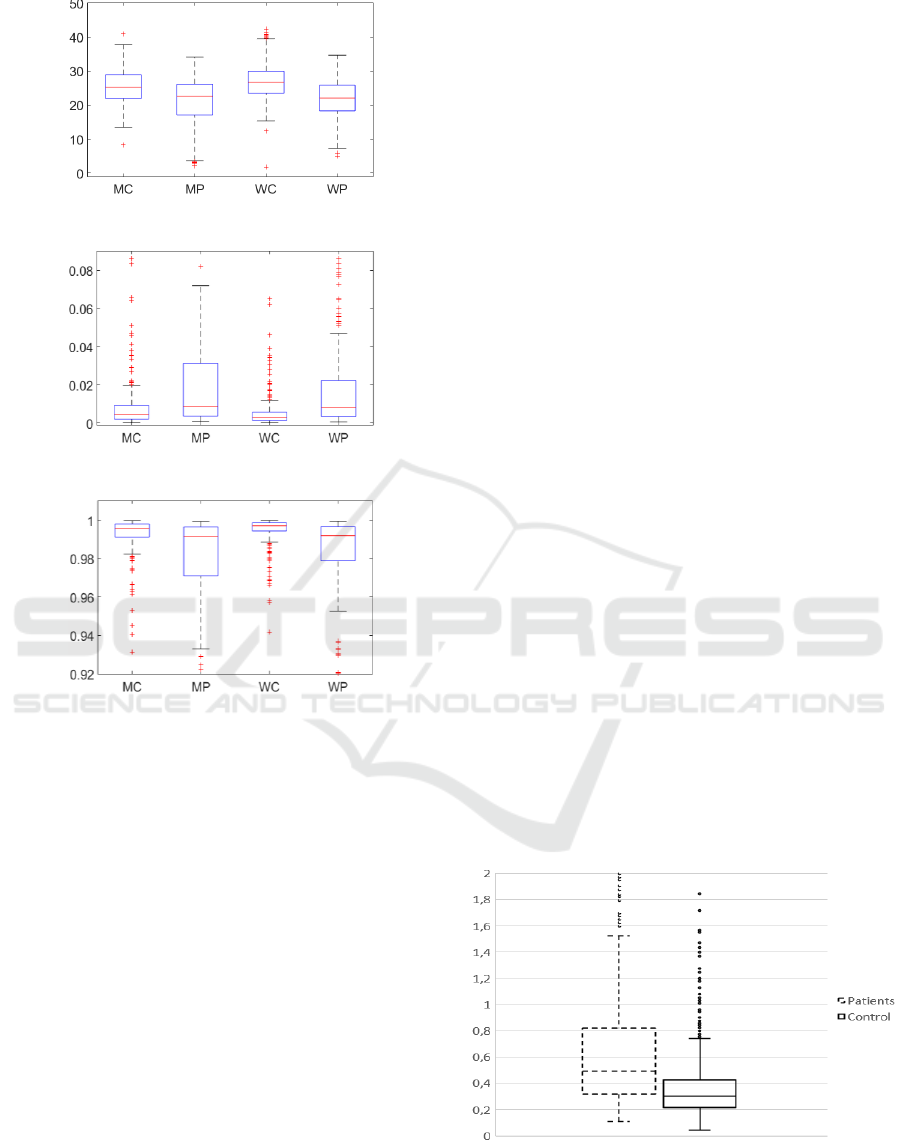
Figure 10: HNR.
Figure 11: NHR.
Figure 12: Autocorrelation (AutoCorr).
An analysis of the box plot of figures 6 to 12
shows a difference between control and pathologic
box groups for the all parameters that will be analysed
in next section.
Considering only the gender comparison it can be
observed that the absolute jitter parameter shows a
slightly higher values for male than for female control
group. This difference do not appear on the other
parameters. This slightly higher values for jitter of
male voices can be explained because generally male
voices has lower fundamental frequency, and
consequently longer glottal periods. Therefore it is
natural that in longer glottal periods the same level of
out of control (although under healthy limits) can be
expressed with longer deviations. This difference was
also reported in previous works by (Teixeira and
Fernandes 2014; Teixeira and Fernandes 2015). This
difference vanish in relative jitter since the longer
deviations are divided by longer periods relativizing
the deviations under male and female voice groups.
This result is consistent with gender analyses made in
previous works for this parameters within control and
other pathologies like dysphonia (Teixeira and
Fernandes 2014; Teixeira and Fernandes 2015).
Therefore, regarding the conclusion that the other
parameters besides absolute jitter present no statistic
differences, the further analysis between pathologic
and control groups will be made grouping male and
female subjects for the parameters: relative jitter
(jitter), absolute and relative Shimmer (ShdB and
Shim), HNR, NHR and autocorrelation.
3.4 Chronic Laryngitis Analysis
The values of each parameter from the 3 vowels and
3 tones were used as 9 samples for each subject. In
this work no separate analysis by vowel and tone were
made. A study of this analysis by vowel and tone can
be found in previous works (Teixeira and Fernandes
2014).
The statistical analysis is presented using the
boxplot in Figures 13 to 18. The length of the patients
group is of 630 samples and the control group is 828
samples.
As it can be observed in Figure 13 the relative
jitter tends to be lower for control group than for
patients group. The median value of the control group
is lower than the 1
st
quartile of the patients group. In
addition, the median value for the patients group is
higher than the 3
rd
quartile of the control group.
Similarly, the absolute shimmer (Figure 14) tends
to be lower for the control group than for the patients
group. Once more, the median values of each group
are outside the quartiles of the other group.
The relative shimmer (Figure 15) also tends to be
lower for the control group than for the patients.
Although, in this case the median values are very
close to the quartile of the other group but outside the
box.
Figure 13: Relative Jitter (jitter).
Acoustic Analysis of Chronic Laryngitis - Statistical Analysis of Sustained Speech Parameters
173
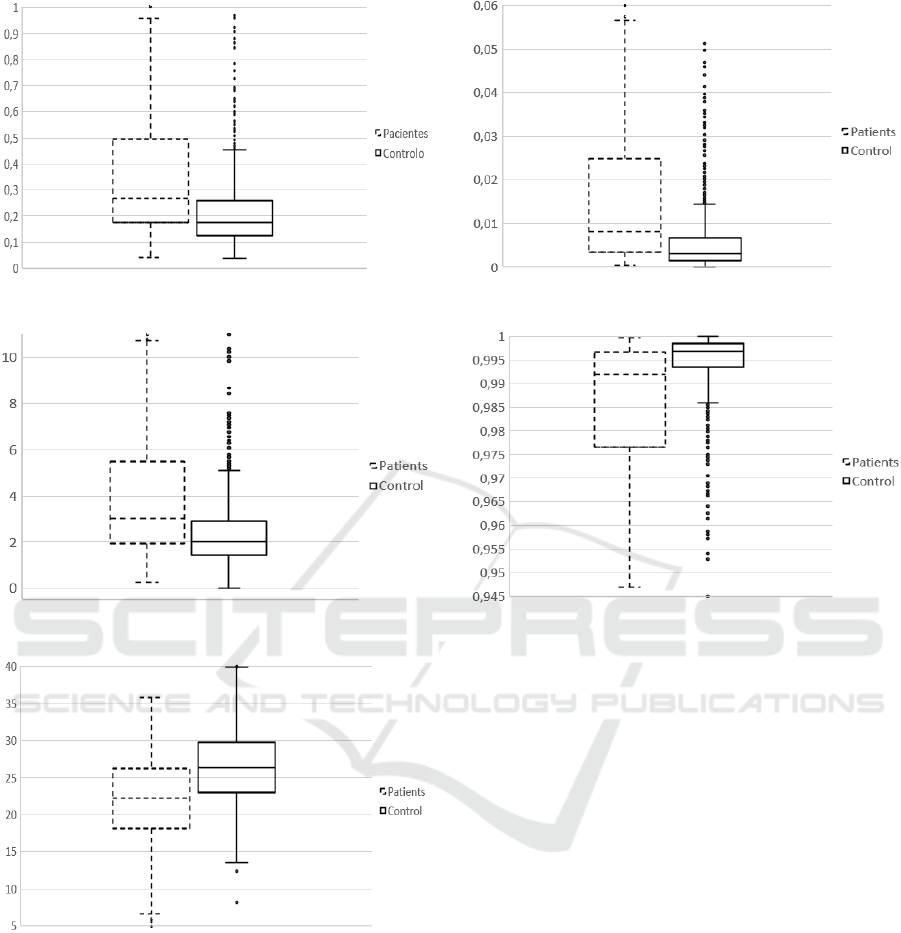
Figure 14: Absolute Shimmer (ShdB).
Figure 15: Relative shimmer (Shim).
Figure 16: HNR.
Figure 17: NHR.
Figure 18: Autocorrelation (AutoCorr).
The HNR (Figure 16) tends to be higher for the
control group than for the patients group. Over again
the median of each group are outside the box of the
other group.
The NHR (Figure 17) tends to be lower for control
group and the median of each group are also outside
the box of the other group.
The Autocorrelation (Figure 18) tends to be
higher for the control group than for the patients
group. Again, the median of each group are outside
the box of the other group.
The results are very similar for the 6 parameters
under analysis because all of them present the
situation B of section 3.2 and Figure 4, where boxes
overlap but not overlap both medians. Therefore, it IS
LIKELY to be a difference between control group
and patients group for the six parameters under
analysis.
4 CONCLUSIONS
The paper presented the statistical analysis of a set of
speech parameters for Chronic Laryngitis pathology.
BIOSIGNALS 2018 - 11th International Conference on Bio-inspired Systems and Signal Processing
174

The parameters were extracted from 9 segments
of speech sound with the vocalization of the vowels
/a/, /i/ and /u/ at low neutral and high tones. The
speech segments were collected from the SVD
selecting the set of patients with Chronic Laryngitis,
eventually with other cumulative pathologies. The
Praat software were used to extract the absolute and
relative Jitter, the absolute and relative Shimmer,
HNR, NHR and Autocorrelation parameters.
In a first stage of the analysis a gender comparison
under the control and pathologic groups were
presented. Only the absolute Jitter showed differences
between male and female on the control group.
Therefore, further analysis was made with male and
female parameters together.
The comparison between control and pathologic
groups showed similar conclusions for the six
parameters. Namely, for relative Jitter, absolute and
relative Shimmer, HNR, NHR and Autocorrelation
there is likely to be a statistical difference between
control and Chronic Laryngitis groups.
Although this six parameters are likely to be
statistical differences between control and Chronic
Laryngitis, some of them are very correlated each
other because are based on the same signal processing
analysis.
These six parameters seem to be very useful to use
with an intelligent decision tool to classify between
healthy and Chronic Laryngitis. Further research will
progress with the implementation of classification
systems to assist the diagnose process of this or other
pathologies with acoustic analysis.
ACKNOWLEDGEMENTS
This work is supported by the Fundação para a
Ciência e Tecnologia (FCT) under the project number
UID/GES/4752/2016 and UID/GES/04630/2013.
REFERENCES
Barry, W.J., Pützer, M. Saarbrücken Voice Database,
Institute of Phonetics, Univ. of Saarland,
http://www.stimmdatenbank.coli.unisaarland.de/
Barton, David, 2004. Gamma Mats NCES L1. Pearson
Education New Zealand.
Bielamowicz, S., Kreiman, J., Gerratt, B., Dauer, M.,
Berke, G. 1996. Comparison of Voice Analysis
Systems for Perturbation Measurement. Journal of
Speech and Hearing Research, 39:126-134.
Boersma P, Weenink D.: Praat: doing phonetics by
computer. Phonetic Sciences, University of
Amsterdam. http://www.fon.hum.uva.nl/praat/
Boersma, P., 1993. Accurate short-term analysis of the
fundamental frequency and the harmonic-to-noise ratio
of a sample sound. IFA Proceedings 17, 97-110.
Brockmann-Bauser, M., 2011. Improving jitter and
shimmer measurements in normal voices. Institute of
Cellular Medicine, Medical School, Newcastle
University.
Fujisaki, H., 2002. Modeling in study of Tonal Features of
Speech with Application to Multilingual Speech
Synthesis. Proceedings of Joint International
Conference of SNLP and Oriental COCOSDA.
Thailand.
Hubert, M.; Vandervieren, E., 2008. An adjusted boxplot
for skewed distributions. Computational Statistics and
Data Analysis. 52 (12): 5186–5201.
Mann, Prem S., 2010. Introductory Statistics. 7ª ed. [S.l.]:
Wiley. p. 115 — 117.
Salhi, L., Mourad, T., Cherif, A., 2010. Voice Disorders
Identification Using Multilayer Neural Network. The
International Arab Journal of Information Technology,
Vol. 7, No. 2, 177-185.
Shama, K., Krishna, A. and Cholayya, N., 2007. Study of
Harmonics-to-Noise Ratio and Critical-Band Energy
Spectrum of Speech as Acoustic Indicators of
Laryngeal and Voice Pathology. EURASIP Journal on
Advances in Signal Processing, Vol. 2007.
Teixeira, J,, Fernandes, P., 2014. Jitter, Shimmer and HNR
classification within gender, tones and vowels in
healthy voices. Procedia Technology, 16:1228-1237.
Teixeira, J. P., Fernandes, P. O., 2015. Acoustic Analysis
of Vocal Dysphonia. Procedia Computer Science.
Elsevier 64 466 – 473.
Teixeira, J. P., Fernandes, P. O., Alves, N., 2017. Vocal
Acoustic Analysis – Classification of Dysphonic
Voices with Artificial Neural Networks Submited to
Procedia Computer Science. Elsevier.
Teixeira, J. P., Gonçalves, A., 2014. Accuracy of Jitter and
Shimmer Measurements. Procedia Technology.
Elsevier, Volume 16, 1190-1199.
Tusaliu, M., Dragu, A., Goanta, M., Mihalcea, G., Ionita,
C., Luca, S., Ghiuzan, L. & Budu, A., 2016. Chronic
laryngitis in adults. Archives of the Balkan Medical
Union, V. 51, Issue 1, pp 34-36.
Acoustic Analysis of Chronic Laryngitis - Statistical Analysis of Sustained Speech Parameters
175
