
Automatic Computation of Biophysical Cell Parameters in Digital
Holographic Microscopy Images
Lilith Brandt
1
, Klaus Brinker
1
and Björn Kemper
2
1
Hamm-Lippstadt University of Applied Sciences, Marker Allee 76-78, Hamm, Germany
2
Biomedical Technology Center, University of Münster, Mendelstraße 17, Münster, Germany
Keywords: Computer Vision, Segmentation, Region Detection, Digital Holographic Microscopy, Quantitative Phase
Imaging, Automatic Cell Detection.
Abstract: This paper presents an analysis pipeline for automatically detecting cells in digitally reconstructed quantitative
phase images acquired by digital holographic microscopy and for computing biophysical cell parameters.
Using an intelligent, integrated image analysis approach, we optimize the overall analysis process which
includes several time-consuming, manual steps. The proposed automatic approach shows promising results
in an experimental comparison with the current manual evaluation process.
1 INTRODUCTION
Quantitative phase images acquired by a digital
holographic microscopy (DHM) can be used for the
analysis of biological cells, e.g. measuring their
reaction to drugs or nanoparticles. Quantitative phase
contrast methods provide contactless, minimally-
invasive imaging and thus examined cells are not
altered, e.g., by fluorescent dyes. Due to the
numerical reconstruction of quantitative phase
images it is possible to determine biophysical
parameters such as cell volume, dry mass and
refractive index numerically (Kemper et al., 2013).
The analysis of cells in digital quantitative phase
images typically involves several time-consuming
steps in the processing pipeline: In order to compute
biophysical cell parameters with high accuracy and
reliability, as described for example in (Kastl et al.,
2017), single cells are manually selected in a
hologram, individually reconstructed and the physical
cell parameters are separately determined via
different software packages. A fast automated
evaluation of a sufficient number of images for
further statistical analysis with an adequate precision
is currently not possible. Modern image processing
and analysis provides techniques to automatically
detect cells in microscopy images, which therefore
allow removing the conventional time-consuming
approach to manually select cells in quantitative
phase images. In addition, digital image processing
allows both, to compute morphological parameters of
cells, and conduct automatic cell identification.
Therefore, this paper presents a pipeline for
automatically detecting appropriate cells in
reconstructed quantitative phase images that is
combined with an all-in-one computation of cell-
specific biophysical parameters in order to optimize
the overall time-consumption of the analysis process.
First, an introduction in digital holographic
microscopy and the possibilities of computing cell
physical parameters from quantitative phase images
is given in sections 2.1 and 2.2. Then, for detecting
individual cells in 2D reconstructed phase images, we
present a suitable image segmentation concept. Based
on the cell segmentation individual biophysical
parameters such as dry mass and cell volume are
determined for each cell automatically. We elaborate
on this analysis step with more details in section 2.3.
In section 3, we present experimental results from
comparing our novel approach with the current
manual evaluation process. Finally, conclusions are
drawn in section 4.
2 METHOD &
IMPLEMENTATION
In this section the underlying digital holographic
microscopy (DHM) principle and the computation of
biophysical cell parameters from quantitative phase
images taken by DHM are described. In order to
Brandt, L., Brinker, K. and Kemper, B.
Automatic Computation of Biophysical Cell Parameters in Digital Holographic Microscopy Images .
DOI: 10.5220/0006585504310437
In Proceedings of the 11th International Joint Conference on Biomedical Engineering Systems and Technologies (BIOSTEC 2018) - Volume 5: HEALTHINF, pages 431-437
ISBN: 978-989-758-281-3
Copyright © 2018 by SCITEPRESS – Science and Technology Publications, Lda. All rights reserved
431
accomplish the automatic computation the last
subsection will deal with the required techniques of
digital image processing, in particular with the
segmentation and object recognition methods used
for cell detection in this paper.
2.1 Digital Holographic Microscopy
Digital holographic microscopy is a method which is
based on the classical principle of holography, where
both the amplitude and the phase of light waves are
stored and reconstructed to produce spatial images of
an object. The principle of holography was
introduced by physicist Dennis Gabor in 1948
(Gabor, 1948). Based on the wave theory of light, it
is assumed that the light propagates in a wavelike
manner with a specific wavelength, amplitude and
phase. For recording a hologram, light from a laser is
divided by a beam splitter into a reference wave and
an object wave. In the case of transillumination,
depending on the optical and geometric properties of
the sample, the phase of the object wave changes.
The object is transmitted by the object wave and
then interferes with the undisturbed reference wave.
Due to the interference with the reference wave, an
interference pattern is formed. In contrast to classical
analog holography, in digital holography (DH) the
hologram is not recorded with a photo plate and again
illuminated with the reference wave for optical
reconstruction. Instead, a charge coupled device
(CCD) sensor is used, which digitizes the intensity of
the interference pattern (digital hologram). The
digital hologram thus contains beside the amplitude
also the information of the phase of the object wave,
which can be digitally reconstructed (Kemper and
von Bally, 2008).
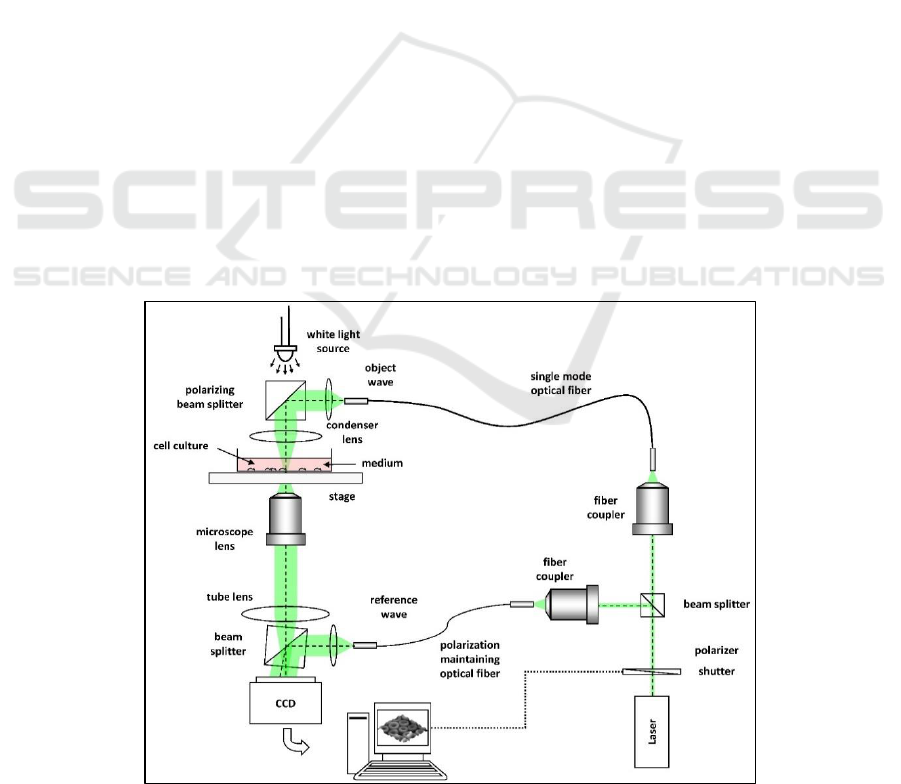
Figure 1 shows the setup for digital holographic
phase contrast microscopy used in this study to
produce digital holograms (Kemper et al., 2006).
Holograms are recorded with an inverted microscope
iMIC (TILL Photonics GmbH, Munich, Germany)
modified for digital holographic microscopy. A
frequency-doubled neodymium: yttrium aluminium
garnet laser, Compass 315M-100 (Coherent GmbH)
with a wavelength of is used as the
coherent light source. A CCD camera, (DMK
41ABF02, The Imaging Source, Bremen, Germany)
and a 10x microscope objective are used for imaging
of the sample and to record the digital holograms. The
resulting digital holograms are transferred to a
computer for numerical reconstruction. The
numerical reconstruction from the digitally captured
holograms is performed by spatial phase shifting in
combination with optional numerical autofocusing
(Langehanenberg et al. 2011).
Figure 1: Digital holographic microscopy set up (adapted from Kemper et al. 2013).
HEALTHINF 2018 - 11th International Conference on Health Informatics
432

2.2 Computation of Biophysical Cell
Parameters from Quantitative
DHM Phase Images
In this section we describehow from the measured
optical pathlength changes in the reconstructed
quantitative phase contrast images of suspended cells
biophysical cell parameters can be determined
(Kemper at al., 2013).
2.2.1 Cell Volume
We assume that the considered cells observed in
suspension are approximately spherical. Hence, the
cross section of the cell surface
is detected as a
circle, the cell radius
can be easily calculated:
(1)
The detected pixel area hast to be converted into
the metric units of the surface area
of the cell in
using the respective scaling factor of the
microscope objective. Since the cells are assumed to
be spherical, the cell volume is:
.
(2)
2.2.2 Dry Mass
The dry mass is defined as the amount of all
substances dissolved in the cell except water. By
utilizing the projected cell surface area
and the
average phase contrast , the cellular dry mass
is computed as (Kastl et al., 2017):
.
(3)
The parameter represents the wavelength of the
laser light in ,
the cross section area in
the mean phase difference induced by the cell,
and a specific constant related to the cellular
content (refractive index increment) (Barer, 1952).
Following (Kastl et al., 2017), the value of is
estimated as
in this work. The mean
phase contrast can be calculated by averaging all
phase values of a quantitative digital holographic
phase contrast image of a cell. The respective phase
contrast values are calculated from the reconstructed
phase contrast image, which is represented in grey
levels (8-bit), by normalizing the intensity of the grey
values and multiplying by the maximum phase
contrast value in the image.
2.2.3 Refractive Index
The refractive index is a material specific parameter,
which quantifies how much the light is delayed while
passing through the sample. It is proportional to the
concentration of the substances dissolved in the cell.
The change in phase contrast depends on the
refractive index of the cell
, refractive index of
the surrounding medium
, and the cell
thickness
:
.
(4)
Using the assumption of a spherical cell shape, by
equations (1), (3), (4) and taking a mean cell thickness
into account, the dry mass evaluates to
(Kastl et al. 2017):
(5)
From equation (5) the cellular refractive index of
can be calculated
.
(6)
Equation (6) shows that that
is an optical
parameter that is directly related to cell volume and
dry mass.
2.3 Automatic Cell Detection
To accomplish the tasks of detecting individual cells
automatically and determine their biophysical cell
parameters from the reconstructed digital holographic
phase images, several pre-processing steps are
required. These steps will be discussed in more detail
in the following subsections.
2.3.1 Image Segmentation
The numerically reconstructed images of cells need to
be segmented, in order to subsequently mark the cells
as contiguous regions. Several pre-processing steps
are carried out in order to obtain an optimal
segmentation result. First, we smoothed the image
with a median filter. The aim here is to eliminate
unevenness in the phase distributions, but at the same
time preserve the important image structures. In order
to make a precise distinction between the foreground
and the background during thresholding and to
account for possible image artefacts, we used the
background subtraction technique. More precisely,
we employed a large Gaussian filter (
) in
order to generate a strongly smoothed image which
Automatic Computation of Biophysical Cell Parameters in Digital Holographic Microscopy Images
433
serves as an approximate model for the image
background.
By subtracting the generated background
reference image, light background patterns (fixed
pattern noise) can be eliminated in the quantitative
phase image and the resulting images can be
effectively segmented. The threshold value is
calculated with the threshold method according to
Otsu to create a binary image (Otsu, 1979). It is
assumed that the pixels of the original grey-scale
image originate from two classes whose distribution
is not known. The threshold value is determined in
such a way that the dispersion of the grey values, i.e.
the variance within a class is as small as possible and
the mean value between the two classes is
simultaneously as far apart as possible (Burger and
Burge, 2009).
2.3.2 Region Detection
After the segmentation, the detection of connected
objects, in this case the recognition of individual areas
as one cell, is required in order to calculate the
individual biophysical cell parameters. For this
purpose, we used simple flood filling to label each
connected region in the binary image. Based on a
labelled image a variety of parameters for each region
such as geometric features as well as intensity-based
information can be computed.
2.4 Implementation
The steps described in the previous section were
developed and implemented in Python. In this work,
the Python version 3.6.1 was used. In addition to the
standard library of Python, for the basic handling of
images, functions from the libraries NumPy and
Pillow were used. In our pipeline the scikit-image
library has been used for object recognition and for
determining the cell parameters. Scikit-image
provides a collection of algorithms for image
processing and computer vision. We used the version
0.13.0 by scikit-image, in particular, functions from
the sub-packs feature, filters, and morphology.
3 EXPERIMENTAL RESULTS
We applied our pipeline to several different
reconstructed DHM quantitative phase images to
analyse the performance of automatically detecting
different cell types. The pipeline detected all cells as
shown in Figure 2 (a) and Figure 3.
In order to evaluate how the data acquired with the
described automatic detection differs from the values
determined with manual detection, the specific
biophysical parameters were computed and compared
for both approaches.
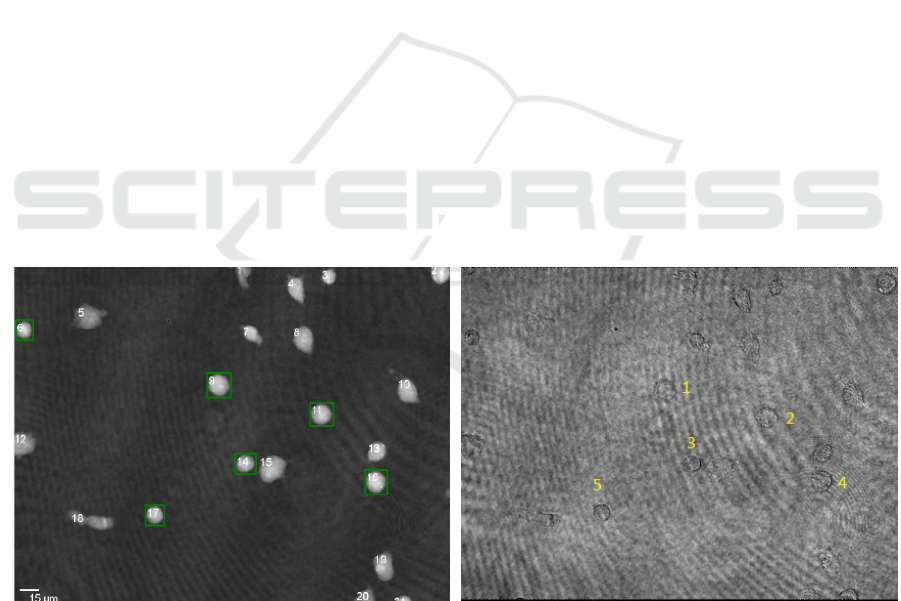
(a)
(b)
Figure 2: (a) shows the cells detected automatically in a quantitative DHM phase contrast image. The green boxes mark cells
with a form factor > 0.88. (b) shows the corresponding cells manually selected cells in the associated amplitude image.
HEALTHINF 2018 - 11th International Conference on Health Informatics
434
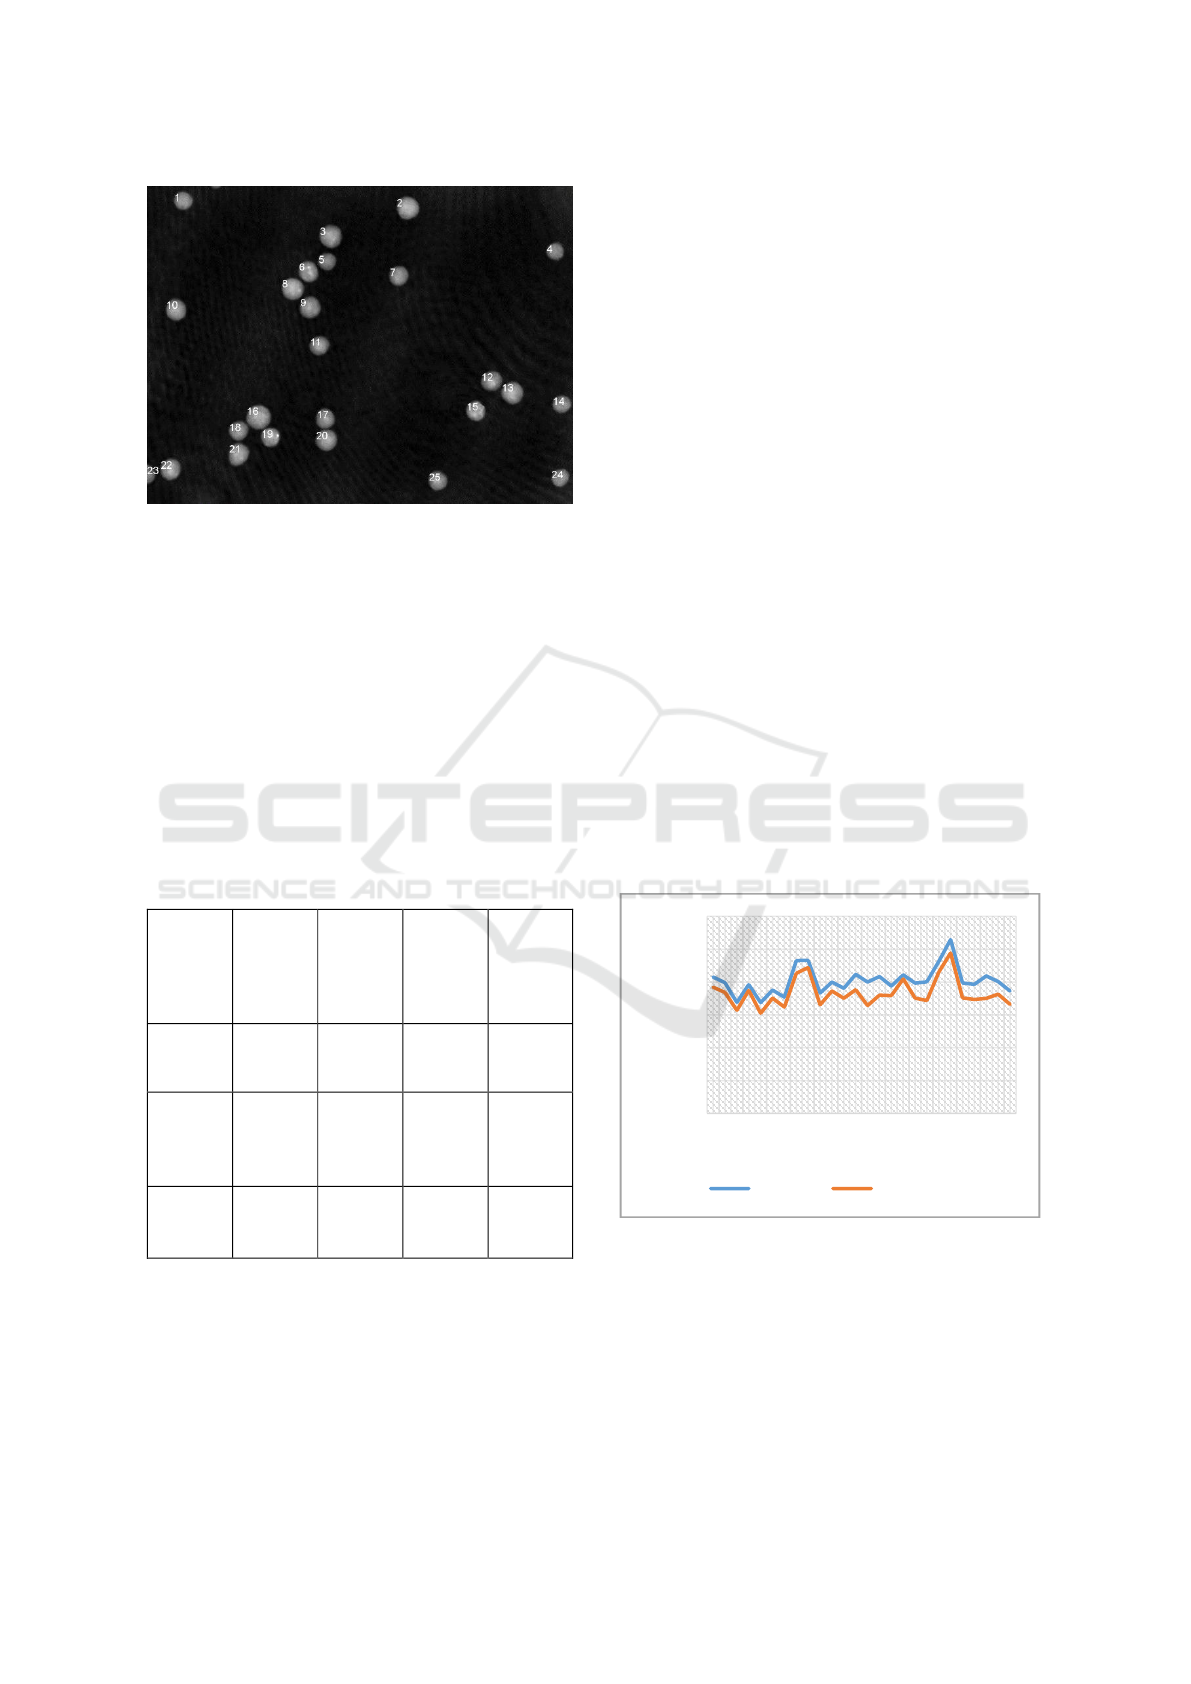
Figure 3: Detected and labelled cells in quantitative DHM
phase contrast images of suspended PaTu 8988T cells using
the developed pipeline.
Using an image series of ten quantitative phase
contrast images of suspended pancreatic tumour cells
(PaTu 8988T) and literature values from (Kastl et al.,
2017) the accuracy of the pipeline was analysed. In
the image series, a total number of 254 cells were
automatically detected and 189 cells with a form
factor higher than 0.88 were further evaluated for
biophysical parameters. The cells which were used
were marked with a green bounding box (Figure 2).
The statistical results can be represented as follows:
Table 1: Radius, refractive index and dry mass retrieved
from 189 automatically detected PaTu 8988T cells.
Mean
Minimum
Maximum
Standard
Deviation
Radius
[µm]
7.4768±
0.0581
5.6998
10.0785
0.7976
Dry
mass
[ng]
0.234
0.006
0.0764
0.6097
0.0826
Ref.
index
1.3637
0.0001
1.3637
1.3693
0.0001
For the PaTu 8988T cells, a refractive index of
and a radius of
= were determined
using the described pipeline. Literature values
specified in (Kastl et al., 2017) for the refractive index
for the PaTu 8988T cells are
and for the radius
. The comparison of
the mean cell radii of the two measurement series
shows that the results from the pipeline are
significantly smaller than the literature value, which
leads to an underestimation of the actual dry mass.
In order to obtain a more accurate comparison of
the specific biophysical parameters, a further analysis
was carried out to evaluate the differences in more
detail. The biophysical cell parameters were
determined from five different phase contrast images.
Therefore, each reasonable cell in the region of
interest was detected manually by a person. Then an
individual phase image of the region was
reconstructed from the hologram and the parameters
were calculated manually with different software
components. A total number of 26 cells were included
in the evaluation. The identical cells were
automatically detected in overall reconstructed phase
contrast images of all cells.
Compared to the manual method, the process of
the automatic analysis is many times faster. The
whole quantitative phase contrast image is evaluated
at once rather than individually selecting and
reconstructing each cell and conducting further
analysis steps.
The direct comparison of the calculated
parameters, shows that the radius and dry mass of the
cells determined after automatically detecting them
shows the same tendency but are lower than manually
determined values.
Figure 4: Comparison of the radii of 26 PaTu 8988T cells
determined in by automatic evaluation and manual
detection.
0
2
4
6
8
10
12
1 3 5 7 9 11 13 15 17 19 21 23 25
radius [µm]
cells
manual automated
Automatic Computation of Biophysical Cell Parameters in Digital Holographic Microscopy Images
435
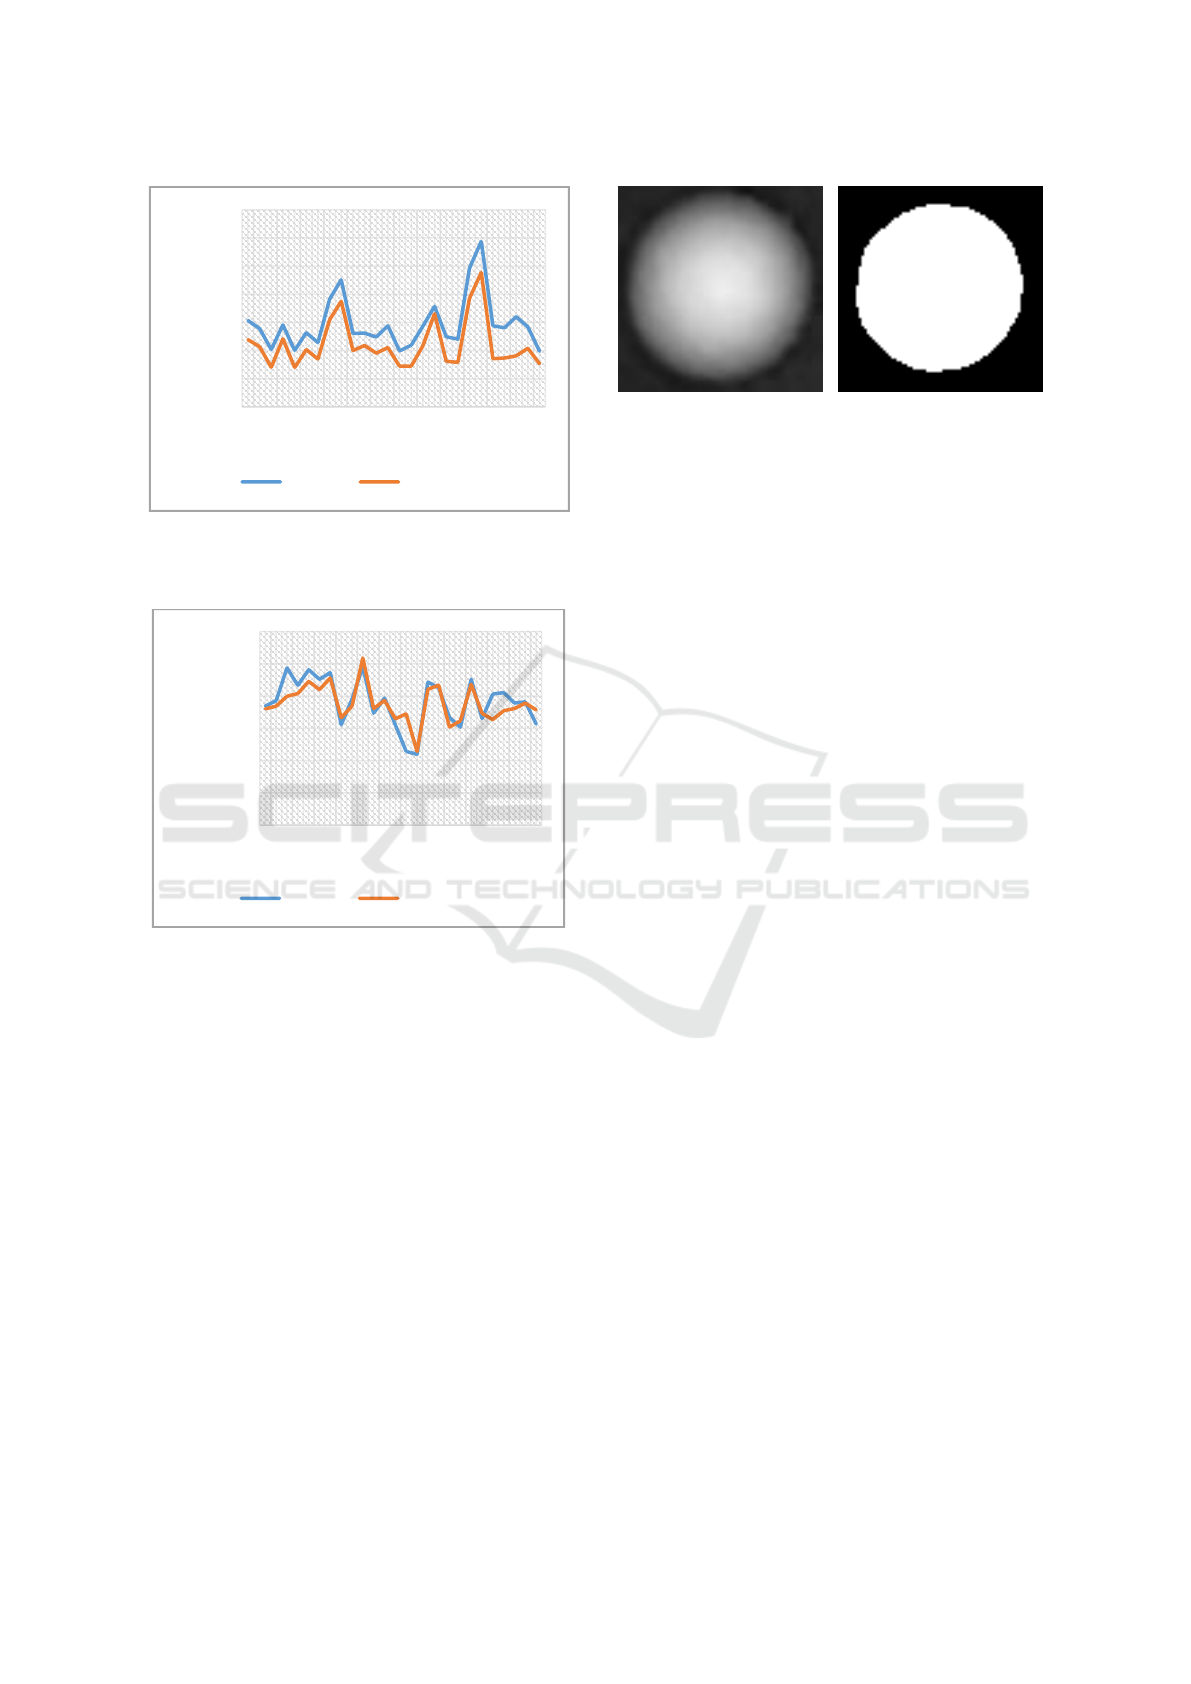
Figure 4: Comparison of the dry mass of 26 PaTu 8988T
cells determined by automated evaluation and manual
detection.
Figure 5: Comparison of the refractive indices of 26 PaTu
8988T cells determined by automated evaluation and
manual detection.
When comparing the quantitative phase images of
an individual cell with the corresponding binary
image (Figure 6), it becomes obvious that the Otsu
segmentation method used in our approach and the
pre-processing steps do not completely assign the
outer edge regions to the cells. Since the edge region
has no sharp edge structure, the segmentation process
is challenging. As a result, the cells are detected with
a smaller area than the real surface, which leads to
deviations of the biophysical parameters.
(a)
(b)
Figure 6: Image sections of an individual cell. (a) shows the
original quantitative phase image. (b) shows the
corresponding segmented image section.
The cell radius and the dry mass are both
dependent on the detected pixel area, which depends
on the segmentation result of the image. Overall, the
cell radii are about 9.2% smaller than calculated after
individual manually detection, which leads to a
smaller estimated dry mass of the cells.
4 CONCLUSIONS
This paper presents an approach for automatically
detecting cells in quantitative digital-holographic
phase-contrast images and for determining their cell-
specific biophysical parameters using digital image
processing and analysis. The biophysical parameters
accessible by quantitative phase contrast microscopy,
i.e., cell size, cell volume, dry mass and refractive
index, were determined automatically in
reconstructed images of several cells that were
observed in the suspension. The proposed processing
pipeline allows to conduct a fully automated detection
and calculation of the cell parameters, which
simplifies the process compared to detecting them
manually for the measurement of individual cells.
This pipeline reduces the time complexity by a
computer added process optimization, which offers a
significantly increased throughput in the evaluation
of individual cells. The results in section 4 show that
automated detection of suitable cells by using their
form factor and calculation of the cell-specific
biophysical parameters is possible. However, the
direct comparison with results from the manual
evaluation of individual cells indicates that the
detected cell surfaces exhibit deviations due to the
segmentation process used. Therefore, the calculated
parameters for cell radius, cell volume and dry mass
are lower than expected. For this reason, further
research is required to optimize the segmentation
process. In addition, further systematic investigations
should be carried out on functional testing, as well as
0
0,1
0,2
0,3
0,4
0,5
0,6
0,7
1 3 5 7 9 11 13 15 17 19 21 23 25
dry mass[ng]
cells
manual automated
1,345
1,35
1,355
1,36
1,365
1,37
1,375
1 3 5 7 9 11 13 15 17 19 21 23 25
refrative index
cells
manual automated
HEALTHINF 2018 - 11th International Conference on Health Informatics
436

on possible correction factors. In summary, the
developed pipeline represents a promising alternative
to the current evaluation process of the cells. In
particular, the automated detection and the time
reduction are an important advantage with regard to
the significant increase of measured data. The errors
caused by underestimated cell areas during the
segmentation have to be improved in the future in
order to enable a more accurate retrieval of the
biophysical cell parameters. Moreover, in addition to
a quantitative evaluation of suitable segmentation
methods for cross section image reconstructions, it
seems to be promising to consider more advanced
segmentation approaches which incorporate the
special structure of holographic image data for cell
boundary detection.
REFERENCES
Barer, R., 1952, Interference Microscopy and Mass
Determination, Nature 1952; 169:366-367.
Burger, W., Burge, M. J., 2009, Principles of Digital Image
Processing: Core Algorithms. Springer.
Gabor, D., 1948, A New Microscopic Principle, In Nature
Vol.161, .777-778.
Kastl, L., Isbach, M., Dirksen, D., Schnekenburger, J.,
Kemper, B. 2017, Quantitative Phase Imaging for Cell
Culture Quality Control, Wiley Online Library (DOI
10.1002/cyto.a.23082.
Kemper, B., Carl, D., Höink, A., von Bally, G., Bredebusch,
I., Schnekenburger, J., 2006. Modular Digital
Holographic Microscopy System for Marker Free
Quantitative Phase Contrast Imaging of Living Cells,
Proc. SPIE 6191, 61910T.
Kemper, B., Langehanenberg, P., Kosmeier, S.,
Schlichthaber, F., Remmersmann, C., Von Bally, G.,
Rommel, C., Dierker, C., Schnekenburger, J., 2013.
Quantitative Phase Imaging with Digital Holographic
Microscopy and Applications in Live Cell analysis. In
Tuchin (Ed.), Handbook of Coherent-Domain Optical
Methods, Springer 215-257.
Kemper, B., von Bally, G., 2008. Digital Holographic
Microscopy for Life Cell Applications and Technical
Inspection, Appl. Opt. 47, A52-A61.
Langehanenberg P, von Bally G, Kemper B., 2011.
Autofocusing in Digital Holographic Microscopy. 3D
Res 2011; 2:1–11.
Lenz, P., Brückner, M., Ketelhut, S., Heidemann, J.,
Kemper, B., Bettenworth, D., 2016, Multimodal
Quantitative Phase Imaging with Digital Holographic
Microscopy Accurately Assesses Intestinal
Inflammation and Epithelial Wound Healing, JOVE
e54460.
Otsu, N., 1979. A Threshold Selection Method from Gray-
Level Histograms, IEEE Transactions on Systems,
Man, and Cybernetics, vol. 9, no. 1, pp. 62-66.
Automatic Computation of Biophysical Cell Parameters in Digital Holographic Microscopy Images
437
