
Automatic Counting of Wheat Spikes from Wheat Growth Images
Najmah Alharbi
1
, Ji Zhou
2,3
and Wenjia Wang
4
1
Faculty of Science and Engennering of Computers, Taibah University, Yanbu, K.S.A.
2
Earlham Institute, Norwich Research Park, Norwich, U.K.
3
Nanjing Agricultural University, China
4
School of Computing Sciences, University of East Anglia, Norwich, U.K.
Keywords:
Wheat Spikes, Counting, Gabor Filter, K-means, Segmentation, Clustering, Regression.
Abstract:
This study aims to develop an automated screening system that can estimate the number of wheat spikes (i.e.
ears) from a given wheat plant image acquired after the flowering stage. The platform can be used to assist
the dynamic estimation of wheat yield potential as well as grain yield based on wheat images captured by
the CropQuant platform. Our proposed system framework comprises three main stages. Firstly, it transforms
the wheat plant raw image data using colour index of vegetation extraction (CIVE) and then segments wheat
ear regions from the image to reduce the influence of the background signals. Secondly, it detects wheat ears
using Gabor filter banks and K-means clustering algorithm. Finally, it estimates the number of wheat spikes
within extracted wheat spike region through a regression method. The framework is tested with a real-world
dataset of wheat growth images equally distributed from flowering to ripening stages. The estimations of the
wheat ears were benchmarked against the ground truth produced in this study by human manual counting.
Our automatic counting system achieved an average accuracy of 90.7% with a standard deviation of 0.055, at
a much faster speed than human experts and hence the system has a potential to be improved for agricultural
applications on wheat growth studies in the future.
1 INTRODUCTION
Wheat is one of the major crops in the world. Ac-
cording to Food and Agriculture Organisation of the
United Nations, the worlds demand for wheat is ex-
pected to reach 850 million tons by 2050 (Alexan-
dratos and Bruinsma, 2012), which is clearly out-
pacing current supply. With constant reduction of
agricultural land and extreme weather conditions
throughout the growing season, wheat production be-
comes ever more challenging worldwide (Pinto et al.,
2010).
Precision agriculture is one of many technolo-
gies developed in recent agricultural practices with an
aim of maximising the crop yields from limited land
through making sound decisions of agronomic activi-
ties and crop management so that appropriate actions
can be taken at the right time in the right place (Pask
et al., 2012; Geipel et al., 2014).
Precision agriculture relies on monitoring and
measuring the growth of crops on real time at every
stage from breeding, planting of crops to harvest (?).
With rapid advances on data acquisition techniques,
it is now much easier and relatively cheaper to col-
lect and store a huge amount of crop-climate multime-
dia data by various devices, such as satellites (Lobell,
2013), drones and fixed workstations (Geipel et al.,
2014; Zhou et al., 2017), to obtain all possible mea-
sures and direct visual representations of crop grow-
ing status. However, inspecting and analysing such
a sheer amount of data is extremely time-consuming
and unrealistic for manual labour processes (Cobb
et al., 2013; Zhu et al., 2016).
In wheat production, it is now possible to em-
bed state-of-the-art machine learning techniques to
automate some precision agriculture activities, such
as monitoring the key growth traits during growing
stages and forecasting the yield.
Forecast the yield of wheat crop at a specific field
as earlier as possible is a very important task. But
up do date, it has been mostly done manually by
agricultural experts, who use their experience to esti-
mate the yield through inspecting a crop and counting
the number of spikes per unit to estimate the average
crop density. This task is obviously time-consuming,
less cost-effective and also inaccurate. Given that the
346
Alharbi, N., Zhou, J. and Wang, W.
Automatic Counting of Wheat Spikes from Wheat Growth Images.
DOI: 10.5220/0006580403460355
In Proceedings of the 7th International Conference on Pattern Recognition Applications and Methods (ICPRAM 2018), pages 346-355
ISBN: 978-989-758-276-9
Copyright © 2018 by SCITEPRESS – Science and Technology Publications, Lda. All rights reserved

photographic images of growing wheat plants can be
quickly obtained in a large quantity in real time, it is
logical to develop a computing system to perform this
task automatically and efficiently.
This paper presents an automated framework that
utilizes computer vision and machine learning tech-
niques to count the number of wheat spikes from
time-lapse wheat growth images. The test results
show that it can achieve an accuracy of 90.7% on real
world wheat plant images.
The rest of the paper is organised as follows. Sec-
tion 2 reviews the related work. Section 3 describes
the proposed framework and the methods used in the
framework. Section 4 gives and evaluates the exper-
imental results. The final section draws conclusions
and suggests some possible further work.
2 RELATED WORK
Several studies, such as Germain et al. (1995); Coin-
tault and Gouton (2007); Cointault et al. (2008, 2012);
Liu et al. (2015); Zhu et al. (2016), etc. have utilised
image-based automatic object counting methodolo-
gies in precision agriculture and other areas.
Rangole and Pandit (2014) conducted a survey of
object counting methods, in which they noted that
“object counting is a challenging problem in image
processing, ... [due to its dependence] on estima-
tion of certain elements that act as a source of in-
formation.” Some research addressed counting prob-
lem in fully unsupervised manner but their accuracies
are limited and mostly unsatisfactory. Others, such
as Lempitsky and Zisserman (2010) explored super-
vised learning approaches, which require pre-defined
labelled data to train the algorithm.
Segui et al. (2015) explained that “counting the
number of instances of an object in an image can
be approached from two different perspectives: 1)
training an object detector, or 2) training an object
counter”. They further noted that, in the former “we
must provide the system with a large set of object ex-
amples, properly labelled and localized, that represent
most of the possible views and appearances of the ob-
ject, and the result is an object classifier” (Segui et al.,
2015), whereas, for the latter “we only need to pro-
vide the number of object instances for each image
sample and the result is typically a regressor” (Segui
et al., 2015).
A feasibility study on using computer vision tech-
niques was conducted by Guerin et al. (2004) to
count wheat ears. They developed a hybrid space of
coloured texture with 138 attributes based on six tex-
tural features generated from Haralick method, first
order statistic respectively and twenty-three features
from main colour system and vegetation indices. The
combination of this technique with a Multi-Layer Per-
ceptron (MLP) neural network, resulted in a repre-
sentation for wheat images taken under natural con-
ditions and better extraction of wheat ears with fewer
errors that solved by mathematical morphology.
Zhao et al. (2015) asserted that specifying the num-
ber of grains on a maize ear is an essential param-
eter in the corn variety testing procedure, and pro-
posed a new image segmentation algorithm and an
automatic counting method of maize grains, based
on image processing of high quality data, in a more
efficient manner than previously used manual mea-
surement methods. Their proposed method com-
bines multi-threshold segmentation and row-by-row
gradient-based method (RBGM) based upon Otsu al-
gorithm. Their method outperformed the traditional
threshold algorithms with the counting accuracy as
high as 96% on their test data. However, this task
is relatively easier compared with in-field wheat ears
counting because each image in their dataset contains
only one completed opened maize ear on a clear black
background and the grains are quite regularly aligned
in rows, hence there is no overlap between maize ears
and grains.
Liu et al. (2015) developed an image processing-
based algorithm to count wheat seedlings automati-
cally in a natural field environment. In their algo-
rithm, a threshold value needs to be determined as a
starting point to deal with overlapped seedlings. Their
method involved the extraction of wheat seedlings
from background noise, i.e. none-seedling regions, by
using a process called the Excess Green value (ExG).
A combination of the ExG and Otsus method was then
applied in order to extract the wheat seedlings infor-
mation. As a result, the background noise and holes
(i.e. very small spots in the resulted binary image)
that were found in the extracted images were resolved
through the implementation of a mathematical mor-
phology and hole-filling algorithm.
Another form of vegetation indices alike ExG,
known as Colour Index of Vegetation Extraction
(CIVE), was explored by some researchers such as
(Kataoka et al., 2003; Guijarro et al., 2011; Montalvo
et al., 2016). CIVE is now widely used in agronomic
applications where the objective is to properly sepa-
rate the plant, i.e. the green areas, from other objects
within agricultural images such as sky, soil, etc.
Germain et al. (1995) demonstrated the ineffi-
ciency of using colour analysis technique to identify
wheat ear pixel due to the noted lack of colour di-
versity amongst stems, leaves, and ears. They ar-
gued that grey scale thresholding did not provide a
Automatic Counting of Wheat Spikes from Wheat Growth Images
347

sufficiently functional basis upon which to classify
wheat ears due to the variation of heights for ears
and leaves, and complicating issues such as the pres-
ence and other variable lighting conditions, which re-
sulted in too many classification errors. The solution
that they proposed involved the use of texture analysis
to differentiate wheat ears, leaves, stems and ground,
which led them to develop a two-tier method based on
image processing comprising an estimation of rough-
ness feature through the use of a roughness indica-
tor alongside the parallel use of a 7x7 pixel window
as a neighbour, and the application of a user-defined
thresholding process. This approach generated two
classes in the obtained image: wheat-ear pixels and
non wheat-ear pixels, which resulted in the few, small
area errors identified being corrected by morpholog-
ical filtering. This classification technique simplified
the subsequent counting operation, which required to
spilt intersection of wheat ears where they used skele-
tons.
Cointault et al. (2008, 2012) carried out a feasibil-
ity study for estimating the number of wheat ears in
per square meter by constructing a (semi-) automatic
counting based on hybrid space, and Fourier filter. In
the former features were extracted by employed hy-
brid system consists of five Haralick’s features and
statistical analysis, whereas the latter was used high-
pass filtering approach. After extracting these fea-
tures out from the images, they applied K-means, and
other supervised learning methods based on distance
measurements, for instance, Manhalanobis distance,
to cluster the areas of the images and then estimate the
number of wheat ears through pixel classification, and
mathematical morphology tools. They tested their
methods randomly on five images taken from wheat
fields and found that their best results are quite close
to the counts produced by human expert, whilst they
observed that counting based on Fourier filter was
outperform the hybrid system in terms of calculation
time, which took few seconds.
Bairwa et al. (2014) developed an automatic
counting algorithm based on computer vision tech-
niques using a dataset derived from Gerbera flowers
analysed under polyhouse conditions, which provided
an 89.86% accuracy level. Gaussian filter was used in
order to remove noise, and conversion RGB colour
space to HSV colour space, thereafter flowers regions
were recognised, and extracted based on the value
component of HSV. Then, a sequence of morphologi-
cal operations was employed to handle the overlapped
flowers and enhance the algorithm counting accuracy.
Zhu et al. (2016) proposed an automatic computer
vision–based observation system for wheat heading
stage, i.e. completely emergence of wheat ears but
have not yet started flowering. It comprised decorre-
lation stretching and hybrid colour space techniques
for images pre-processing and a two-step coarse-to-
fine wheat ear detection component. The coarse-
detection step applied machine learning technology
to identify the interested ear regions, whilst the fine-
detection step eliminated non-ear areas using dense
Scale-Invariant feature transform [SIFT] and Fisher
Vector (FV) to generate features to recognise the fine
regions that were detected as ears using Support Vec-
tor Machines [SVM]. The Principal Component Anal-
ysis (PCA) was used to reduce the dimensionality of
features. Their test results show that their combined
method of SIFT, PCA and FV produced the best ac-
curacy of about 67%, whilst other competing methods
got between 48 to 60%.
It can be seen that although their combined
method improved considerably, it is still not accurate
enough for real application. Therefore, there is a need
for developing more efficient and accurate method for
this problem.
3 METHODS
The challenge in counting wheat spikes (ears) comes
from the two difficult obstacles that present in natural
wheat plant images, which are: the objects captured
on an image – wheat plants and spikes/spikelets in
particular, overlap and occlude. Direct observations
on the wheat plant images used in this study clearly
revealed that they suffered severely from these prob-
lems and thus make the accurate counting of wheat
ears on a noisy image very challenging.
The framework we proposed for solving this prob-
lem, as shown in Fig.1, includes three main stages:
Pre–processing, Segmentation and Counting. The
first step is to carry out necessary pre–processing on
the raw image data, including resizing, normalisation
and transformation. The main aim of the second stage
is to extract the desired foreground, i.e. the specific
region of interest, from the noisy background, and
then group them accordingly. This step has a definite
and significant impact on the subsequent counting re-
sults. The main task of the third stage is to count all
the wheat ears on a given image. The details of how
these three stages work will be given in the following
subsections.
3.1 Image Pre-processing
The goal of image pre-processing is to apply various
techniques to process and transform raw images into
some good structured representations of the images.
ICPRAM 2018 - 7th International Conference on Pattern Recognition Applications and Methods
348
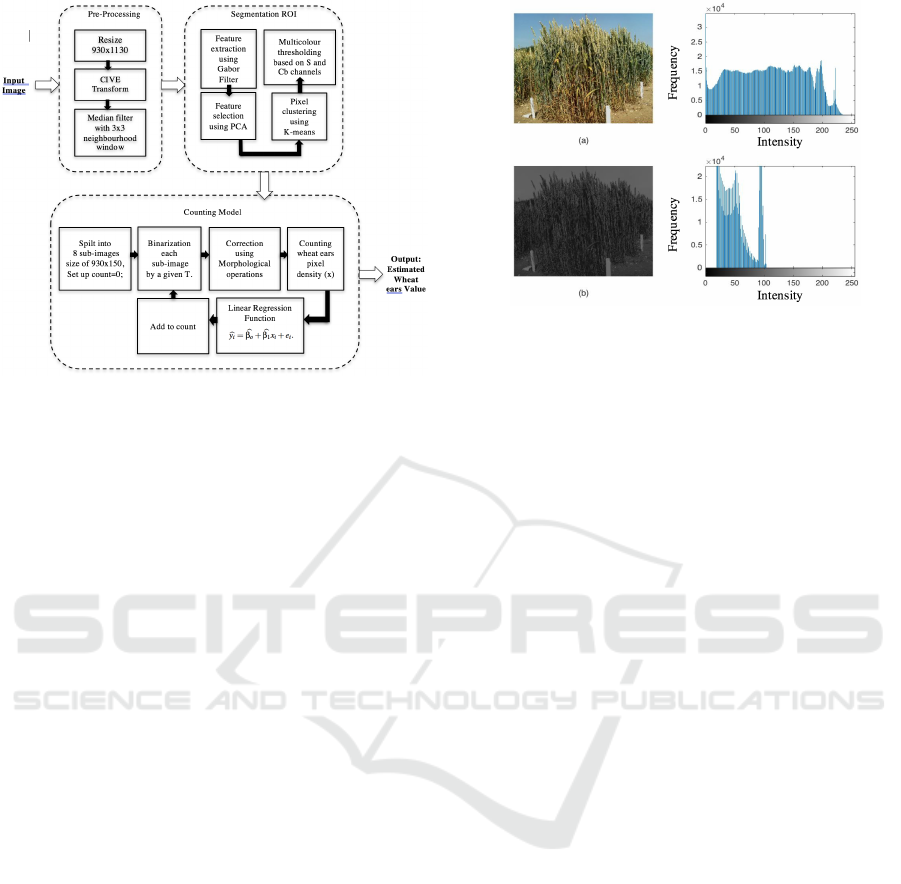
Figure 1: The designed counting system framework.
As the data of the raw images was acquired from a lo-
cal wheat field, they contained all sorts of noises, var-
ious backgrounds and high-level of overlaps of wheat
plants and ears. So, it is essential that some appro-
priate pre–processing techniques should be applied in
several steps to facilitate the transformation of raw
images into a “clean” format ready for the subsequent
stages, including feature extraction and analysis. Two
pre–processes were carried out: Transforming and fil-
tering.
The first is to transform the raw image from RGB
colour space to grey-scale space using the CIVE
(colour index of vegetation extraction) method be-
cause, as reviewed in the related work section, it is
one of the most commonly used methods. It can make
the regions of wheat ears brighter than the non-ear re-
gions, which then become very dark. The CIVE we
adopted in this study is given as follows:
CIV E = 0.441R + 0.811G + 0.385B + 18.7874 (1)
With the CIVE, for each pixel in an given image, its
intensity values of R, G and B channels are trans-
formed to a grey-scale value to form a grey–scale im-
age. Fig.2 shows an example of the transforming re-
sults of using the CIVE technique.
The second is to apply a median filter with a 3x3
neighbourhood window. Theoretically a median fil-
ter is a non–linear smoothing method, which aims to
eliminate impulse noise in a given image with edge
preserving, and works by replacing each pixel in the
original image with the median value of a neighbour-
hood points (i.e. a predefined kernel).
Figure 2: Transformation to grey-scale, (a) original in-field
wheat image and the corresponding grey-level distribution
histogram, (b) the processed image after using CIVE and
the corresponding histogram.
3.2 Segmentation
Segmentation stage is to separate the foreground of
an image that contains a region/area of interest from
the backgrounds that hold other not–interested ob-
jects and/or areas. Segmentation is usually carried
out in two steps: feature extraction and segmentation.
Various methods could be used to extract distinguish-
able features from an image. In this work, Gabor fil-
ter technique is used for feature extraction and then
the PCA is used to select the most important com-
ponents constructed by the extracted features in or-
der to reduce the dimensionality. Segmentation could
be done with either supervised or unsupervised ap-
proaches and K-mean algorithm is chosen for pixel’s
clustering due ot its simplicity and efficiency.
After segmentation is done, each pixel has been
allocated to a specific region/object in a given image,
based on their similarity in features and/or properties.
The details of these two steps are described below.
3.2.1 Feature Extraction
There are various sets of features that could be ex-
tracted out from an image, which include statistical
features, texture features, grey and colour features,
shape features, and frequency features etc. After
some initial analysis, we thought for our task, some
sets of features could be more useful than others, for
example, colours may be less relevant and hence it
is unnecessary to extract colour features, instead, it
could be more effective and efficient to transform an
colour image to a grey image. This is the rational
behind the colour–to–grey transformation in the pre–
processing stage.
Moreover, in wheat image texture analysis, this
study found that Gabor filter developed has almost
Automatic Counting of Wheat Spikes from Wheat Growth Images
349
perfectly separated the different texture elements, i.e.
texels, within a given wheat image.
Gabor Filter works based on multi-channel filter-
ing theory, which transforms the visual information
in the same way that the early stages of human visual
system do, which “decompose the retinal image into
a number of filtered images, each of which contains
intensity variations over a narrow range of frequency
(size) and orientation” (Jain and Farrokhnia, 1991).
In other words each channel represents a responsive
mechanism that responds to a selective frequency-
orientation, which is known as band-pass filters. In
this work a bank of even-symmetric of 2D Gabor fil-
ters (Jain and Farrokhnia, 1991) was designed as fol-
lows.
For a given wheat plant image I(x,y), its respon-
sive impulse of an even-symmetric Gabor filter can
be computed by:
h(x,y) = exp{−
1
2
[
x
2
α
2
x
+
y
2
α
2
y
]}cos(2πµ
o
x) (2)
Where: µ
o
is the frequency of a sinusoidal plane wave
over the x-axis (i.e. the orientation ). α
x
, and α
y
are
the constant of the Gaussian envelope over the x and y
axes, respectively. In addition, the Gabor filter is ex-
plicated by its frequency domain, which specifically
uses the Fourier domain representation of (3.3.1), and
is given by:
H(x,y)=A(exp{−
1
2
[
(µ−µ
o
)
2
α
2
µ
+
ν
2
α
2
ν
]}+exp{
1
2
[
(µ+µ
o
)
2
α
2
µ
+
ν
2
α
2
ν
]}) (3)
Where,
α
µ
=
1
2πα
x
,α
ν
=
1
2πα
y
,A = 2πα
x
α
y
. (4)
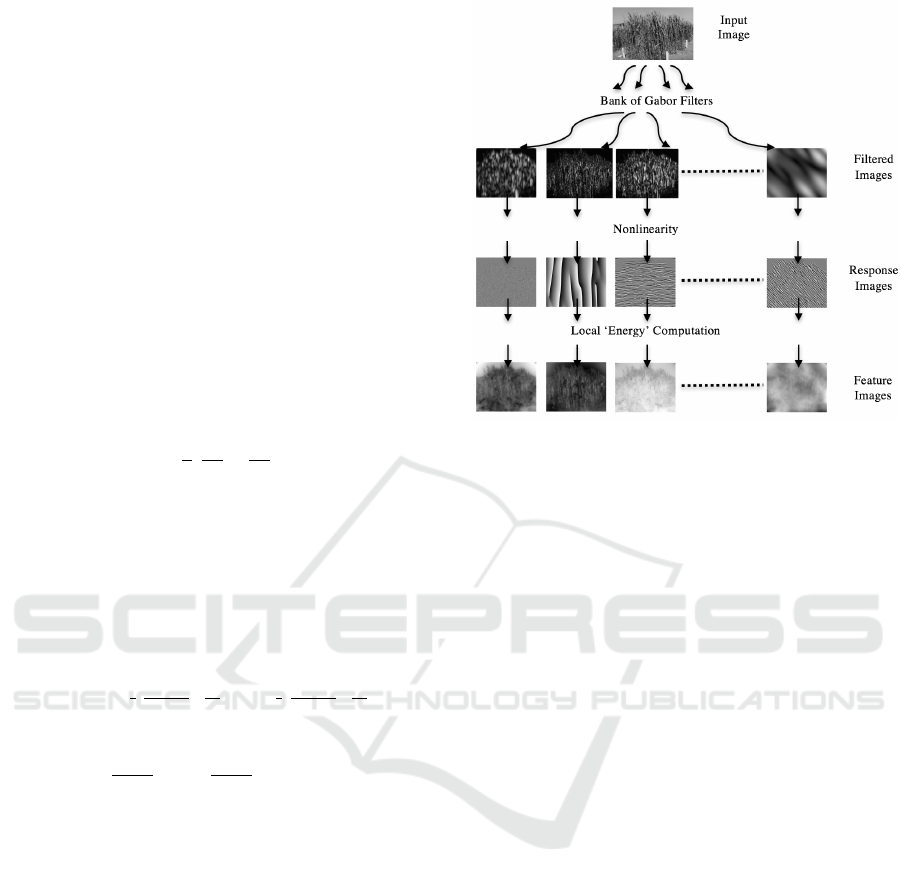
Fig.3 showed an example of texture analysis for a
given wheat image using the 2D Gabor filters.
In this research, as the size of a wheat plant im-
age is 930 x 1130, after applying the Gabor filters,
1,050,900 pixels * 34 features are produced, which
are obviously too many for analysis and should be re-
duced by some dimensionality reduction methods.
3.2.2 PCA for Dimensionality Reduction
Principal Component Analysis (PCA) is chosen to re-
duce the dimensionality of the extracted feature space
and also to possibly improve computing complexity
in time and memory space. The central idea of the
PCA is to transform a number of interrelated variables
into a new set of orthogonal features called Principal
Components (PCs) (Jolliffe, 2002).
When applied to our data, the PCA identified the
first two principal components, which can be inter-
preted as texture descriptors for the wheat ears region
Figure 3: A sample of in-field wheat image, and its corre-
sponding texture analysis using the Gabor filters.
(i.e. our target). This allowed the segmentation algo-
rithm to work on a much reduced dimensionality of
data to 1,050,900 pixels * 2 features only, instead of
34 dimensions.
3.2.3 Unsupervised Pixel Classification
K-means is arguably the most commonly used unsu-
pervised learning algorithm for its simplicity and effi-
ciency, which groups data points into a pre-set k clus-
ters. It has been applied in clusterings objects and
predicting yields (Sonka et al., 2015). There are how-
ever two downsides for an algorithm like this, first, it
is very sensitive to the initial randomly chosen data
centroids, meaning that its clustering result could be
unstable. Another one could be over-segmentation,
which leads to mis–clustering of the neighbour’s pix-
els into a specific ROI.
In this study, both the above-mentioned draw-
backs were resolved through semi-supervised man-
ners by assigning/changing cluster region numbers at
appropriate moments and multi-colour thresholding
using S channel from HSV colour space and Cb chan-
nel from YCbCr colour space, respectively to clear up
the erroneous clustering result of K-means.
Figures 4 and 5 show a sample of wheat image
data before and after using PCA and K-mean on our
system.
3.3 Image Post-processing
As shown above, some pixels can be falsely clustered
and the possible reasons include poor feature extrac-
ICPRAM 2018 - 7th International Conference on Pattern Recognition Applications and Methods
350
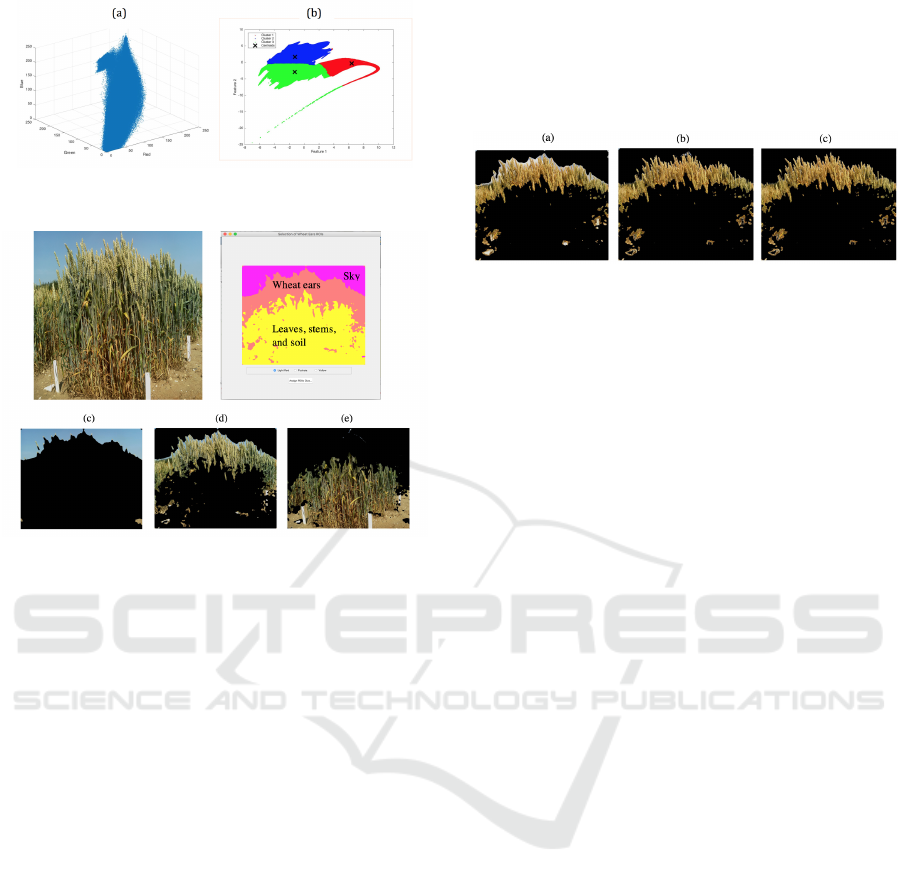
Figure 4: (a) An image raw data is projected in 3D.
(b) A clustering result based on the first two PCA features.
Figure 5: Classification results after K-means clustering, (a)
original image, (b) clusters displayed on the GUI of our sys-
tem, (c) sky in fuchsia cluster, (d) ROI (wheat ears) in light-
red cluster, (d) leaves, stems, and soil in yellow cluster.
tion techniques used or the segmentation algorithm
employed. These undesirable results, however, can
be detected and corrected by image post-processing
steps, to improve the segmentation of wheat ear re-
gions as accurately as possible. Further investigations
of the segmentation results were then conducted and
found that the obtained results mistakenly included
the pixels from the sky, soil, stems and leaves that
are evident on the images in our dataset. However, as
shown in Fig.5, the wrongly-identified pixels could be
successfully eliminated by using multi-colour thresh-
old method as described below.
3.3.1 Segmentation based on Multi-colour
Threshold
In histogram thresholding, the colour channels in
colour space can be restricted by a range of defined
intensity values based on a channel histogram, with a
purpose of removing some unwanted information or
areas from an image, for example, those pixels related
to sky. As a result, a binary image is produced as a
masked image. This masked image is used to outline
the desired region in the original image. Here, multi-
colour histogram thresholding method was used in or-
der to remove the rest of the sky and other unwanted
pixels or regions.
The threshold value, denoted as T, can be chosen
from the following values T = 0.68, 0.58, 0.48 based
on the image growth level.
Fig.6 shows an example of the results of our post-
processing method.
Figure 6: Wheat plant image segmentation results after the
post-processing: (a) the resulted wheat ears segmentation
from the preceding method; (b) & (c) the results of his-
togram thresholding based on S, Cb channels, respectively.
In addition, removing the soil spots from the
segmented ROI in order to hold wheat ears region
only, was facilitated by a sequence of morphologi-
cal operations, inspired by the work such as Germain
et al. (1995); Kalapala (2014); Aradhya and Pavithra
(2016), and their details are given below.
3.3.2 Final Correction using Morphological
Operations
After thresholding, a sequence of morphological op-
erations was employed such as image dilation with
rectangular structure element 4x5. Then all small
connected areas of less than 600 pixels with 4 con-
nected pixels as argument were removed.
Fig.7 presents the results of morphological oper-
ations at different stages, and the final result of seg-
mented wheat ears region.
3.4 Counting Wheat Ears
Counting wheat ears on a wheat plant image is the last
task of the framework, which is the ultimate goal of
this research and could be achieved by several ways
on the segmented image. We adopted a method based
on Linear Regression for its simplicity and also rea-
sonable effectiveness shown on counting persons in a
crowd (Velastin et al., 1994). The method of wheat
ears counting consists two steps: data preparing and
the regressing model training.
3.4.1 Preparing Data
Based on literature, in general, a machine learning al-
gorithm may not learn and do well due to the potential
of over-fitting or insufficient information represented
in the data. So, to achieve a better generalised learn-
ing, the training dataset should be as large as possible.
Automatic Counting of Wheat Spikes from Wheat Growth Images
351
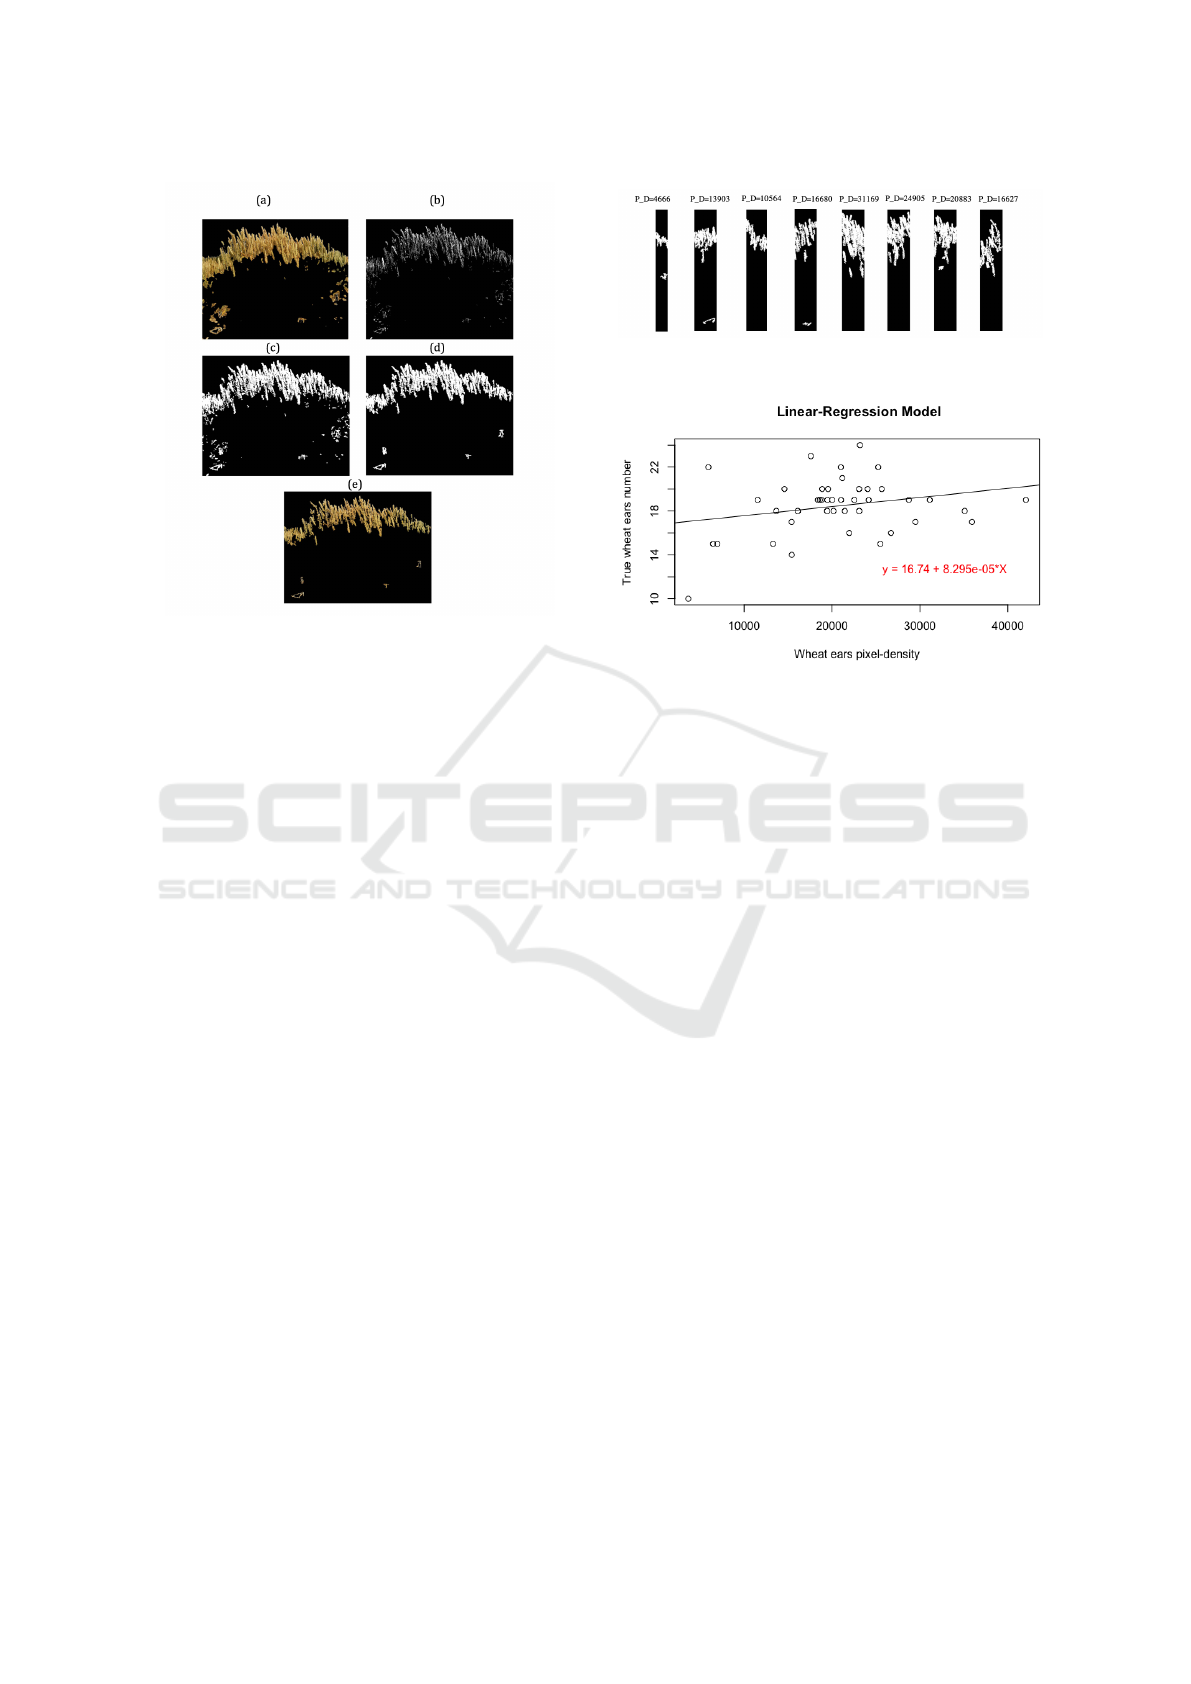
Figure 7: Segmentation results after a sequence of morpho-
logical operations: (a) the result from the previous step, (b)
binarization with T = 0.68, (c) dilation with 4*5 structure
element size, (d) removal of small areas less than 600 pix-
els, (e) the masked result from (d).
Considering that in our research, there were 12
raw wheat plant images available in the original
dataset, which is fairly small, we then devised a strat-
egy with an intention of boosting the dataset size. It
splits each raw image of 930*1130 size into several
sub–images with the size of 930*150, and this re-
sulted in forty two sub–images. The sub–images were
divided into training and test subsets for generating
and testing regression models.
In addition, as a result of the use of univariate lin-
ear regression, the predictor variable was suggested
to be based on a pixel-density (denoted as X), which
represents the number of white pixels in the binary
sub-image. So for a given wheat image we had X
i
pixel-density, where i = 1,...,n = 8. This data was
stored using a CSV file with two variables: the first
being the target, which was the true number of wheat
ears counted manually by human expert, and the sec-
ond variable was the wheat ears pixel-density. Fig.8
shows examples of pixel-density values on some sub-
images sampled from a given wheat image.
3.4.2 Regression Analysis for Ears Counting
Linear Regression (LR) with the least–square error
function is chosen as a method in the final stage of
proposed framework to estimate the number of wheat
ears from a segmented and clustered wheat plant im-
age.
Fig.9 depicts the regression relationship between
the predictor variable – pixel-density x and the target
Figure 8: Eight sub-images obtained from a given wheat
image, with their corresponding pixel-density.
Figure 9: Least square regression results.
variable y – the number of wheat ears.
The results shows that the predictor variable x is
marginally statistically significant with the response
variable, y. We found that the resultant model pro-
vided a satisfactory results in terms of the error ra-
tio between the measured real value and the estimated
one in the majority of the tested images in the dataset.
Figures 10 and 11 present some samples of the fi-
nal outputs of the developed method for two images
taken from a wheat field at different times (16th of
June and 3rd of August). The ground truth of the
number of wheat ears on these two images were es-
timated/counted by human experts manually as 180
and 156 respectively. As can be seen, the proposed
method produced the counts of 151 and 150 respec-
tively, which are quite close to “the ground truths”.
The further tests and evaluation are given in the next
section in detail.
4 RESULTS AND EVALUATION
This section presents and evaluates the testing results
of the proposed counting system.
As although the linear regression (LR) method is
employed, the task is a counting problem, so the usual
metric for regression analysis, such as Mean Square
Error (MSE), could be used, but not directly meaning-
ful to represent how close a counting is to its target.
So, firstly, for comparison, we used the same metric
defined by Zhao et al. (2015) to evaluate the counting
ICPRAM 2018 - 7th International Conference on Pattern Recognition Applications and Methods
352
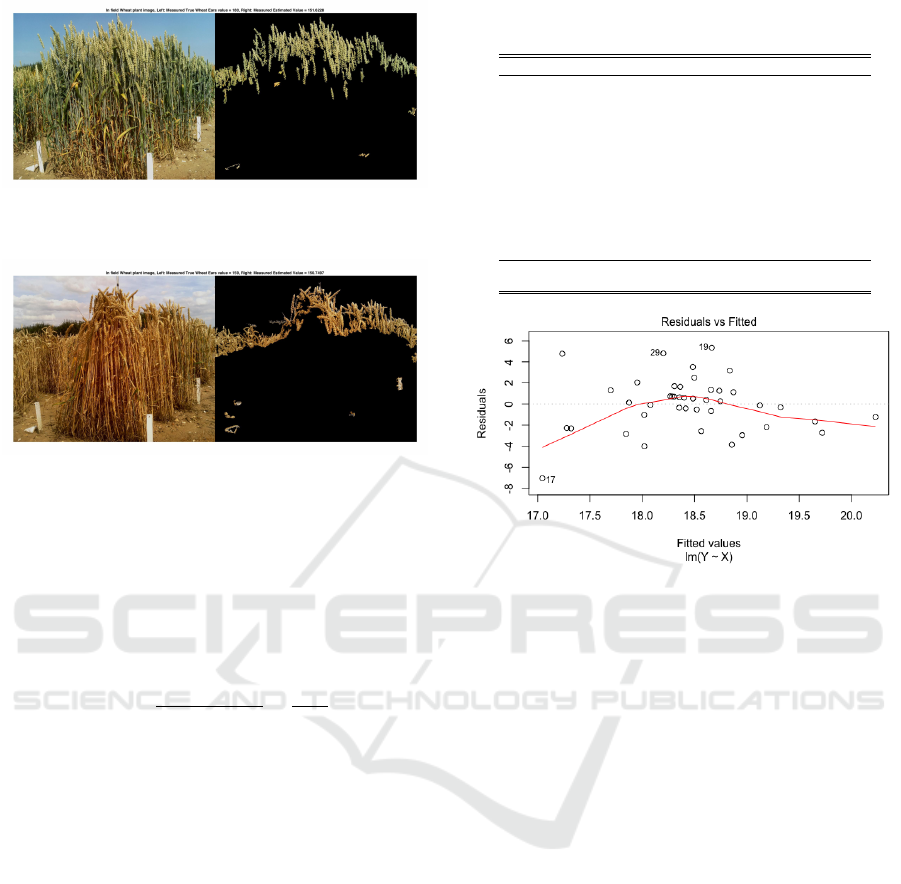
Figure 10: A sample output for the proposed method for
counting the wheat ears on a mid–mature growth level(16
June 2015).
Figure 11: The counting result of the proposed method from
an image of wheat plants at the highly growth level(3rd Au-
gust 2015).
performance of our method, but we found that accu-
racy measure defined for counting maize ear grains
was inappropriate. We then adapted it as a relative
counting error E. For an image i, the relative count-
ing error measured by:
E(i) =
|y
p
(i) − y
t
(i)|
y
t
(i)
=
δ(i)
y
t
(i)
, (5)
where, y
t
is the target value of y – the true value of
wheat ear number on image i; y
p
, the predicted value;
and the absolute error δ = |y
p
− y
t
|.
The accuracy of the prediction can be easily de-
rived by Acc(i) = 1 − E(i). So specifically, Acc under
different situations can be calculated by:
Acc(i) =
(
y
p
(i)/y
t
(i) if y
p
<= y
t
2 − y
p
(i)/y
t
(i) if y
p
> y
t
(6)
With this definition, the accuracy Acc should nor-
mally be meaningfully represented between 0 and
100%, and can be interpreted easily.
But if a predicted value is too far away from its
target value, i.e. when y
p
> 2y
t
, then the Acc could be
negative, which means that the prediction is too bad
with the relative error E is greater than 1.
The test results on the 12 images are given in Ta-
ble 1. As can be seen, the proposed system reached
an average accuracy of 90.74% with a standard devia-
tion(S.D.) of 0.055. These results were considered to
be satisfactory and acceptable in practice.
Table 1: The testing results of the wheat ears counting sys-
tem on 12 wheat plants images.
ID True numbers Predicted numbers Accuracy% Error
01 149 146 97.9 0.020
02 180 145 80.5 0.194
03 180 148 82.2 0.177
04 134 144 92.5 0.074
05 163 147 90.1 0.098
06 165 147 89.0 0.109
07 159 149 93.7 0.062
08 159 146 91.8 0.081
09 165 145 87.8 0.121
10 150 147 98.0 0.020
11 141 147 95.7 0.042
12 137 151 89.7 0.102
Mean 90.74 0.0917
S.D. 0.055 0.0549
Figure 12: Residuals verse fitted values test.
The error residuals of the predictions are analysed
and shown in Figure 12.
These residuals show how the fitted regression
function behaved as the independent variable density
x changes. The negative residuals indicate the fit-
ted regression function under–predicts the true val-
ues, which happened when x is low and high on aver-
age, whilst the positive residuals mean that the model
over–predicts the true values. In the middle section,
the regression function performed reasonably well as
the residuals are small and close to the zero mean.
Thus, these analyses of the results indicate that the re-
lationship between the density x and the target value
y is non-linear, rather than linear as obtained earlier,
which we suggest as one of further studies.
Apart from evaluating the accuracy, we also
recorded and analysed the the efficiency, i.e. execu-
tion time, of the proposed algorithm. Generally, for
an image size of 930*1130 pixels, our system, run-
ning on a common laptop with a fairly average speci-
fication (MacBook Pro Mid2012, Processor 2.3 GHz
Intel Corei7, Memory 8GB 1600 MHz DDR3, Graph-
ics 4000 1536 MB) took about two and half minutes
on average to produce the final counting result, which
is not very fast obviously. But compared with human
experts, it is many ten times more faster.
The time complexity was broken down into three
main computing tasks of the system, i.e. feature ex-
Automatic Counting of Wheat Spikes from Wheat Growth Images
353

traction, feature selection and clustering, and regres-
sion for counting. Table 2 lists the average execu-
tion time for these three key stages in our system.
These times can be certainly improved through ap-
plying some optimisation methods and more powerful
computing facilities, which is another task of possible
further studies.
Table 2: The average break-down execution times of the
proposed system.
Stage mean running time
Feature Extraction 132.419 seconds
Feature selection and Clustering 13.997 seconds
Counting model 1.888 seconds
If our method is implemented on a more power-
ful computer, or high performance computing cluster,
we expect that the running time could be shortened
significantly to seconds or even milliseconds.
We attempted to compare our method with other
methods but we did not find/obtain any program of
the existing methods such as reviewed in the related
work section, even though after sending our requests
directly to some authors, nor any dataset that was used
by other studies. Moreover, we did not have sufficient
details to implement these methods. So, as a conse-
quence, we could not carry out any direct comparison
on the results with other methods, unfortunately.
On the other hand, some indirect comparisons
with some other studies and results given by such as
Germain et al. (1995); Cointault and Gouton (2007);
Cointault et al. (2008, 2012), were conducted, partic-
ularly from data perspective. We found that the im-
ages they used are in the early ripening stages, which
meant that the level of object overlaps or occlusion
was not severe. In addition, in some object count-
ing studies, a cover was added through building the
acquisition system to ignore the natural in-field light
wholly or partially, as well as the resultant shadow.
As a result of doing this, their findings were deemed
to be acceptable to some extent, but still not practical
enough to be applied in real applications.
In this study we succeeded in carrying out an im-
mediate image analysis with a final output of esti-
mated wheat ear numbers, even though the images
used were in a mature-to-high growth level, which
means some severe overlaps among wheat plants and
ears.
5 CONCLUSION AND FURTHER
WORK
In this study, an automatic system has been developed
based on image processing techniques and machine-
learning algorithms for counting wheat spikes(ears)
on wheat plant images. It consists three main func-
tions: pre–processing raw images, then segmenting
the area of wheat ears from other regions on a given
image, and finally estimating the number of wheat
ears through clustering and regression. The system
was tested on the wheat plant images taken from
wheat fields. The results show that the system is able
to achieve an average accuracy of 90.7% with a stan-
dard deviation of 0.055. The time efficiency of the
system was evaluated and on average, when running
on a common MacBook laptop, it took approximately
2 and half minutes to produce the final counting result
from a single raw image. This is not very fast, how-
ever, it is much faster than human experts doing the
counting in-field.
Further work should include considering some
non-linear methods at the final stage of the system,
such as Bayesian regression, neural network or sup-
port vector machines, in order to produce more accu-
rate counting results. As for segmentation, other fea-
ture extraction methods related to texture recognition
such as the Grey Level Run Length Matrix (GLRL),
should be explored to detect both coarseness and fine
textures. Such optimisation methods should be ap-
plied to reduce the time and space of computation.
Finally, this work can be developed with a machine-
vision system, that could allow farmers to estimate the
yields of their wheat fields in real time and location,
by adding a function that convert the number of ears
into an estimation of grain numbers and weights.
ACKNOWLEDGEMENTS
Thanks due to Earlham Institute for providing the
dataset for this research and also to Taibah University
for providing a studentship for Ms. Najmah Alharbi
to study the MSc of Data Mining and Knowledge Dis-
covery at the School of Computing Sciences, Univer-
sity of East Anglia.
REFERENCES
Alexandratos, N. and Bruinsma, J. (2012). World agricul-
ture towards 2030/2050: the 2012 revision. Land Use
Policy, 20(4):375–.
Aradhya, V. and Pavithra, M. (2016). A comprehensive of
transform, gabor filter and k-means clustering for text
detection in images and video. 12:109–116.
Bairwa, N., Agrawal, N., and Gupta, S. (2014). Devel-
opment of counting algorithm for overlapped agricul-
tural products. International Journal of Computer Ap-
plication, RAWCAI:16–19.
ICPRAM 2018 - 7th International Conference on Pattern Recognition Applications and Methods
354

Cobb, J. N., DeClerck, G., Greenberg, A., Clark, R., and
McCouch, S. (2013). Next-generation phenotyping:
requirements and strategies for enhancing our under-
standing of genotype–phenotype relationships and its
relevance to crop improvement. Theoretical and Ap-
plied Genetics, 126(4):867–887.
Cointault, F. and Gouton, P. (2007). Texture or colour anal-
ysis in agronomic images for wheat ear counting. In
Proceedings of the 3th international IEEE conference
on Signal-image technologies and internet based sys-
tem.
Cointault, F., Guerin, D., Guillemin, J.-P., and Chopinet, B.
(2008). In-field triticum aestivum ear counting using
colour-textue image analysis. New Zealand Journal of
Crop and Horticltural Science, 1.
Cointault, F., Ludovic, J., Gilles, R., Christian, G., David,
O., Marie-France, D., Nathalie, G., Gillbert, G.,
Olivier, L., and Ambroise, M. (2012). Texture, colour
and frequential proxy-detection image processing for
crop characterization in a context of precision agricul-
ture. Science technology and medicine open access
publisher., 158:213–313.
Geipel, J., Link, J., and Claupein, W. (2014). Combined
spectral and spatial modeling of corn yield based on
aerial images and crop surface models acquired with
an unmanned aircraft system. 6:10335–10355.
Germain, C., Rousseaud, R., and Grenier, G. (1995). Non-
destructive counting of wheat ear with picture analy-
sis. In Image processing and its applications. Pro-
ceeding of the 5th international conference on:.
Guerin, D., Cointault, F., Gee, F., and Guillemin, J.-P.
(2004). Feasibility study of a wheatears counting vi-
sion system. (Accessed: 11th July 2016.
Guijarro, M., Pajares, G., Riomoros, I., Herrera, P., Burgos-
Artizzu, X., and Ribeiro, A. (2011). Automatic seg-
mentation of relevant textures in agricultural images.
Computers and Electronics in Agricultural, 75:75–83.
Jain, A. and Farrokhnia, F. (1991). Unsupervised texture
segmentation using gabor filters. 24(12):1167–1186.
Jolliffe, I. (2002). Principle Component Analysis. Springer-
Verlay Inc., 2 edition.
Kalapala, M. (2014). Estimation of tree count from
satallite imagery through mathematical morphology.
4(1):490–495.
Kataoka, T., Kaneko, T., Okamoto, H., and Hata, S.-I.
(2003). Crop growth estimation system using machine
vision. In Proceedings of IEEE/ASME international
conference on advanced intelligent mechatronics.
Lempitsky, V. and Zisserman, A. (2010). Learning to count
objects in images. In Proceedings of 24th Conference
on Advances in Neural Information Processing Sys-
tems, pages 1324–1332.
Liu, T., Wu, W., Chen, W., Sun, C., Zhu, X., and Guo,
W. (2015). Automated image-processing for count-
ing seedlings in a wheat field. Precision Agriculture,
17(4):392–406.
Lobell, D. B. (2013). The use of satellite data for crop
yield gap analysis. Field Crops Research, 143(Supple-
ment C):56 – 64. Crop Yield Gap Analysis Rationale,
Methods and Applications.
Montalvo, M., Guijarro, M., and Guerrero, J. (2016). Tex-
ture or colour analysis in agronomic images for wheat
ear counting. In Proceedings of the 11th international
IEEE conference on Signal-image technologies and
internet based system.
Pask, A., Pietragalla, J., Mullan, D., and Reynolds, M., edi-
tors (2012). Physiological Breeding II: A Field Guide
to Wheat Phenotyping. CIMMYT.
Pinto, R. S., Reynolds, M. P., Mathews, K. L., McIntyre,
C. L., Olivares-Villegas, J.-J., and Chapman, S. C.
(2010). Heat and drought adaptive qtl in a wheat pop-
ulation designed to minimize confounding agronomic
effects. In Theoretical and Applied Genetics, pages
1001 – 1021.
Rangole, J. and Pandit, A. (2014). Literature review on ob-
ject counting using image processing techniques. In-
ternational Journal of Advanced Research in Electri-
cal, 3(4):8509–8512.
Segui, S., Pujol, O., and Vitria, J. (2015). Learning to count
with deep objects features. In Proceeding of Computer
Vision and Pattern Recognition Workshops IEEE Con-
ference on:7-12 June.
Sonka, M., Hlavac, V., and Boyle, R. (2015). Image pro-
cessing, analysis, and machine vision. Timothy L.
Anderson, USA.
Velastin, S., Yin, J., Davies, A., and Vicencio-Silva, M.
(1994). Automatic measurement of crowd density
and motion using image processing. In Proceeding of
the Seventh international conference on:Road Traffic
Monitoring and Control.
Zhao, M., J. Qin, S. L., Liu, Z., Cao, J., Yao, X., Ye, S.,
and Li, L. (2015). An automatic counting method of
maize ear grain based on image processing. Springer
International Publishing, 452:521–533.
Zhou, J., Reynolds, D., Websdale, D., Le Cornu, T.,
Gonzalez-Navarro, O., Lister, C., Orford, S., Lay-
cock, S., Finlayson, G., Stitt, T., Clark, M. D., Bevan,
M. W., and Griffiths, S. (2017). Cropquant: An au-
tomated and scalable field phenotyping platform for
crop monitoring and trait measurements to facilitate
breeding and digital agriculture. bioRxiv.
Zhu, Y., Cao, Z., Lu, H., Li, Y., and Xiao, Y. (2016). In-field
automatic observation of wheat heading stage using
computer vision. Biosystem Engineering, 143:28–41.
Automatic Counting of Wheat Spikes from Wheat Growth Images
355
