
A Computational Pipeline for Sepsis Patients’ Stratification
and Diagnosis
David Campos
1
, Renato Pinho
1
, Ute Neugebauer
2,3
, Juergen Popp
3
and Jos
´
e Lu
´
ıs Oliveira
4
1
BMD Software, Aveiro, Portugal
2
Center for Sepsis Control and Care, Jena University Hospital, Germany
3
Leibniz Institute of Photonic Technology, Jena, Germany
4
University of Aveiro, DETI/IEETA, Portugal
Keywords:
Sepsis, Septic Shock, Early Diagnosis, Blood Testing, Data Analysis.
Abstract:
Sepsis is still a little acknowledged public health issue, despite its increasing incidence and the growing mor-
tality rate. In addition, a clear diagnosis can be lengthy and complicated, due to highly variable symptoms
and non-specific criteria, causing the disease to be diagnosed and treated too late. This paper presents the
HemoSpec platform, a decision support system which, by collecting and automatically processing data from
several acquisition devices, can help in the early diagnosis of sepsis.
1 INTRODUCTION
Infectious diseases and sepsis are a problem world-
wide whereby the immune system overreacts and
turns against itself. Sepsis is a poorly acknowledged
public health priority with increasing incidence, high
mortality and a high health-economic burden (Gaieski
et al., 2013; Fleischmann et al., 2016). Sepsis
emerges as a major complication of an infection ac-
quired either among patients hospitalized in an In-
tensive Care Unit or among patients admitted to the
emergency department (Walkey and Wiener, 2014).
The mortality of sepsis ranges from 7% in less severe
cases to almost 50% in cases of septic shock (Whit-
taker et al., 2015). The cornerstone of efficient treat-
ment is early recognition and beginning appropriate
therapy. However, in many cases clinical signs are not
conclusive and diagnosis is difficult. Even nowadays,
a clear diagnosis of sepsis is hindered by highly vari-
able symptoms and non-specific criteria (Singer et al.,
2016; Neugebauer et al., 2014). Hence, sepsis is often
diagnosed and treated too late. However, early diag-
nosis is necessary for optimal selection of treatment
for the highly heterogeneous group of sepsis patients.
In the HemoSpec project
1
, a multidisciplinary
team develops an innovative technological platform
for early, fast and reliable medical diagnosis of in-
fectious diseases using only minimal amounts of pa-
tients’ blood. HemoSpec combines in one device
three key enabling technologies: automated microflu-
1
http://www.hemospec.eu
idic sample handling with integrated holographic
blood count (Schr
¨
oder et al., 2017), simultaneous
multiplex fluorescence biomarker sensing and de-
tailed Raman spectroscopic leukocyte characteriza-
tion (Neugebauer et al., 2016). In this project, the
HemoSpec platform (HSP) has the overall objective
of integrating data generated in the various distinct
modules. This integrated multiplex analysis plat-
form is being validated in two clinics specialized in
hospital-acquired and community-acquired sepsis, re-
spectively. Ultimately, we expect that the HSP results
can help to administer the right therapy to the right
patient at the right time, reducing costs in the health
care sector.
2 SYSTEM REQUIREMENTS
The HSP architecture and its development was guided
by a set of general requirements, in terms of con-
nectivity, security, storage and user interaction (Silva
et al., 2017). Some of those can be highlighted,
namely:
• connect the different physical devices;
• exchange data following a single protocol and
data format;
• secure data communication, avoiding access by
third parties;
• managing and logging the different physical de-
vices’ activities and functionality;
408
Campos, D., Pinho, R., Neugebauer, U., Popp, J. and Oliveira, J.
A Computational Pipeline for Sepsis Patients’ Stratification and Diagnosis.
DOI: 10.5220/0006579104080413
In Proceedings of the 11th International Joint Conference on Biomedical Engineering Systems and Technologies (BIOSTEC 2018) - Volume 5: HEALTHINF, pages 408-413
ISBN: 978-989-758-281-3
Copyright © 2018 by SCITEPRESS – Science and Technology Publications, Lda. All rights reserved
Patient
Physical
examination
1
Physician
Technician
HemoSpec Device
Software
controller
HemoSpec
server
Physical modules
Microfluidic
separation
Holographic
module
Raman
module
Fluorescence
spectroscopy
Add blood
sample
4
Assign study
3
Start analysis
5
Create study
2
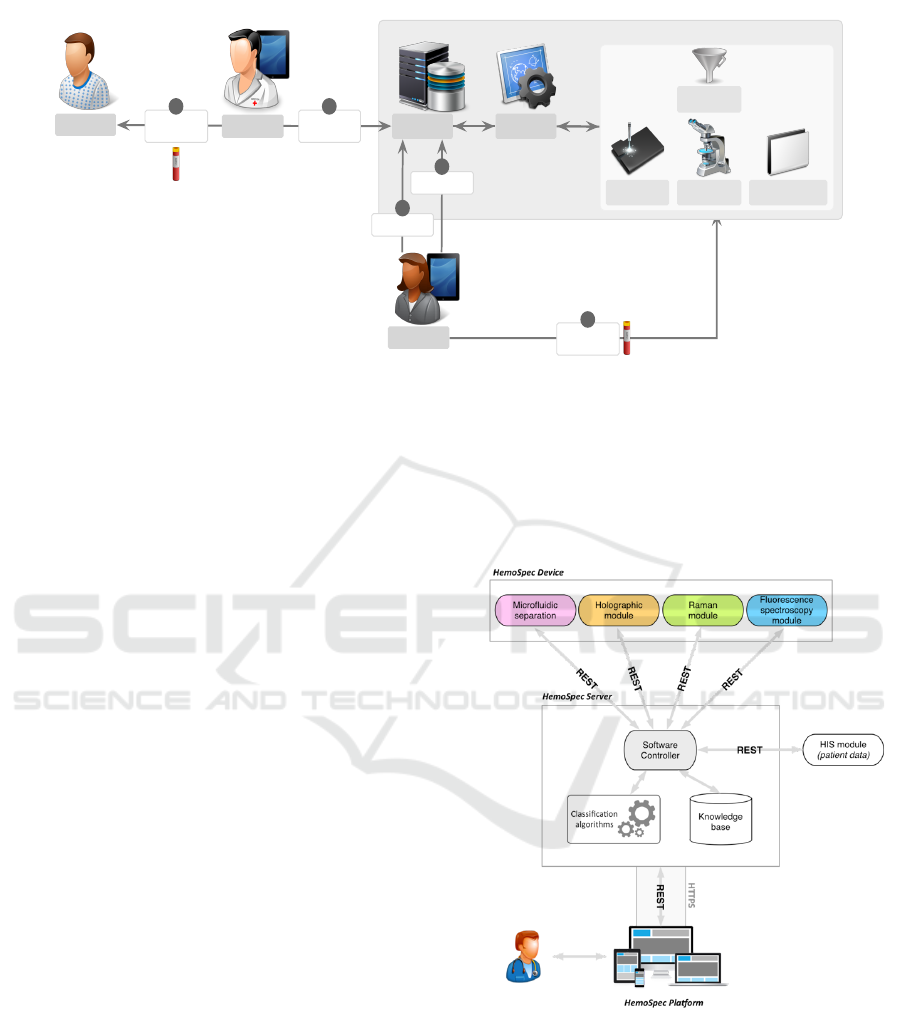
Figure 1: HemoSpec sepsis diagnosis interaction workflow.
• store the generated data in a structured resource,
enabling processing by computers and easy under-
standing by humans;
• support physicians decisions regarding sepsis di-
agnosis;
• clear and simplified interaction workflow between
the various actors;
• access to information from any device at any time.
Figure 1 illustrates the diagnosis workflow that we
addressed in the requirements phase. In this diagram,
the HSP is composed of the HemoSpec server and
the Software controller modules.
During the patient examination (1), and in case
of suspected severe infection, the physician starts the
process by requesting a new study in the HSP (2).
This will trigger a notification to HSP technician(s)
who will be responsible for leading the study (3), col-
lecting and adding the blood sample to the physical
models (4) and starting the analysis (5). Through
the HSP user interface, the technician has full control
of the process, accessing detailed preliminary results
and statuses, also being able to stop or restart the pro-
cess if desired. After processing the blood sample,
the device makes the results immediately available to
all the actors involved in the patients treatment. When
the technician validates the results, the HemoSpec de-
vice performs a background data-mining process to
automatically organize the collected data and infer a
knowledge-based decision, which will help the physi-
cian in the final decision. Finally, physicians can get
the results, in real time, ensuring an anticipated pa-
tient diagnosis and suitable treatment. This workflow
intends to reduce the procedure time, the risk of errors
in the process of exchanging data and guarantee that
the patient receives, on time, the proper treatment.
3 THE HSP ARCHITECTURE
The technological infrastructure of the HSP, which
enables the previous requirements, is composed of
two main blocks (Figure 2):
Figure 2: Technological infrastructure of HSP.
• Server: responsible for controlling the various
physical modules, storing the generated data, and
supporting sepsis diagnosis;
• Web Platform: the entry point for HemoSpec
users, enabling data visualization and interaction
with devices.
Overall, every physical module must be connected
to the HSP Server through the Software Controller,
A Computational Pipeline for Sepsis Patients’ Stratification and Diagnosis
409

which will be responsible for controlling all modules’
actions and for collecting the generated data. Such
data will be stored in the Knowledge Base, which will
keep all patients’ history together with the results ob-
tained from each module on each performed study.
Finally, the HSP allows all users to have access to all
the generated information, providing simplified inter-
faces to support data analysis and decision making,
together with the ability to control modules’ actions
and blood sample processing workflows.
To develop the infrastructure that fulfils all the re-
quirements of the HemoSpec project, we created three
logical components, some of which will be described
in the following sections:
• Communication: how to enable heterogeneous
communication between devices and the software
controller.
• Data integration: how to combine data from sev-
eral devices in a single knowledge base and sup-
port sepsis diagnosis.
• User interaction: how can users access patients
data and interact with the device.
3.1 Technical Framework
In the HSP architecture, the client-side is responsi-
ble for the direct interaction with users through their
web-browsers, and the server-side is responsible for
storing and processing all generated data. Both sides
exchange data through a secured and encrypted chan-
nel using authenticated and authorized services.
The client-side was developed targeting compat-
ibility and performance, through the application of
standard web technologies, i.e., HTML, CSS and
JavaScript, which are supported by most commonly
used web-browsers on both desktop and mobile de-
vices. The application of such web standard technolo-
gies also delivers information quickly. Thus, together
with simple and fast client-side algorithms, we enable
loading and presentation of information rapidly, pro-
viding smooth and sophisticated navigation and inter-
action with the system.
The server-side is responsible for storing all infor-
mation in a unique resource, as well as providing the
services to interact with that same data. All users,
patients, devices and configurations are stored in a
MySQL
2
relational database. Every processing task
is available as a REST web-service (Lin, 2007), en-
abling easy and fast integration in any development
platform, such as web, desktop and mobile. More-
over, those web-services are secured by requiring spe-
cific authentication and authorization per user. Ad-
2
https://www.mysql.com
ditionally, to guarantee complete protection of ex-
changed data, the communication between client and
server sides is performed through a secured and en-
crypted channel using HTTPS.
3.2 Data Model
The database was carefully designed targeting high
flexibility, high performance and high scalability. It
contains a hierarchical and structured representation
of organizations that support multiple users, devices
and patients. Moreover, each patient may have multi-
ple studies with several measurements attached.
An organization contains multiple users who can
be administrators, physicians and technicians. Users
may be in more than one organization, enabling
project supervisors to constantly monitor and analyse
the work progress in each geographically distant in-
stitution. The organization has devices that can be
controlled by the users within the same organization.
This modular structure enables each institution to ac-
quire new devices at any given time, while granting
access and control by the organization’s users at all
times. Lastly, each organization has specific infor-
mation stored about all its patients, which allows the
overview and control of every patient diagnosis and
their study progress.
3.3 Disease Prediction
Our goal is to provide a rapid solution for sepsis clas-
sification, namely:
• Sepsis: predict if the patient has sepsis or not;
• Sepsis categorization: predict the patient’s type of
sepsis;
• Survival: predict if the patient will survive after a
specific number of days;
• Organ failure: predict if the patient will have any
type of organ failure;
• infection: predict if the patient has an infection or
not; if patient has an infection, predict the type of
infection.
To develop the decision algorithms inside the HSP,
we incorporated the following machine learning (ML)
techniques, which provide a wide coverage of the su-
pervised techniques available: Naive Bayes; Random
Forests; Support Vector Machines (SVMs); Logistic
Regression; Hidden Markov Models (HMMs); and
Neural Networks (NNs).
Using several training datasets and these ML al-
gorithms, we developed an advanced data analysis
framework to automatize:
HEALTHINF 2018 - 11th International Conference on Health Informatics
410

• Feature selection and replacing;
• Cross-validation;
• Hyper-parameters optimization per ML model;
• Collecting the best results considering the stratifi-
cation criteria.
Incorporation of the classification models into the
HSP allows predicting the type of sepsis according to
the incoming parameters from the various devices and
in an incremental way, as new data comes in.
Besides the models already integrated in the HSP,
a specially developed component allows users to pro-
vide their own datasets to train and evaluate new ML
models. The following features are provided:
• Upload files in text format with input data, allow-
ing the specification of a field separator to support
CSV or TSV file formats; From the input data, the
target class field must be selected;
• Specify the training procedure, using cross vali-
dation or simple dataset split;
• Select the target ML model and its hyper-
parameters;
• Evaluate results;
• Store or download the model for further use.
3.4 User Interface
The HSP was designed to be simple and easy to use,
while keeping the information organized in such a
way that the user has direct access to the most impor-
tant data. For this purpose, the interface was divided
in three main areas: Patients, Devices and Manage-
ment. Management contains all administrative tools
that are used to configure the platform and organiza-
tions. The other two sections contain specific data
about patients and devices available in each organiza-
tion. Furthermore, if a user is associated with more
than one organization it is possible to switch between
workspaces, gaining access to all data. In the follow-
ing paragraphs, a more detailed description of each
section of the interface is presented and discussed.
Once a user successfully logs into the system, the
patient’s overview page is displayed (Figure 3).
This view provides a list of the institution’s pa-
tients with the ability to sort and search according to
different criteria, for example search by study date,
study status or patient details. On the left side of
this view, the available search filters are organized in
groups to make the search task simple. In the cen-
tral section, a table containing a list of patients that
meet the search criteria is displayed, containing rele-
vant information that helps to identify the patient as
well as the number of studies and the status of the lat-
est study requested for each patient. If no search cri-
teria are specified, the list of all patients is displayed.
A summary of important information helps to iden-
tify patients and studies that require a technicians at-
tention in cases where the study was requested or
a physicians attention when the studies have already
retrieved data for the physician to analyse. In this ex-
ample (Figure 3), each patient listed contains one as-
sociated study. While the study of the first listed pa-
tient is in a status where the technician must analyse
and validate the device results, the second requires the
physician to decide about the patient diagnosis.
Each personal page contains clinical information
about the patient, the operations available to the user,
and a list of the studies performed. The most recent
study is highlighted to enable faster access. Here,
the physician can request a new study for the patient.
When taking this action, the physician is prompted
to introduce some optional information about the pa-
tient, such as temperature or blood pressure. After
submitting these data, a study pipeline is initialized
and the study can be managed by the technician. Dur-
ing the study, a workflow page is available display-
ing the five steps of the pipeline (Start, Status, Valida-
tion, Classification, Decision), which allow tracking
the study progress. In the first stage, the view gives
the indication that the technician must undertake the
required procedures to prepare the device to process a
blood sample. If any error is detected by the platform,
a notification is shown and the Start study button is
disabled. Otherwise, as soon the device is ready, the
technician may proceed and start the study.
In the next step (Figure 4), it is possible to keep
track of the device processing, visualizing at any time
the operation status of each module. As each device
finishes processing and has results available, the HSP
downloads the data from the devices into its database
and makes it available through the web interface, so
that the technician can begin validating these values,
thus speeding up the reporting process. When every
module finishes processing, the study advances to the
next step where the technician must submit a report.
In this stage, the technician is responsible for
analysing the results from the device and verifying
that no errors have occurred during the blood sample
processing. When the process finishes without errors
the technician must then validate the data and submit
the report, which will be then accessible by the physi-
cian. Otherwise, if it lacks quality, a new study may
be requested cancelling the current study and starting
a new one.
At this point, the platform combines the data pro-
vided by the physician with the one returned by the
A Computational Pipeline for Sepsis Patients’ Stratification and Diagnosis
411
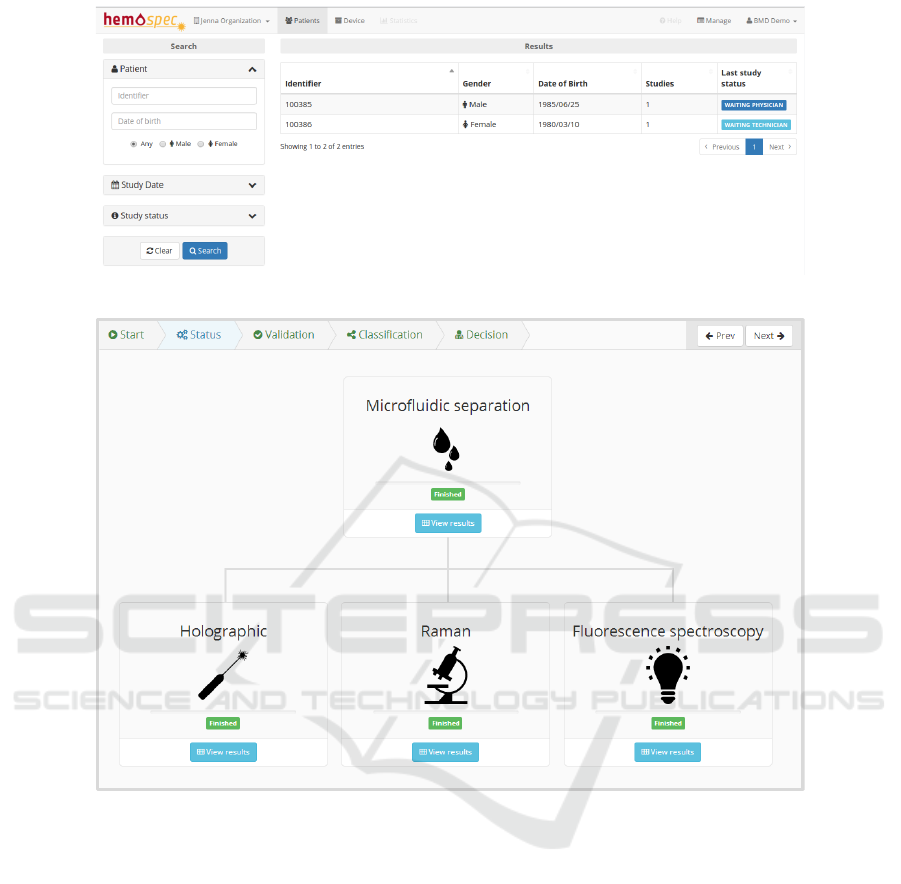
Figure 3: Patient page.
Figure 4: Device status and study overview.
device, to compute an automatic prediction of the di-
agnosis. This prediction is performed by one of the
trained models that were previously uploaded into the
platform. In this view (Figure 5), the physician has
access not only to the data generated by the platform,
but also to all data collected in the previous steps of
the study.
Finally, in the last step of the study process
pipeline, a view is displayed containing the diagnosis
provided by the platform and a field for the physician
to submit the final report of the current study. After
the physician’s decision and submission of this report,
the study is concluded.
4 CONCLUSION
We have presented a computational system (HSP)
able to collect and classify information provided by
different data acquisition equipment, which performs
distinct analysis and measurements from small blood
samples from sepsis patients. This system consists of:
1) a master-slave communication architecture based
on REST web-services, responsible for communica-
tion with the devices; 2) a data mining engine for
patients stratification with models trained previously
from clinical records, and 3) a web portal for device
management, patient follow-up and diagnoses. Be-
sides this platform, we have been building machine
learning models to incorporate in the HSP, using sev-
eral clinical datasets, so that they can be used for pa-
tients’ stratification in intensive care units.
HEALTHINF 2018 - 11th International Conference on Health Informatics
412
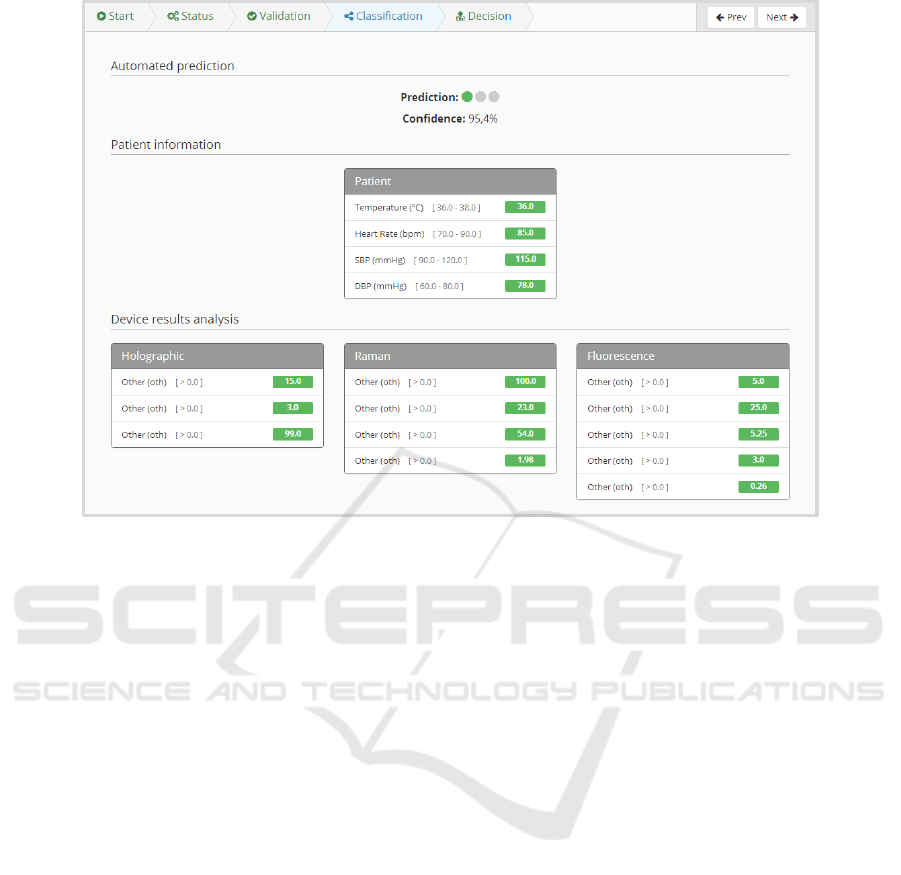
Figure 5: Summary of data retrieved by the platform and its diagnosis prediction (where data attributes were blinded).
5 ACKNOWLEDGEMENTS
This research is funded by the European Union’s FP7
Programme under the project HemoSpec, EC contract
number FP7-ICT-2013-CN-611682.
REFERENCES
Fleischmann, C., Scherag, A., Adhikari, N. K., Hartog,
C. S., Tsaganos, T., Schlattmann, P., Angus, D. C.,
and Reinhart, K. (2016). Assessment of global inci-
dence and mortality of hospital-treated sepsis. current
estimates and limitations. American journal of respi-
ratory and critical care medicine, 193(3):259–272.
Gaieski, D. F., Edwards, J. M., Kallan, M. J., and Carr,
B. G. (2013). Benchmarking the incidence and mor-
tality of severe sepsis in the united states. Critical care
medicine, 41(5):1167–1174.
Lin, K.-J. (2007). Building web 2.0. Computer, 40(5).
Neugebauer, S., Giamarellos-Bourboulis, E. J., Pelekanou,
A., Marioli, A., Baziaka, F., Tsangaris, I., Bauer, M.,
and Kiehntopf, M. (2016). Metabolite profiles in sep-
sis: developing prognostic tools based on the type of
infection. Critical care medicine, 44(9):1649–1662.
Neugebauer, U., Trenkmann, S., Bocklitz, T., Schmerler,
D., Kiehntopf, M., and Popp, J. (2014). Fast differen-
tiation of SIRS and sepsis from blood plasma of ICU
patients using Raman spectroscopy. Journal of bio-
photonics, 7(3-4):232–240.
Schr
¨
oder, U.-C., Kirchhoff, J., H
¨
ubner, U., Mayer, G.,
Glaser, U., Henkel, T., Pfister, W., Fritzsche, W.,
Popp, J., and Neugebauer, U. (2017). On-chip spec-
troscopic assessment of microbial susceptibility to an-
tibiotics within 3.5 hours. Journal of Biophotonics.
Silva, L. B., Jimenez, R. C., Blomberg, N., and Oliveira,
J. L. (2017). General guidelines for biomedical soft-
ware development. F1000Research, 6.
Singer, M., Deutschman, C. S., Seymour, C. W., Shankar-
Hari, M., Annane, D., Bauer, M., Bellomo, R.,
Bernard, G. R., Chiche, J.-D., Coopersmith, C. M.,
et al. (2016). The third international consensus defi-
nitions for sepsis and septic shock (sepsis-3). Jama,
315(8):801–810.
Walkey, A. J. and Wiener, R. S. (2014). Hospital case vol-
ume and outcomes among patients hospitalized with
severe sepsis. American journal of respiratory and
critical care medicine, 189(5):548–555.
Whittaker, S.-A., Fuchs, B. D., Gaieski, D. F., Christie,
J. D., Goyal, M., Meyer, N. J., Kean, C., Small, D. S.,
Bellamy, S. L., and Mikkelsen, M. E. (2015). Epi-
demiology and outcomes in patients with severe sep-
sis admitted to the hospital wards. Journal of critical
care, 30(1):78–84.
A Computational Pipeline for Sepsis Patients’ Stratification and Diagnosis
413
