
A Novel Computer Vision Methodology for Intelligent Molecular
Modeling and Simulation
Belal Medhat
1
and Ahmed Shawish
2,3
1
Department of Computer Science, The British University in Egypt, Cairo, Egypt
2
Faculty of Computer Studies, Arab Open University, Headquarters, Kuwait
3
Ain Shams University, Cairo, Egypt
Keywords:
Molecular Modeling and Simulation, Computer Vision, Molecular Graphics, Molecular Structures.
Abstract:
Molecular modeling and simulation tools are used to study the structure of the molecules for the purpose
of understanding and creating a new generation of technology that works on the nano-scale. The current
techniques mainly focus on visualizing the molecule’s structure using many illustrative methods, while they
leave the knowledge extraction load on the user that should be aware of many complex sciences. Developing a
new innovative method in this perspective becomes crucial to support such fast development in such vital field
of sciences. This paper represents a novel computer vision method for molecular modeling and simulation
that gives the computer the ability to see and understand the structure of molecules just like the human eyes,
and also the ability to analyze its structure without human intervention. The proposed approach is based on
using the computer’s memory as a digital representation of the real 3D-physical scaled model of the molecule,
and hence accommodates machine learning techniques for an automated analysis job. Moreover, a parallel
processing approach has been adopted to speed up the whole process. The realistic case study of a glucose
molecule reports the outstanding performance of the proposed approach to model and analyze its structure
without human intervention. The proposed methodology makes the developing of an automated molecular
expert system a one step away.
1 INTRODUCTION
Today the world turns its eyes on the technologies
and phenomena that happens at the Nanoscale, where
scientists are studying the cell and the cellular struc-
tures such as proteins, their structures, and their func-
tions (Friedrichs et al., 2009; Durrant and McCam-
mon, 2011; Soni et al., 2014). Scientists are learn-
ing lessons from nature. They are looking forward to
building molecular machines and robots using mod-
ified proteins and other nano
1
-materials to do things
that were impossible in the past. Molecular model-
ing and simulation tools can help scientists in study-
ing and modifying the structure of a molecule by
doing the following: visualizing the molecule us-
ing computer graphics, simulating the motion of the
molecule under different forces and conditions (Daw-
son et al., 2016; Khatib et al., 2011; Durn-Riveroll
et al., 2016; Jallu et al., 2012), simulating the interac-
tion between the molecule and other molecules (Lin-
1
1 Nano-meter = 1x10
−9
meter
dert et al., 2013; Friedrichs et al., 2009), analyzing the
arrangement and geometrical shapes of the atoms in-
side the molecule to find the critical points at which
the molecule’s structure will change.
The current molecular modeling and simulation
tools like Avogadro (Hanwell et al., 2012), VMD
(Humphrey et al., 1996), YASARA (Krieger and
Vriend, 2014), and RasMol tools (Potterton et al.,
2002) pay much attention on rendering the molecule
structure and leave the user to study the molecule by
himself. They left all the analysis, and knowledge
extraction effort to be done by the user who must
be an expert in molecular sciences, and theories to
take over these tasks. Frequently, the user is even
obligated to write a computer program to customize
these tools in order to do very simple jobs. This user-
dependent approach makes the current methods and
tools away of getting the full benefits from the com-
puter sciences’ methods and techniques like machine
learning, computer vision, and artificial intelligence.
Enhancing the current molecular modeling and simu-
lation tools to overcome their critical limitations be-
Medhat, B. and Shawish, A.
A Novel Computer Vision Methodology for Intelligent Molecular Modeling and Simulation.
DOI: 10.5220/0006576100970104
In Proceedings of the 11th International Joint Conference on Biomedical Engineering Systems and Technologies (BIOSTEC 2018) - Volume 3: BIOINFORMATICS, pages 97-104
ISBN: 978-989-758-280-6
Copyright © 2018 by SCITEPRESS – Science and Technology Publications, Lda. All rights reserved
97
come crucial to support the fast development in such
vital field of sciences. This will help the scientists to
design new molecules and nano-materials that can be
used in many applications.
This paper represents a novel computer vision
methodology for molecular modeling and simulation
which mimics the human eye’s vision and gives the
computer the ability to see and understand the molec-
ular structures. It will enable the user to see inner
parts of the molecule that may be hidden using the
current techniques. It also has the ability to analyze
the molecular structures and extract rich knowledge
from it without human intervention. Hence, develop-
ing molecular expert systems, chemical and physical
knowledge bases will become a one step away.
The proposed methodology’s approach is based on
using the computer’s memory(RAM) as a 3D-digital
representation media to model the physical molecu-
lar structure (i.e, atoms and bonds) using digits 0 and
1. Each bit represents a cube of 1 picomemeter
3
in the spatial space of the molecule. A parallel
processing approach has been adopted to efficiently
speed up the process of the whole method. This pa-
per reviews most of the current molecular software
tools like RasMol, PyMOL, VMD, Avogadro, GRO-
MACS, and Jmol to discuss all their pros and cons.
The extensive simulation studies conducted on a glu-
cose molecule report the outstanding capability of
the proposed method to extract knowledge from the
molecule structure and analyze it without human in-
tervention, contrarily to current human-dependent ap-
proaches.
The rest of the paper is organized as follows: Sec-
tion 2 provides a scientific background in molecu-
lar modeling and simulation. It also reviews related
work. Section 3 provides a detailed explanation of
the proposed methodology and the suggested paral-
lel architecture. Section 4 presents the conducted real
molecular case study and compare between the pro-
posed methodology versus the current methods. The
paper is then concluded in Section 5.
2 BACKGROUND
This section explains how the molecular structure is
discovered using X-ray. It then reviews the related
work in molecular modeling and simulation.
2.1 Scientific Background
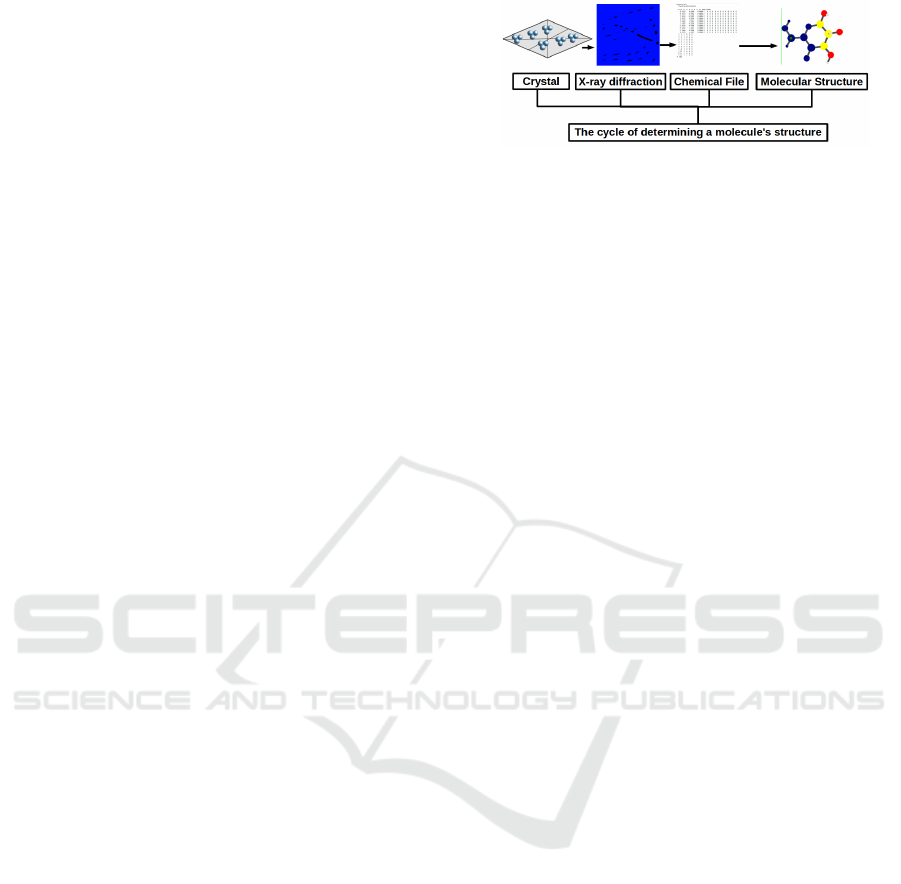
As illustrated in figure 1, there is a cycle of steps to
discover the structure of any molecule. The first step
in Figure 1: The cycle of discovering any molecules
Figure 1: The cycle of discovering any molecule’s structure.
structure to extract the target molecule from living or-
ganisms. Step two is to get a sufficient amount of such
molecule and convert it to a crystal form. Step three
is to expose such crystal into an x-ray crystallogra-
phy device. This device shoots extensive x-ray beams
from different angles through the crystal and collects
the diffraction of such rays on a light-sensitive sheet.
The collected light intensities are then analyzed by a
computer program to reveal the position of each atom
in the molecule and its chemical type. Here, it is
worth to mention that there are other techniques that
do the same job like NMR, Mass Spectrometry, and
3D Electron Microscopy, where NMR, for example,
use the magnetic field instead of the light diffraction.
Nevertheless, they all produce a file called MOL as
an abbreviation of the word molecule that reveals the
position of each atom in the molecule and its chemi-
cal type. Again, there are other types of files differ-
ent than the MOL like SDF, XYZ, and PDB chemical
files. The SDF and XYZ files reveal the same infor-
mation but in a different file structure, while PDB files
are used to describe proteins. Finally, once the MOL
file is created, any molecular viewer software takes
place to render the molecule is 3Dimensions on any
computers screen.
2.2 Related Work
In the early 90s, a real improvement in x-ray crystal-
lography and molecular imaging techniques has ap-
peared, since then researchers and scientists have tried
to build software tools to study different molecules’
structures. This software can be divided into two cat-
egories. The first category includes molecular view-
ers, molecular editors and molecular designers (Han-
well et al., 2012; Humphrey et al., 1996; Sayle and
Milner-White, 1995; Potterton et al., 2002) all of
these software tools can visualize molecules. the sec-
ond category includes molecular dynamics simula-
tion tools that visualize the chemical reactions of the
molecules(Humphrey et al., 1996; Emsley and De-
breczeni, 2012; Dreher et al., 2013; Phillips et al.,
2005). Now, let’s review a group of molecular soft-
ware with their pros and cons.
The Avogadro tool (Hanwell et al., 2012) visual-
izes the molecules to the user on a computer’s screen
BIOINFORMATICS 2018 - 9th International Conference on Bioinformatics Models, Methods and Algorithms
98

using 3D computer graphics. It also enables the user
to choose an atom as the origin and rotate around it us-
ing the mouse buttons and the keyboard buttons. Nev-
ertheless, the user should always memorize the place
and the colors of the atom as well as its chemical types
in order to easily navigate through the molecule with-
out losing focus.
The VMD tool (Humphrey et al., 1996) visual-
izes the molecules to the user with different types of
graphical representations. It can do a lot of energy
calculations. It works through a special scripting lan-
guage, that should be used to initiate any complex job.
learning a new programming language to customize
the molecular graphics software to execute complex
and even simple commands require a lot of time and
effort.
The YASARA tool (Krieger and Vriend, 2014)
renders molecules using 3D graphics with less num-
ber of polygons and in less time, so even smartphones
can render large molecules faster with no hanging or
lagging. The YASARA tool has the advantage of
working on molecules anywhere and on any type of
computers from workstations to smartphones. how-
ever, this tool pays much attention to rendering and
rotating the molecules within a tedious workspace
without enough attention to real analysis and knowl-
edge extraction.
(Emsley and Debreczeni, 2012) designs drugs
using molecular graphics tool that can render the
molecules with different complex presentations.
Again, it is the user job to understand these presen-
tations that may take a long time based on his knowl-
edge.
3 THE PROPOSED S COMPUTER
VISION METHODOLOGY
3.1 The Main Idea
This section provides a detailed explanation of how
the 3D-physical model of the molecule is represented
in the computers memory, and how the knowledge is
extracted. It also explains the adoption of the paral-
lel architecture to speed up the process of the whole
methodology. The main idea of the proposed method-
ology is to build a digital model of 0 and 1 into the
computers memory in the form of a 3D-array of bits
that identically simulate the real 3D-physical struc-
ture of the molecule. Then, a computer vision al-
gorithm is proposed to help the computer to scan,
and analyze the constructed 3D-digital model with-
out the human intervention. Finally, a parallel pro-
cessing architecture has been adopted to speed up the
data processing of the 3D-array. Note that the pro-
posed approach is not a molecular viewing or ren-
dering approach, its an analysis methodology which
makes the computer able to understand and analyze
the molecules without human interference through the
proposed computer vision and knowledge extraction
methodology to be illustrated in the next subsections.
3.2 The Construction of the 3D
Molecular Representation
Here, we explain how we build the 3D-digital model
in form of a 3D-array of bits (i.e., 0 and 1) that
identically simulate the real physical structure of the
molecule. First, the proposed methodology reads the
input file that describes the structure of the molecule
in terms of its atoms that are inter-connected with spe-
cific chemical bonds
2
. Note that the input file de-
scribes any given molecule by listing its atoms and
their spatial distribution in a 3D-dimension. The
current molecular modeling and simulation software
tools render this input file using OpenGL library and
use any traditional graphical tools to visualize its
structure. In our approach, the same process is done
but on a 3D-array of bits. As illustrated in figure
2, each atom in this molecule is created in the form
of a sphere of bits of 1, where each bit represent
1Pico − meter
3 3
, which is the basic measuring unit
used to represent an atom. The rest of the bits in the
3D-array will be of value 0 to represent the empty
space between the atoms. Note that even the size of
each atom based on its chemical type is identically
reflected inside the new representation.
The result of this process will produce an identi-
cal digital model of the original molecule in the com-
puter’s memory (RAM) as illustrated in Figure 3. The
size of this array can vary depending on the original
size of the molecule in Pico-meter unit.
A library has been developed to hold the unique
features of all the organic atoms
4
, which help the
computer to recognize each atom later using the pro-
posed computer vision algorithm. To sum up, we can
now claim that this 3D-presentation reflects all major
information about the molecule’s structure such as its
atoms spatial distribution, size, and the internal dis-
tance between atoms.
2
The creation of this file was explained in section 2, and
it is the same file used as input for any of the existing tools
3
1 Pico-meter = 1x10
−12
meter
4
The organic atoms are: Oxygen, Nitrogen, Hydro-
gen, Sulphur, Phosphorus, Calcium, Magnesium, Potas-
sium, Chlorine, Sodium.
A Novel Computer Vision Methodology for Intelligent Molecular Modeling and Simulation
99
Figure 2: The atom in nature and as presented in 3D-array.
Figure 3: Building the whole molecule inside the 3D-array
of bits.
3.3 The Proposed 3D Computer Vision
Algorithm
We should remember that the generated 3D-array in
the previous step is a collection of zeros and ones that
are still in need for interpretation to extract valuable
information that can be later transformed to knowl-
edge using machine learning techniques. The pro-
posed computer vision algorithm explained in this
subsection will take over this task. Here, the computer
vision methodology is composed of two phases, the
first phase is scanning the 3D-array, and the second
phase is extracting the knowledge from the scanned
data.
This algorithm takes either the whole molecule’s
3D-array as input or even a smaller part of it (i.e., a
sub 3D-array of bits) to understand and reveal all nec-
essary information about the examined area. It starts
from a specific atom in the molecule or even around it
within a given space. As illustrated in figure 4, the al-
gorithm starts by reading the given 3D-array of bits by
examining the 2D-array in XY plane and then move to
the next 2D-array in the Z-direction. It keeps record-
ing the countered spheres in a list that we call the
”Hit-List” and recognize each atom through its diam-
eter
5
. Note that the chemical bonds which exist be-
tween atoms are represented in a separate data struc-
ture which links each chemical bond with its end-
points atoms that are participating in the bond. This
process can be done starting from a specific origin
in a certain direction inside a volume with a given
depth. The scan works as a transformation and pro-
5
Scientific fact there are no two different organic atoms
with the same diameter
Figure 4: Two types of scan, type A scanning a cube around
an atom, and type B scanning everything in a cube which the
chosen atom lies in the center inside the cube being scanned.
jection from 3D to a 2D-presentation which produce a
stream of 2D-images of atoms inside the scanned vol-
ume space. The geometric arrangement of the atoms
inside the resultant 2D-images such as angles between
bonds’ axes and distances between atoms are stored
in the Hit-List. The scanning process reveals also the
geometric shapes formed by the atoms and the bond’s
axes. Note that the produced Hit-List will be the ba-
sic input for the next knowledge extraction phase. The
steps of the scanning algorithm are illustrated in Fig-
ure 5: Algorithm 1: Scanning the 3D-array.
Once the 3D-array is scanned, the computer will
be able to study the relationship between the atoms
using molecular geometry functions and extract the
following knowledge:
• The distances between the atoms.
• The bonds that exist between the atoms.
• The arrangements of the atoms.
• The electrical charges of each atom.
• The volume of the molecule.
• The volume of empty space inside the molecule.
• The distribution of the atoms’ density.
• The distribution of atoms’ weights.
• The geometric shapes that are formed by the
atoms and the bond between them.
• Empty volumes of space inside the molecule and
between its atoms.
• Recognition of the molecule’s surfaces and the
atoms that compose its surfaces in all directions.
• The dimension of the cuboid that encloses the
molecule.
As a matter of fact, the first three extracted points
can be mathematically computed from the MOL file
directly, however, they are still easily calculated from
the new presentation and should be reported as part of
the extracted knowledge. Nevertheless, the remaining
BIOINFORMATICS 2018 - 9th International Conference on Bioinformatics Models, Methods and Algorithms
100
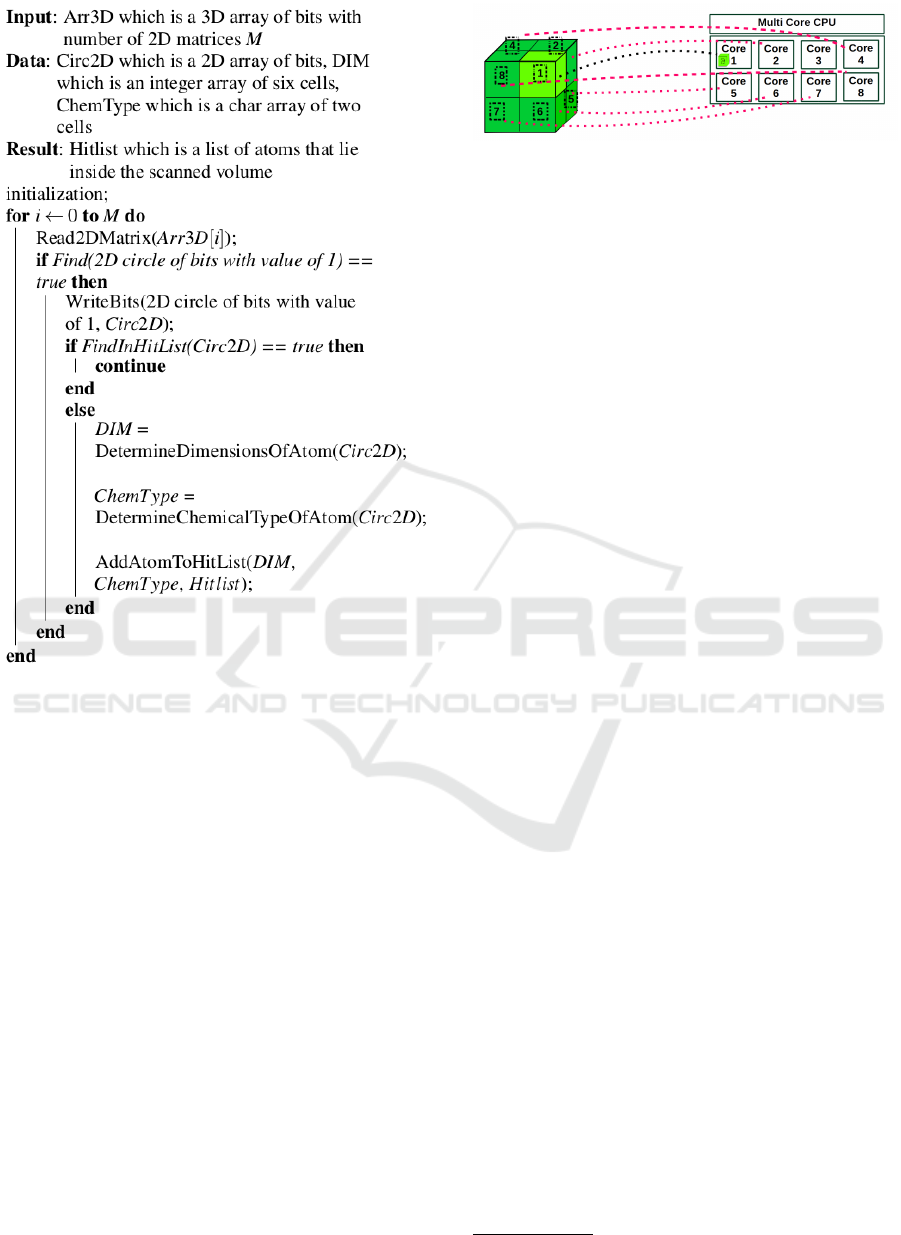
Figure 5: Algorithm 1: Scanning the 3D-array.
points cannot be extracted by any other method, like
computing the molecules outer surface and the geo-
metric shapes of the space between atoms. This is be-
cause of the interleaving between the atoms surfaces
inside the molecule. The proposed methodology uses
a 3D-graphics library to display the highlighted parts
of the molecule which are reflected in a comprehen-
sive report that reveals the extracted knowledge from
such structure. The proposed methodology main ob-
ject is not to simply render the molecule in a 3D as
same as the current tools, it is designed to analyze
the molecule and extract knowledge without any hu-
man intervention. It also enables us to use machine
learning techniques directly since the computer be-
comes now able to understand the internal structure of
the molecule. From the computational point of view,
we should highlight the processing time of the model
heavily depends on the size of the 3D-array. This is
why a parallel architecture has been adopted to over-
come this prospective limitation as explained in the
next subsection.
Figure 6: Distributing the sub cubes among the cores of a
CPU.
3.4 Parallel Processing
The 3D-array can be divided into sub 3d-arrays with-
out losing the spatial arrangements of atoms in the
molecule, and hence a strong potential for applying
the single instruction multiple data paradigm (SIMD)
on these sub 3d-arrays exists in order to accelerate the
scanning of the molecule’s representation by harness-
ing the underlying multi-core hardware. Note that the
time consumed by the CPU to build the 3D-digital
representation represents only 1% out of the total run-
time
6
, so the CPU can build and swap between the
cubes very fast.
The proposed algorithm uses the OpenMP C/C++
library for parallel processing of the molecule’s sub
3d-arrays. The proposed parallel implementation di-
vides the molecule’s cube into sub 3d-arrays and as-
signs each of them to one processing core or thread.
The previously mentioned scanning part is then im-
plemented on all the sub 3d-arrays simultaneously, as
illustrated in figure 6. After a careful study of both
scanning and knowledge extraction phases, we found
that a parallel processing architecture can be applied
in the scanning phase only while it is not suitable yet
for the knowledge extraction one due to the inter-
dependency between sub 3D-arrays at their bound-
aries. Therefore, all the information that has been col-
lected from the parallel scan are then collected cen-
trally in the Hit-List for the next knowledge extraction
phase.
4 EXPERIMENTAL CASE STUDY
AND COMPARISON
This section discusses the results of the extensive
simulation studies conducted on a realistic glucose
molecule using the proposed methodology.
4.1 Simulation Setting
The proposed methodology has been implemented
on a Linux operating system using C programming
6
This fact is deduced from a realistic experimental study
A Novel Computer Vision Methodology for Intelligent Molecular Modeling and Simulation
101
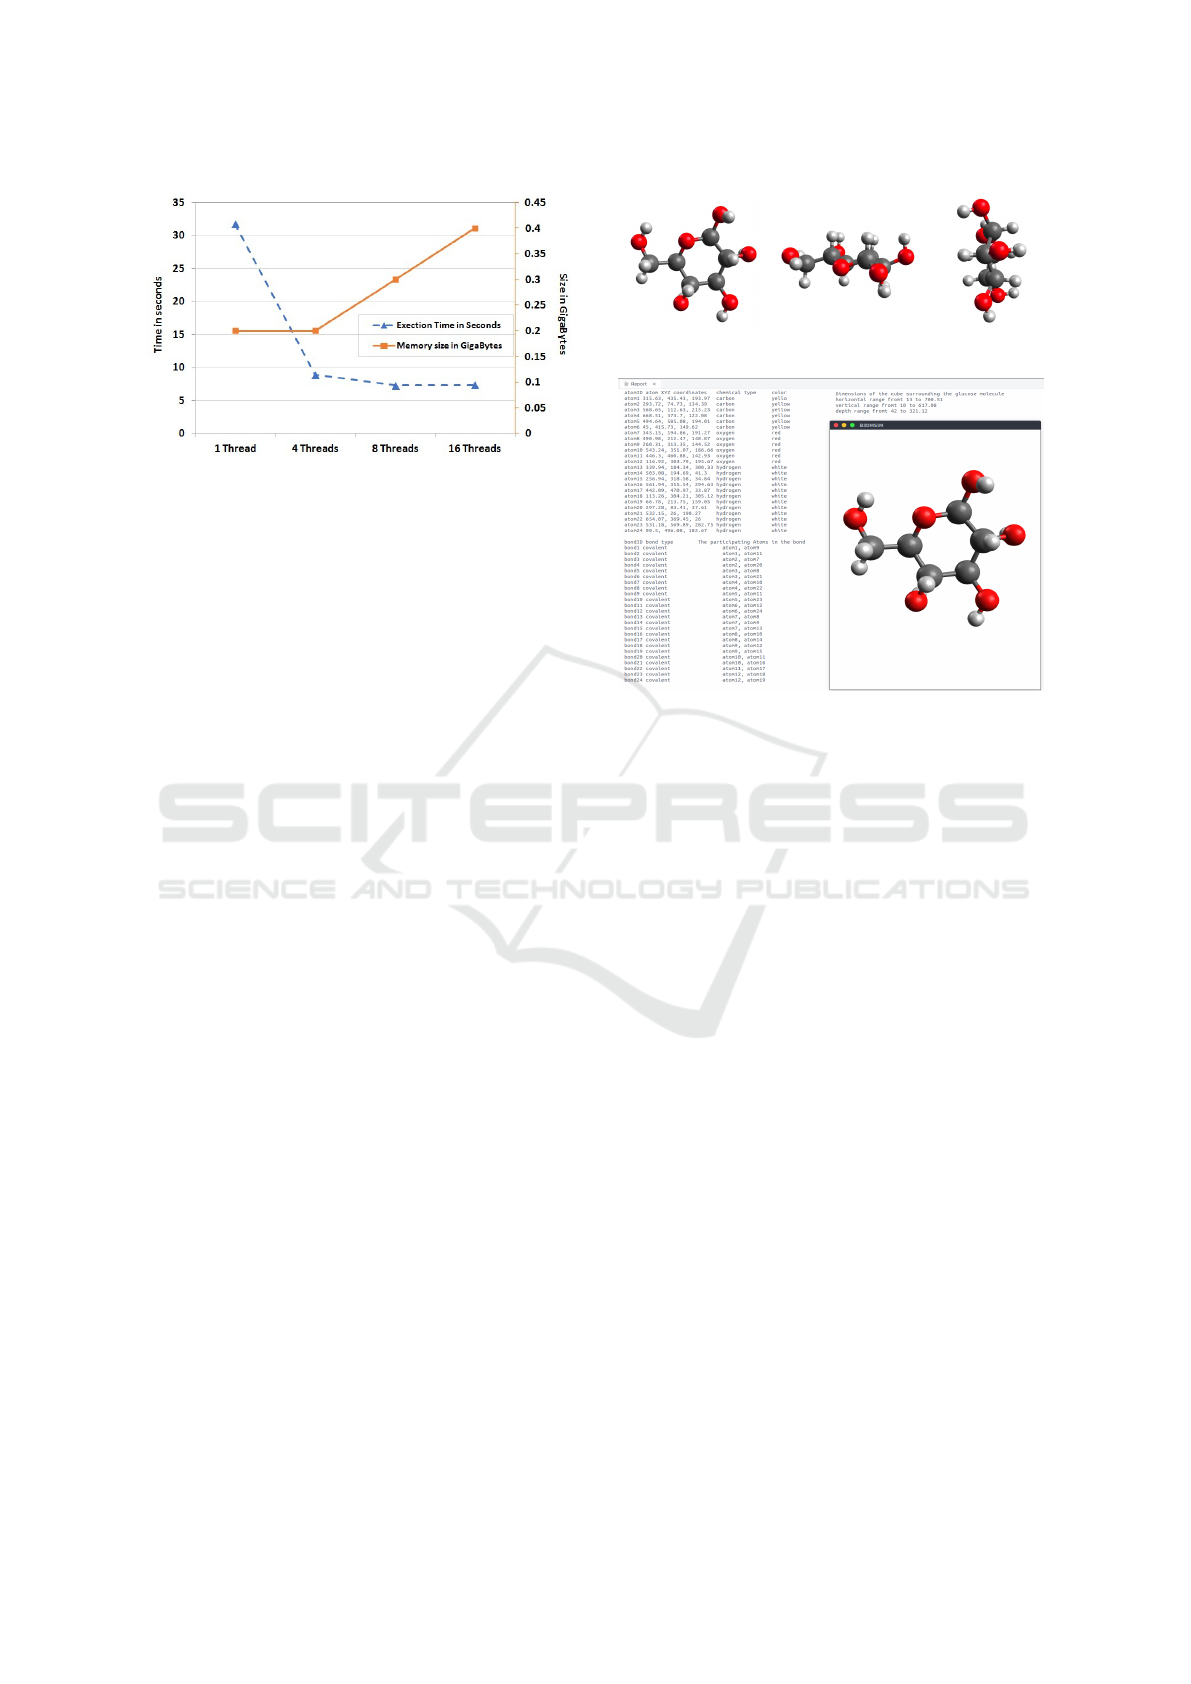
Figure 7: Performance and memory consumption measure-
ments per different number of threads.
language, OpenGL graphics library for checking the
results by rendering the molecules using 3D graph-
ics, and OpenMP for multi-core programming. The
studies were implemented on Intel Core i7-3612QM
with 6 mega cache CPU and 8 threads each thread
works at processing frequency range from 2.10GHz
to 3.10GHz and Intel Core i7-4790 with 8 mega cache
CPU and 8 threads each thread works at processing
frequency range from 3.60 GHz to 4.00 GHz.
The source code is divided into following four
main modules:
• The first module is responsible for reading the
chemical files.
• The second module is responsible for constructing
the 3D-array of bits in the memory and building
the molecule’s atoms inside it.
• The third module is responsible for executing the
parallel scan of the molecule’s sub 3D-arrays.
• The fourth module is responsible for extracting
the knowledge and visualizing the results to the
user on the screen using 3D graphics.
4.2 Case Study
Simulation studies have been conducted on different
3D-arrays sizes distributed among a different number
of cores to assess the parallelism effect of the pro-
posed methodology and to measure the gain of speed-
ing up the scanning phase. As illustrated in figure
7, in the case of using 1 thread (serial program) the
run-time took 32 seconds and the memory consumed
is 0.2 Gigabytes. In case of 4 threads (Parallel pro-
gram) the run-time decreases by 72% and the mem-
ory consumption remain the same, after increasing the
number of threads to 8 the run-time decreases by 18%
again and the memory consumed increased by 50%.
Finally, in case of 16 threads the run-time increases
up by 2% and the memory consumption increased by
Figure 8: The glucose molecule in XY, XZ, and YZ planes.
Figure 9: The resultant report of the proposed tool.
33.3%. It is worth to note that the more threads we
apply on the CPU, the more the run-time and memory
consumed increase because allocating memory for
threads, creating and destroying threads costs over-
head processing run-time and memory. Based on the
previous run-time degradation, we preferred to imple-
ment the following case study using 8 threads in order
to get the best performance with the least run-time.
Once the 3D-array is scanned and the Hit-list is
created, the proposed methodology displays the glu-
cose molecule in 3D with six carbon atoms colored
in dark grey, six oxygen atoms colored in red, and
twelve hydrogen atoms colored in light grey, as illus-
trated in figure 8. The figure displays only 3 shots
for the molecule from the XY, XZ, and YZ planes
for simplicity as a printed version. The proposed
methodology also displays a comprehensive report
that reveals the knowledge extracted from the glucose
molecule As illustrated in figure 9. The report covers
the extracted information previously mentioned be-
fore in section 3.3.
To show the capability of the proposed method-
ology, we conducted a more sophisticated experi-
ment by choosing a specific atom inside the glucose
molecule and study only the area behind it for the pur-
pose of going into a deeper level of understanding of
each atom in the molecule. The proposed method-
ology also displays a comprehensive report that re-
veals the knowledge extracted as illustrated in figure
10. The report covers the following additional infor-
mation inside the scanned space:
BIOINFORMATICS 2018 - 9th International Conference on Bioinformatics Models, Methods and Algorithms
102
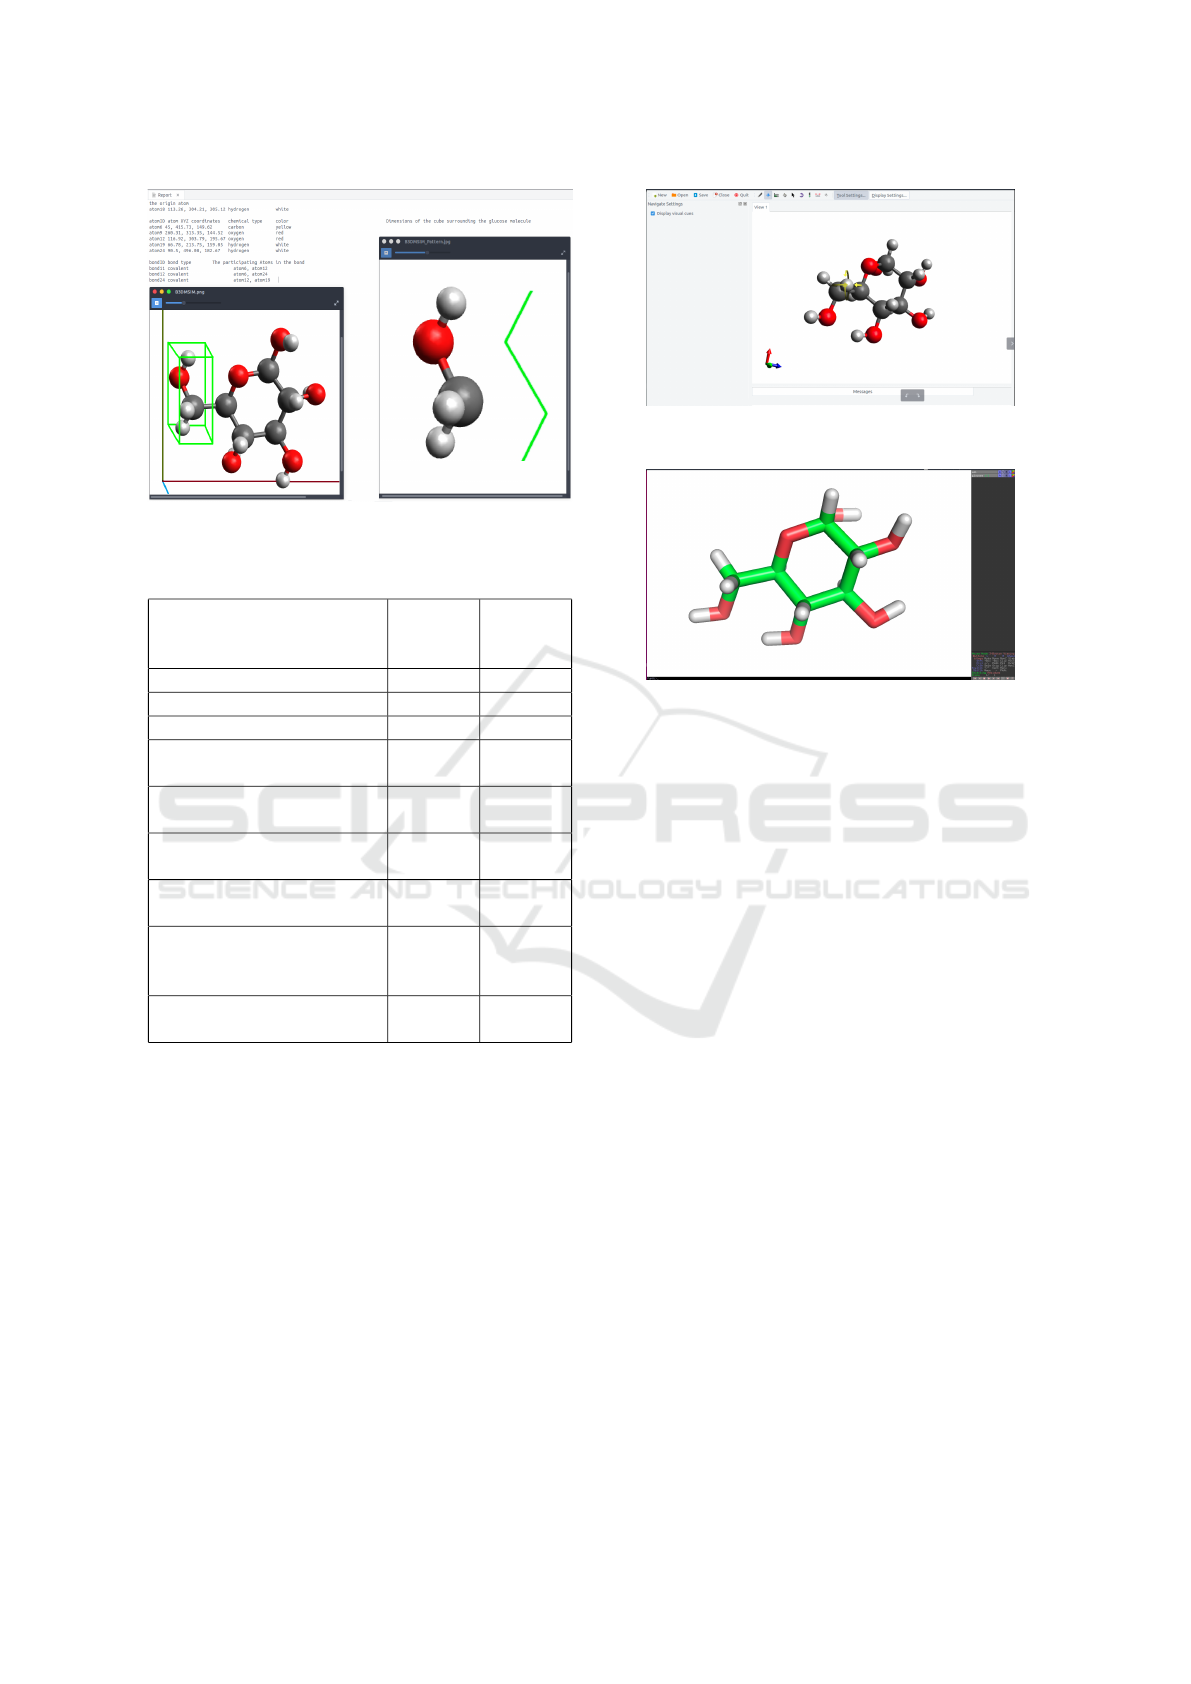
Figure 10: The geometric analysis of the proposed tool.
Table 1: Comparison between the available tools and the
proposed methodology.
Comparison criteria Available
tools
Proposed
method-
ology
User dependent Yes No
knowledge extraction No Yes
3D Rendering Yes Yes
Navigate inside the 3D
model
Yes Yes
View geometric patterns
inside the molecule
No Yes
Recognition of the
molecule surface
No Yes
The volume of empty
space inside the molecule
No Yes
The distribution of the
atoms density of the
molecule
No Yes
The distribution of atoms
weight of the molecule
No Yes
• The distances between the chosen atom and the
atoms behind it.
• The chemical bonds between the chosen atom and
the atoms behind it.
• 3D-images of the atoms spatial distribution.
• 3D-geometric shapes of the spaces between
atoms.
Next, the glucose molecule is examined using the
current tools like Avogadro and PyMol. As illustrated
in figures 11 and 12, the Avogadro and PyMol tools
render the glucose efficiently on the screen and wait
for the user to choose one atom as the center of rota-
tion. The user will rotate the glucose molecule using
the mouse and try to recognize the chemical types of
the atoms around the origin atom through their colors
Figure 11: Studying the glucose molecule using Avogadro
tool.
Figure 12: Studying the glucose molecule using PyMol
tool.
using his eyes. The user will try to study the rela-
tionships between the origin atom and atoms around
it using his knowledge in molecular sciences. The
user may have to spend some time in writing a small
script in a special programming language or click-
ing on menus and buttons in order to customize the
molecular viewer.
To sum up, we can easily note the outstanding ex-
tracted knowledge using the proposed methodology
in comparison with the currently available tools that
mainly depend on the user, as summarized in Table 1.
The proposed solution promises to open a new area of
molecular sciences and will significantly enhance the
development in this crucial field.
5 CONCLUSION
This paper represents a novel computer vision
methodology for molecular modeling and simulation
that gives the computer the ability to see, understand,
and analyze the molecular structures by itself with-
out human intervention. Its main idea was based on
using the computer’s memory (RAM) as a 3D-digital
representation of the molecule’s structure. A new al-
gorithm was developed to help the computer to see the
new representation, and extract the knowledge about
the vital aspects inside the molecule using a parallel
architecture to speed up the data processing. This pa-
per reviews most of the current molecular software
A Novel Computer Vision Methodology for Intelligent Molecular Modeling and Simulation
103

tools like RasMol, PyMOL, VMD, Avogadro, GRO-
MACS, and Jmol to discuss all their pros and cons.
The extracted knowledge reports the outstanding ca-
pabilities of the proposed methodology in comparison
with the current tools.
REFERENCES
Dawson, W. K., Maciejczyk, M., Jankowska, E. J., and Bu-
jnicki, J. M. (2016). Coarse-grained modeling of rna 3d
structure. Methods, 103(Supplement C):138 – 156. Ad-
vances in RNA Structure Determination.
Dreher, M., Piuzzi, M., Turki, A., Chavent, M., Baaden,
M., Frey, N., Limet, S., Raffin, B., and Robert, S. (2013).
Interactive molecular dynamics: Scaling up to large sys-
tems. Procedia Computer Science, 18(Supplement C):20
– 29. 2013 International Conference on Computational
Science.
Durrant, J. D. and McCammon, J. A. (2011). Molecular
dynamics simulations and drug discovery. BMC Biology,
9(1):71.
Durn-Riveroll, L. M. et al. (2016). Docking simulation of
the binding interactions of saxitoxin analogs produced by
the marine dinoflagellate gymnodinium catenatum to the
voltage-gated sodium channel nav1.4. Toxins. Available
from: ”http://www.mdpi.com/2072-6651/8/5/129”. Acc-
sessed: [13 MAY 2016].
Emsley, P. and Debreczeni, J.
´
E. (2012). The Use of Molec-
ular Graphics in Structure-Based Drug Design, pages
143–159. Humana Press, Totowa, NJ.
Friedrichs, M. S., Eastman, P., Vaidyanathan, V., Houston,
M., Legrand, S., Beberg, A. L., Ensign, D. L., Bruns,
C. M., and Pande, V. S. (2009). Accelerating molecular
dynamic simulation on graphics processing units. Jour-
nal of Computational Chemistry, 30(6):864–872.
Hanwell, M. D., Curtis, D. E., Lonie, D. C., Vandermeersch,
T., Zurek, E., and Hutchison, G. R. (2012). Avogadro:
an advanced semantic chemical editor, visualization, and
analysis platform. Journal of Cheminformatics, 4(1):17.
Humphrey, W., Dalke, A., and Schulten, K. (1996). Vmd:
Visual molecular dynamics. Journal of Molecular
Graphics, 14(1):33 – 38.
Jallu, V., Poulain, P., Fuchs, P. F. J., Kaplan, C., and
de Brevern, A. G. (2012). Modeling and molecular dy-
namics of hpa-1a and -1b polymorphisms: Effects on the
structure of the 3 subunit of the iib3 integrin. PLOS ONE,
7(11):1–10.
Khatib, F. et al. (2011). Crystal structure of a monomeric
retroviral protease solved by protein folding game play-
ers. nature structural and molecular biology, 18:1175–
1177.
Krieger, E. and Vriend, G. (2014). Yasara viewmolecu-
lar graphics for all devicesfrom smartphones to worksta-
tions. Bioinformatics, 30(20):2981–2982.
Lindert, S., Bucher, D., Eastman, P., Pande, V., and Mc-
Cammon, J. A. (2013). Accelerated molecular dynamics
simulations with the amoeba polarizable force field on
graphics processing units. Journal of Chemical Theory
and Computation, 9(11):4684–4691. PMID: 24634618.
Phillips, J. C., Braun, R., Wang, W., Gumbart, J., Tajkhor-
shid, E., Villa, E., Chipot, C., Skeel, R. D., Kal, L.,
and Schulten, K. (2005). Scalable molecular dynam-
ics with namd. Journal of Computational Chemistry,
26(16):1781–1802.
Potterton, E., McNicholas, S., Krissinel, E., Cowtan, K.,
and Noble, M. (2002). The CCP4 molecular-graphics
project. Acta Crystallographica Section D, 58(11):1955–
1957.
Sayle, R. A. and Milner-White, E. (1995). Rasmol:
biomolecular graphics for all. Trends in Biochemical Sci-
ences, 20(9):374 – 376.
Soni, S., Tyagi, C., Grover, A., and Goswami, S. K. (2014).
Molecular modeling and molecular dynamics simula-
tions based structural analysis of the sg2na protein vari-
ants. BMC Research Notes, 7(1):446.
BIOINFORMATICS 2018 - 9th International Conference on Bioinformatics Models, Methods and Algorithms
104
