
Predicting Future Antibiotic Susceptibility using Regression-based
Methods on Longitudinal Massachusetts Antibiogram Data
M. L. Tlachac
1
, Elke Rundensteiner
1
, Kerri Barton
2
, Scott Troppy
2
,
Kirthana Beaulac
3
and Shira Doron
3
1
Worcester Polytechnic Institute (WPI), 100 Institute Road, Worcester, MA, U.S.A.
2
Massachusetts Department of Public Health (MDPH), 305 South Street, Jamaica Plain, MA, U.S.A.
3
Tufts Medical Center, 800 Washington Street, Boston, MA, U.S.A.
Keywords:
Antimicrobial Resistance, Antibiotic Resistant Bacteria, Antibiograms, Predictive Analytics, Regression,
Support Vector Regression, Model Selection.
Abstract:
Antibiotic resistance evolves alarmingly quickly, requiring constant reevaluation of resistance patterns to guide
empiric treatment of bacterial infections. Aggregate antimicrobial susceptibility reports, called antibiograms,
are critical for evaluating the likelihood of effectiveness of antibiotics prior to the availability of patient specific
laboratory data. Our objective is to analyze the ability of the methods to predict antimicrobial susceptibility.
This research utilizes Massachusetts statewide antibiogram data, a rich dataset composed of average percent
susceptibilities of 10 species of bacteria to a variety of antibiotics collected by the Massachusetts Department
of Public Health from over 50 acute-care hospitals from 2002 to 2015. First, we improved data quality by
implementing data filtering strategies. We then predicted up to three future years of antibiotic susceptibilities
using regression-based strategies on nine previous years of data. We discovered the same prediction method-
ology should not be utilized uniformly for all 239 antibiotic-bacteria pairs. Thus, we propose model selection
strategies that automatically select a suitable model for each antibiotic-bacteria pair based on minimizing those
models’ mean squared error and previous year’s prediction error. By comparing the predictions against the
actual mean susceptibility, our experimental analysis revealed that the model selectors based on the predictions
of the previous performed best.
1 INTRODUCTION
1.1 Background on the Antibiotic
Resistance Threat
Antibiotic resistant bacteria of clinical significance
are becoming increasingly prevalent around the
world. The World Health Organization (WHO) has
classified the reported levels of antimicrobial resis-
tance as alarming. Infections due to antibiotic resis-
tant bacteria are more expensive to treat than other
bacterial infections, costing the U.S. economy an es-
timated 20 billion dollars a year in direct healthcare
costs, as well as at least that much in additional fi-
nancial burdens to patients, family members, and so-
ciety at large for loss of productivity. Patients with
antibiotic resistant bacterial infections also experi-
ence more devastating health outcomes ranging from
extended hospital stays to increased risk of death
(CDC, 2013; WHO, 2014). Conservative estimates
from 2013 attribute over two million infections and
23 thousand deaths to antibiotic resistant bacteria per
year (CDC, 2013). Without a deeper understanding
of resistance patterns and more informed prescription
practices, resistance rates will continue to increase
until there is no way to cure some bacterial infections.
The consequences of inaction are catastrophic.
The overuse of antibiotics is one of the main
causes of antimicrobial resistance (CDC, 2013; Ven-
tola, 2015). Once viewed as life-saving therapies, the
role of antibiotics in the public eye has shifted to be-
ing thoughtof as ubiquitouswithin healthcare. In fact,
antibiotics remain one of the most prescribed human
medicines (CDC, 2013). Unfortunately, antibiotics
are not always prescribed responsibly, with up to 50
percent of prescriptions either being unnecessary or
ineffective (CDC, 2013; Ventola, 2015). In particular,
incorrectly prescribed antibiotics have been shown to
contribute to antimicrobial resistance (Ventola, 2015).
Tlachac, M., Rundensteiner, E., Barton, K., Troppy, S., Beaulac, K. and Doron, S.
Predicting Future Antibiotic Susceptibility using Regression-based Methods on Longitudinal Massachusetts Antibiogram Data.
DOI: 10.5220/0006567401030114
In Proceedings of the 11th International Joint Conference on Biomedical Engineering Systems and Technologies (BIOSTEC 2018) - Volume 5: HEALTHINF, pages 103-114
ISBN: 978-989-758-281-3
Copyright © 2018 by SCITEPRESS – Science and Technology Publications, Lda. All rights reserved
103

1.2 Motivation for Antibiotic Resistance
Monitoring and Predictions
To prevent further unnecessary increases in resis-
tance and effectively treat patients, antibiotics should
be prescribed more responsibly based on resistance
patterns (Ventola, 2015). This can only be accom-
plished with accurate up-to-date susceptibility knowl-
edge. Outdated resistance information facilitates the
propagationof ineffective and inappropriateantibiotic
use by suggesting antibiotics may be effective when
they are not. Antibiotic resistance is tracked using
antibiograms, reports that provide the average per-
cent susceptibility of select antibiotics tested against
samples of bacteria, called clinical isolates, that are
collected from patients in medical facilities. Antibi-
ograms are routinely generated by microbiology lab-
oratories for acute care facilities and, less often, for
other healthcare facilities and organizations. These
antibiograms are used to monitor resistance trends
and to guide prescription practices before patient spe-
cific laboratory data is available.
Despite the growing antimicrobial resistance cri-
sis, there is a lack of both widespread data and previ-
ous analytics on longitudinal resistance patterns. Ac-
cording to the World Health Organization (WHO),
there is no coordinated surveillanceof antibiotic resis-
tance bacteria (WHO, 2014). Even when antimicro-
bial resistance data is monitored, there is at best a few
months delay after the collection period until the an-
tibiograms are assembled. For instance, if reports are
collected yearly, susceptibility data from the begin-
ning of a given year would be used to guide prescrip-
tion practices over two years later. Unfortunately,
this inevitably means antibiotics are prescribed using
outdated resistance knowledge and the responses to
emerging resistance threats are delayed. Thus, pre-
dictive analytics needs to be applied to model existing
susceptibility data and predict future susceptibility for
many antibiotic-bacteria pairs. These predictions can
be used to guide prescription practices and prepare for
future resistance threats. However, antimicrobial an-
alytics on multiple antibiotic-bacteria pairs is largely
lacking in the literature.
1.3 Previous Antimicrobial Analytics
The chi-square test is a popular statistical method
to analyze antibiogram data as it only requires data
from two different sets of time (Crnich et al., 2007;
Hastey et al., 2016). However, this test can only
reveal which antibiotic-bacteria pairs experienced a
significant change in resistance over those two sets
of time. Other papers incorporate machine learning
methods, notably regression variants, but the investi-
gators do not utilize these methods to make predic-
tions about antimicrobial resistance in future years
(Anderson et al., 2012; Crnich et al., 2007; Lagace-
Wiens et al., 2013). One of these studies uses mul-
tivariate regression analysis to isolate the impact of
time with five years of data from Canadian hospitals
(Lagace-Wiens et al., 2013). Another study uses lin-
ear regression to predict the future amount of antimi-
crobial infections based on five years of data from US
nursing homes (Crnich et al., 2007). Lastly, there is
a study that uses logistic regression to determine for
how many days the antibiogram was a reliable pre-
dictor of Pseudomonas aeruginosa susceptibility with
eight years of data from Duke University Hospital
(Anderson et al., 2012). However, the need for high-
quality continuous monitoring, analysis, and predic-
tion of antibiotic resistance remains. In particular, it
it important to reliably incorporate more antibiotic-
bacteria pairs as well as leverage longitudinal data as-
sets collected from more medical facilities.
1.4 Scope of this Paper
The objective of this work is to utilize, design, and
evaluate predictive methods for their effectiveness
to predict antibiotic susceptibility on a longitudi-
nal antibiogram dataset. This work leverages the
Massachusetts statewide antibiogram dataset curated
by the Massachusetts Department of Public Health
since 1999 (Bureau of Infectious Disease and Labo-
ratory Sciences, 2016). No other study in the liter-
ature currently tackles predicting antimicrobial resis-
tance on this scale. Specifically, the Massachusetts
statewide antibiogram dataset is expansive enough
that we can predict antimicrobial susceptibility mul-
tiple years into the future for more than two hundred
antibiotic-bacteria pairs.
Using this dataset, we evaluate the effectiveness
of regression-based methods for their ability to pre-
dict multiple years into the future. Our analysis re-
veals a need for a strategy that seamlessly learns
and then utilizes the best prediction model for each
antibiotic-bacteria pair. We address this by design-
ing model selection strategies based on several key
metrics. Namely, these meta-methods select the most
appropriate model for each antibiotic-bacteria pair by
minimizing those models’ mean squared error and
previous year’s prediction error. By comparing the
predictions against the actual mean susceptibility, our
experimental analysis concludes that our proposed
model selector methodology is more effective at pre-
dicting future susceptibility percents compared to ex-
isting methods.
HEALTHINF 2018 - 11th International Conference on Health Informatics
104

2 DATASET, METHODOLOGY,
AND METHODS
2.1 The Massachusetts Statewide
Antibiogram Dataset
This research is conducted on 14 years of Mas-
sachusetts statewide antibiogram data. The antibi-
ograms that form this dataset were collected by the
Massachusetts Department of Health (MDPH) from
2002 to 2015 from over 50 acute-care hospitals across
the state. This expansive dataset contains suscepti-
bility data for 10 species of bacteria tested against
a subset of the total 86 antibiotics for a total of 766
antibiotic-bacteria pairs. Samples of bacteria, called
isolates, were collected from patients within acute-
care hospitals using cultures.The antibiotic suscepti-
bility of these isolates was tested in hospital microbi-
ology laboratories. They are considered susceptible
or resistant to tested antibiotics based on the Clini-
cal and Laboratory Standards Institute (CLSI) guide-
lines and the US Food and Drug Administration ap-
proved breakpoints of concentrationof the antibiotics.
The isolates collected from a hospital during the same
year, aggregated to create a single antibiogram, are
then reported to MDPH the year subsequent to when
the testing occurred.
The dataset is composed of 101, 021 individual
data points. The data points contain an antibiotic, a
bacteria, the number of isolates, the percent of the
isolates that were susceptible, the year, the hospital,
and the location within the hospital where the isolates
were collected. We utilize these data points in our
prediction methodology (Section 2.3).
While the Massachusetts statewide antibiogram
dataset is impressive in size and scope, data procure-
ment occurring over 14 years and more than 50 hos-
pitals varies in reliability. There were policy changes
over time that to some degree influenced quality and
quantity of antibiograms submitted to the MDPH.
One consideration is the possible inclusion of dupli-
cate isolates of the same infection. Also, it is chal-
lenging to verify if all microbiology laboratories that
tested the isolates followed the most updated CLSI
guidelines. Lastly, at some hospitals, antibiograms
with fewer than 20 to 30 bacteria isolates may not
have been reported to MDPH. While data quality has
been consistently on the incline over the years, some
of these issues may still arise even in more recent data.
Knowing this, we implemented a series of measures
to mitigate the possible impact that these described
data quality issues may cause, as described below.
2.2 Preprocessing
Our preprocessing goal is to improve data quality
and robustness of predictions while maintaining the
ability to predict future susceptibility for as many
antibiotic-bacteria pairs as possible. First, we ad-
dress the specific concerns mentioned above in Sec-
tion 2.1 to improve data quality. As antibiograms with
fewer isolates are not as trusted, we only consider data
points with at least 20 isolates. After this cleaning
step, 84.7 percent of the data points remain.
Further data cleaning must balance the goal of
minimizing the impact of possible data quality issues
by aggressively removing potentially erroneous data
points against the requirement to maintain a represen-
tative critical mass of the antibiotic-bacteria pairs to
assure a high-fidelity data analysis. Given that the
quality of data may vary based on the CLSI guide-
lines adherence, we established the following data
quality guidelines. Namely, we require that there are
at least four data points for the specific antibiotic-
bacteria pair for the target years we will predict. This
diminishes the impact of an outlier susceptibility per-
cent influencing the actual mean susceptibility per-
cent which we use to evaluate our predictions (Sec-
tion 2.5). As second requirement, we also stipulate
that there must be at least one data point in each of
the four prior years.
The decision about how many data points to re-
quire as minimal membership was supported by an
empirical study on the above mentioned trade-off of
data quality and antibiotic-bacteria pair quantity. That
is, we require only four data points in the aforemen-
tioned predicted years because it is a good compro-
mise between minimizing the impact of the poten-
tial error and maximizing the number of antibiotic-
bacteria pairs that can be predicted. There is a slight
increase in prediction ability when the number of re-
ports required in the target and prior years are in-
creased. However, the benefit is offset by the decrease
in the number of antibiotic-bacteria pairs that feature
sufficient data in this reduced dataset. As we desire to
predict as many pairs as possible, we opt for fewer re-
strictions that still mitigate the worst potential errors.
After cleaning the dataset contains 34 antibiotics
and 10 species bacteria that combine to form 239
antibiotic-bacteria pairs. 16 pairs include Acinetobac-
ter baumannii, 22 pairs include Enterobacter aero-
genes, 23 pairs include Enterobacter cloacae, 25 pairs
include Escherichia coli, 23 pairs include Klebsiella
oxytoca, 24 pairs include Klebsiella pneumoniae, 21
pairs include Pseudomonas aeruginosa, 24 pairs in-
clude Serratia marcescens, 18 pairs include Staphy-
lococcus aureus not including isolates specified as
Predicting Future Antibiotic Susceptibility using Regression-based Methods on Longitudinal Massachusetts Antibiogram Data
105
MRSA or MSSA, and 3 pairs include
Stenotrophomonas maltophilia. Additionally, 20
pairs include methicillin-resistant Staphylococcus
aureus (MRSA) and 20 pairs include methicillin-
susceptible Staphylococcus aureus (MSSA).
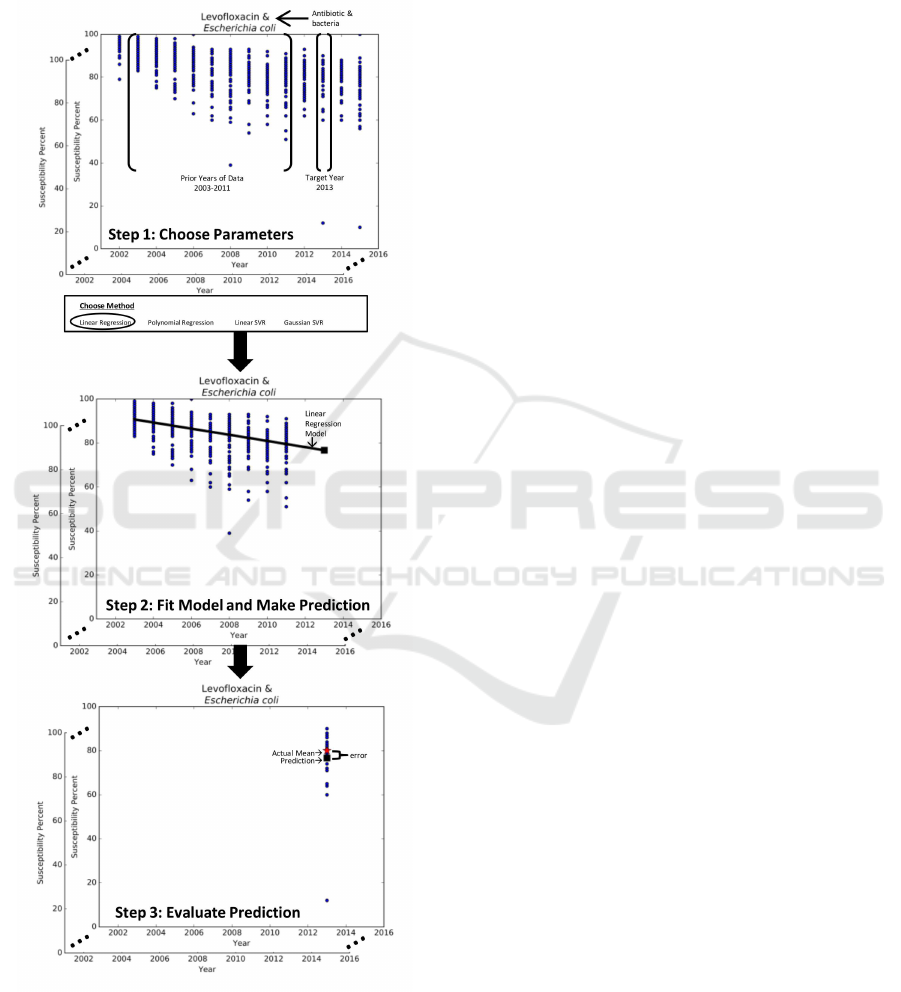
Figure 1: 3-step methodology for predictive analytics.
2.3 Predictive Model Methodology
Our objective is to utilize the susceptibility percents
of the prior years of data to predict the next three
years of susceptibility for each antibiotic-bacteria
pair. For this, we divide the Massachusetts statewide
antibiogram dataset into a collection of data sub-
sets, namely, one subset for each targeted antibiotic-
bacteria pair. Our methods then apply the same
methodology to each subset independently to predict
susceptibility for each antibiotic-bacteria pair.
In particular, our methodology for predictive an-
alytics takes a three-pronged approach, seen in Fig-
ure 1. Step 1 selects the parameters for the prediction
problem such as the antibiotic-bacteria data subset,
the method M, the target yearY, and the prior years of
data H. Step 2 uses method M to establish the model
that best captures the trends in the prior years of data
H to make a prediction for year Y. Step 3 utilizes
evaluation metrics to measure the effectiveness of the
prediction against the observed data for year Y.
As we are comparing the predicted susceptibility
percent for year Y against the actual data for year
Y, the prior years of data H must consist of a sub-
set of the 14 years of data. The number of years
in this subset is further limited by two factors: (1)
year Y can be up to three years into the future and
(2) the results should not be year specific. As such,
in this study design, the prior years of data H con-
sist of nine years y
1
, . . . , y
9
of historic susceptibility
percents. This historic data is used to predict the sus-
ceptibility percent for the tenth year y
10
, eleventh year
y
11
, or twelfth year y
12
. To ensure that the results of
our methodology are not year specific, we develop a
sliding window mechanism that enables us to repeat
the process for multiple target years, namely, 2013,
2014, and 2015. Thus, the input of our predictive
methods corresponds to the susceptibility percents for
years y
1
, . . . , y
9
and the output is a model that can be
used to predict the mean susceptibility percent for the
target year Y, which is either y
10
, y
11
, or y
12
.
2.4 Regression-based Models
We apply the above methodology with four
regression-based methods: linear regression,
polynomial regression, linear support vector re-
gression (linear SVR), and Gaussian support vector
regression (Gaussian SVR). The same method is
applied uniformly to each antibiotic-bacteria pair
to create a collection of predictive models. If the
resulting predictions are below 0 or above 100, they
are readjusted to be 0 or 100, respectively, as the unit
of the predictions is a percent.
2.4.1 Regression Models
Regression methods build models that best describes
the susceptibility percent over time. Statistically, re-
HEALTHINF 2018 - 11th International Conference on Health Informatics
106

gression is a method of analyzing the impact of an
independent variable, year, on a dependent variable,
susceptibility. By minimizing the sum of squared er-
rors between the susceptibility of the data points and
the model output, we are able to obtain a function that
best fits the data. By inserting Y into this resulting
function, we can predict the susceptibility for year
Y. Thus, using the methodology described in Sec-
tion 2.3, the regression model can be used to predict
susceptibility for future years. In this particular study,
we select two types of regressions: linear regression
and second degree polynomial regression.
2.4.2 Support Vector Regression Models
Support vector regression (SVR) is a variation of re-
gression that utilizes the support vector algorithm to
find the function for modeling trends in the data.
Specifically, SVR finds a function with a margin and
the error is minimized only between the output of
the function and the data points within this margin
(Smola and Scholkopf, 2004). In this way, SVR is
more robust to outliers and generates different predic-
tions than traditional regression. The merit of using
SVR for predictive analytics is its generalization abil-
ity (Yang and King, 2009).
Additionally, the support vector algorithm can uti-
lize kernel functions to map the data into a higher di-
mensional input space. This is useful if the data does
not conform to a linear distribution. We use linear
SVR to compare the prediction ability between re-
gression and SVR in this domain. We also generate
predictions with Gaussian SVR to determine if the in-
put follows a Gaussian distribution instead of a linear
distribution.
2.5 Metrics for Model Evaluation
To evaluate the prediction ability of the regression-
based models, we compare the actual mean suscep-
tibility a to our predicted susceptibility p for target
year Y for a specific antibiotic-bacteria pair. The ac-
tual mean susceptibility corresponds to the mean of
the actual observed susceptibility of the isolates re-
ported by the hospitals. This actual mean susceptibil-
ity a is calculated by weighing the observed suscepti-
bility, ranging from 0 to 100 percent, by the respective
number of bacteria samples (also called isolates). The
definition of the actual mean susceptibility metric a
is shown in Equation 1.
a =
n
∑
i=1
(c
i
∗b
i
)
n
∑
i=1
(b
i
)
(1)
where n corresponds to the number of data points in
year Y for the specific antibiotic-bacteria pair, b
i
de-
notes the number of isolates and c
i
the observed sus-
ceptibility of the isolates of the i-th data point for
i = 1, . . . , n.
We use three evaluation metrics to determine the
quality of our prediction strategies, namely, the mean
absolute error of the predictions and the percent of
predictions for which the error is less than or equal to
a constant threshold or to a variable threshold, respec-
tively. While the former is a commonly used metric,
the later two are customized to our problem at hand
by incorporating guidelines of the domain.
The first evaluation metric, the mean absolute er-
ror (MAE), is a common metric used for assessing the
quality of predictive techniques (Moore, 2007). The
mean absolute error MAE metric, defined in Equa-
tion 2, simply measures the absolute difference be-
tween the predicted versus the actual mean suscepti-
bility across all predicted antibiotic-bacteria pairs.
MAE =
1
m
m
∑
j=1
|p
j
−a
j
| (2)
where m denotes the number of antibiotic-bacteria
pairs, p
j
refers to the predicted susceptibility and
a
j
to the actual mean susceptibility for each of the
antibiotic-bacteria pairs AB
j
from j = 1, . . . , m.
However, common regression evaluation metrics,
such as MAE, fail to evaluate the potential usefulness
of the predictions for the domain. This leads us to
the introduction of a new metric based on the follow-
ing observation. Namely, an antibiotic-bacteria pair’s
predicted susceptibility p is considered to be close
enough to the actual mean susceptibility a to be us-
able to guide prescription practices as long as it falls
within a threshold of at most five susceptibility per-
cent. This was affirmed by multiple domain experts
to be an acceptable error in the case when susceptibil-
ities from multiple hospitals are aggregated.
We propose to capture this guideline by the new
evaluation metric p
ercent of useable predictions
(PUP). The PUP metric, defined in Equation 3, com-
putes the percent of antibiotic-bacteria pairs with an
absolute error |p − a| less than or equal to the five
susceptibility percent threshold.
PUP =
|{AB
j
: (|p
j
−a
j
| ≤ 5), j ∈ [1 : m]}|
m
(3)
where p
j
refers to the predicted susceptibility and
a
j
to the actual mean susceptibility for each of the
antibiotic-bacteria pairs AB
j
from j = 1, . . . , m. The
closer to 100 percent the PUP metric is, the more
pairs are being predicted with sufficient accuracy to
guide prescription practices.
Predicting Future Antibiotic Susceptibility using Regression-based Methods on Longitudinal Massachusetts Antibiogram Data
107

Finally, we note that this PUP metric fails to take
into consideration that the more data points are avail-
able for each antibiotic-bacteria pair, the more the
actual mean susceptibilities a are deemed reliable.
Thus, whether the prediction p is thought to be sig-
nificantly different from the actual mean susceptibil-
ity a depends on the number of data points available
for that particular antibiotic-bacteria pair. Using this
observation, we now design a flexible threshold cus-
tomized to each pair in place of the above rigid con-
stant threshold.
More specifically, when considering the suscepti-
bility of a antibiotic-bacteria pair from a single hospi-
tal for two consecutive years, a change of more than
ten susceptibility percent is considered significant ac-
cording to domain experts. It follows then that if there
is only one data point in year Y, a prediction p over
ten susceptibility percents away from the actual mean
susceptibility a is significantly different. This means
that the imposed population standard deviation σ is
ten for every antibiotic-bacteria pair.
Since averaging the susceptibility of the data
points mitigates the effects of potential errors, when
the number of data points in Y increases, the abso-
lute error |p −a| that is considered to be acceptable
decreases. We thus introduce the standard error SE
j
formula, defined in Equation 4, to represent the flex-
ible error threshold customized for each antibiotic-
bacteria pair AB
j
based on the number of data points
n in year Y for the pair (James et al., 2013).
SE
j
=
σ
√
n
j
(4)
where n
j
refers to the number of data points in year
Y for AB
j
and σ = 10 is the imposed population stan-
dard deviation. As the number of data points n in year
Y range from 4 to 64 in our cleaned dataset, based
on Equation 4, the SE threshold thus ranges from
5 to 1.25 susceptibility percent. In other words, as
the number of data points increases, the threshold be-
comes tighter.
Lastly, we propose a new evaluation metric called
p
ercent of insignificant errors (PIE). The PIE met-
ric, formulated in Equation 5, computes the percent of
antibiotic-bacteria pairs with an absolute error |p−a|
less than or equal to the respective standard error SE.
PIE =
|{AB
j
: (|p
j
−a
j
| ≤ SE
j
), j ∈ [1 : m]} |
m
(5)
where p
j
refers to the predicted susceptibility, a
j
to
the actual mean susceptibility, and the SE
j
thresh-
old to the calculated standard error for the antibiotic-
bacteria pair AB
j
from j = 1, . . . , m as defined in
Equation 4. The closer to 100 percent the PIE metric
is, the more antibiotic-bacteria pairs are considered to
have a prediction error considered to be insignificant.
2.6 Model Selection Methodology
Given that not all antibiotic-bacteria pairs may con-
form to the same distribution over time, as in-
deed confirmed by our experimental study in Sec-
tion 3.2, we design a strategy to provide customized
model types fitting every antibiotic-bacteria pair sub-
set. To tackle this, in addition to the aforementioned
regression-based models applied uniformly to every
antibiotic-pair, we propose higher-order model selec-
tors that select among the predictive models for each
pair.
As such, we propose a model selection method-
ology composed of four steps. Step 1 selects the
parameters for the prediction problem such as the
antibiotic-bacteria data subset, a set of methods, the
target year Y, the prior years of data H, and the selec-
tion criteria. Step 2 uses each method in the method
set to establish a model that best captures the trends
of the prior years of data H. Step 3 selects the best
model for the antibiotic-bacteria subset based on the
chosen selection criteria and then uses that model to
make a prediction for year Y. Step 4 uses evaluation
metrics to measure the effectiveness of the prediction
for target year Y.
2.7 Strategies for Model Selection
We propose two model selectors with unique selec-
tion criteria: minimizing the models’ mean squared
error and minimizing the models’ previous year’s pre-
diction error.
2.7.1 Mean Squared Error Model Selector
Mean squared error (MSE) is a common metric used
to evaluate how well data points fit a regression. For
each model, we calculate the MSE between the actual
mean susceptibility in years y
1
, . . . , y
9
and the model’s
estimated susceptibility for those years. This MSE se-
lector then selects the model with the lowest MSE to
predict the susceptibility percent for the target yearY.
This process is repeated for each antibiotic-bacteria
pair to determine which model should be used to
make predictions for that particular pair.
2.7.2 Previous Year Prediction Error Reduction
Model Selector
We now introduce a refined model selection strat-
egy that aims to select the model that predicts the
next three years the best, which we call p
revious
HEALTHINF 2018 - 11th International Conference on Health Informatics
108

year prediction error reduction strategy, or in short
PYPER. PYPER uses the model that has the smallest
absolute error in the previous year to make a predic-
tion for the target year Y.
Specifically, we will create models to capture nine
years y
0
, . . . , y
8
of data and use these models to pre-
dict the susceptibility for y
9
. The model with the
smallest absolute error between the predicted and the
actual mean susceptibility percent for y
9
is selected
for that specific antibiotic-bacteria pair. If tied, the
model with the smallest aggregated mean absolute er-
ror MAE is chosen. The chosen method using suscep-
tibilities from y
1
, . . . , y
9
is used to make predictions
for the target year Y which is either y
10
, y
11
, or y
12
.
This process of selecting a model and generating a
prediction is repeated for each antibiotic-bacteriapair.
Lastly, we design a variant of the PYPER model
selection family, referred to as PYPERed (for PYPER
with e
rror distinction). PYPERed selects an overall
well-performing prediction model as default when-
ever the previous year’s prediction error falls un-
der a specified threshold. This strategy is inspired
by the observation that for some antibiotic-bacteria
pairs the susceptibility changes minimally over time.
PYPERed allows us to automatically utilize the previ-
ous actual mean susceptibility for these cases, while
selecting among the aforementioned predictive meth-
ods if the antibiotic-bacteria pairs experience more
notable susceptibility changes. The distance thresh-
old we use in this instance is calculated using the
standard error SE formula, Equation 4, with the num-
ber of data points in year y
9
. If the absolute differ-
ence between the actual mean susceptibilities a in y
8
and y
9
is less than the calculated SE, PYPERed se-
lects the actual mean susceptibility a of year y
9
as
the prediction for year Y. Otherwise, PYPERed em-
ploys the PYPER model selection methodology de-
scribed above to select the best predictive model for
that antibiotic-bacteria pair.
2.8 Software Tools and Availability
This work was completed using Python 3.5.2. The
libraries we used are Pandas (v.0.18.1) for data pre-
processing, Numpy (v.1.11.1) for data preprocessing
and machine learning, scikit-learn (v.0.17.1) for ma-
chine learning, and Matplotlib (v1.5.1) for visual-
izations. Specifically, the code used for the mod-
els was linear
model.LinearRegression() and SVR()
with fit() and predict(). Also, polyfit and poly1d
are utilized for polynomial regressions. We have
released the code along with additional plots at
https://github.com/mltlachac/HEALTHINF2018.
3 EXPERIMENTAL RESULTS
For each antibiotic-bacteria pair, we use linear regres-
sion, polynomial regression, linear SVR, and Gaus-
sian SVR to make predictions for 2015, 2014, and
2013. The models are constructed with nine years of
data from one, two, and three years prior to the tar-
get year Y. As mentioned in Section 2.5, the mean
absolute error MAE, Equation 2 is most useful for
comparing models. Additionally, the percent of use-
ful prediction PUP, Equation 3, and the percent of
insignificant errors PIE are particularity useful in un-
derstanding the effectiveness of the models in the do-
main.
3.1 Evaluating Regression-based
Methods
We use linear regression, polynomial regression, lin-
ear SVR, and Gaussian SVR to model the nine cases
created by combining of target years 2013, 2014, and
2015 with data points from one, two, and three years
prior. Gaussian SVR performs the best for predicting
2015 when predicting two and three years into the fu-
ture for evaluation metrics MAE and PIE. The linear
methods perform best for predicting 2014 and 2013.
Polynomial regression performs worse than the other
methods. Also, the MAE of polynomial regression in-
creases the most when predicting more years into the
future, indicating that the majority of the antibiotic-
bacteria pairs do not follow a polynomial trend over
time. Overall, we observe that which model yields
the best predictions is highly dependent on not only
the number of years into the future predicted but also
the particular year that is being predicted.
To ensure that the results of our regression models
are applicable to multiple years, we have aggregated
over the year predicted when predicting one, two, and
three years into the future. These results are displayed
in Tables 1, 2, and 3, respectively. We observe that the
prediction abilities of linear regression, linear SVR,
and Gaussian SVR are relatively close on these ag-
gregated results. That is, the difference in the mean
absolute error MAE ranges from 0.04 susceptibility
percent when predicting two years ahead to 0.18 sus-
ceptibility percent when predicting three years ahead.
The linear models perform slightly better when
predicting two years ahead with MAE under 2.5 sus-
ceptibility percent, while the SVR models performed
better when predicting three years ahead with a MAE
of just over 2.8 susceptibility percents. When predict-
ing one year ahead, linear regression and Gaussian
SVR are the best predictors with a MAE barely over
two susceptibility percents. Given this, we conclude
Predicting Future Antibiotic Susceptibility using Regression-based Methods on Longitudinal Massachusetts Antibiogram Data
109

that linear regression, linear SVR, and Gaussian SVR
are equally valid choices as predictors when predict-
ing either one, two, or three years into the future.
Table 1: Comparison of regression model performance
when predicting 1 year into the future.
Method MAE PUP PIE
Linear Regression 2.04 89.82 71.69
Poly. Regression 2.45 85.63 68.90
Linear SVR 2.17 88.01 70.57
Gaussian SVR 2.04 88.28 70.85
Table 2: Comparison of regression model performance
when predicting 2 years into the future.
Method MAE PUP PIE
Linear Regression 2.48 86.05 65.41
Poly. Regression 3.59 79.22 55.93
Linear SVR 2.47 85.36 65.27
Gaussian SVR 2.52 85.08 66.11
Table 3: Comparison of regression model performance
when predicting 3 years into the future.
Method MAE PUP PIE
Linear Regression 3.00 82.43 60.39
Poly. Regression 4.94 71.41 47.14
Linear SVR 2.83 83.26 62.76
Gaussian SVR 2.83 82.29 64.71
However, as noticed by the increasing averages
over time, the methods’ prediction abilities decline
when predicting more years ahead. The MAE be-
tween the predicted and mean susceptibility percents
increase almost 0.8 susceptibility percents when pre-
dicting one year ahead to three years ahead. A simi-
lar decrease in prediction ability between years is ob-
served for the PUP evaluation metric. PUP starts at
just over 88 percent for linear regression, linear SVR,
and Gaussian SVR when predicting one year into the
future. Then PUP decreases about four percent each
subsequent year into the future that is predicted.
Linear regression, linear SVR, and Gaussian re-
gression all have PIE values of just over 70 when pre-
dicting one year into the future. While lower than the
PUP values, this is expected as the maximum thresh-
old for PIE is equal to constant threshold for PUP.
The decrease in the values of PIE evaluation met-
ric are over 4.5 susceptibility percent when predict-
ing for all of these methods. However, while PIE
continues to decrease at a similar rate for linear re-
gression when predicting three years into the future,
the rate slows for the SVR methods. There is only
a 1.4 percent decrease when increasing from predict-
ing two years to three years into future for Gaussian
SVR. This indicates that for just over 60 percent of
antibiotic-bacteria pairs, the amount of error from the
SVR predictions is insignificant even when predicting
more than two years into the future. Thus, while our
models perform better when predicting fewer years
into the future, there are some antibiotic-bacteriapairs
that the SVR models continue to predict well even
multiple years into the future.
3.2 Evaluating Model Selectors
Upon analysis of which antibiotic-bacteria pairs were
predicted best using each method, we observe that
different prediction methods performed best for dif-
ferent pairs. In Tables 1, 2, and 3, the smallest
mean absolute error MAE of the best uniformly ap-
plied regression-based method is 2.04, 2.47, and 2.83
susceptibility percents when predicting one, two, and
three years into the future, respectively. If we select
the model with the smallest difference between the
predicted p and the actual mean susceptibility a per-
cent for each antibiotic-bacteria pair, we can reduce
the MAE by over one susceptibility percent regard-
less of how many years into the future are predicted.
We can effectively consider these MAE values, seen
in the first row of Tables 4, 5, and 6, as our upper
bound for the prediction ability of the model selectors
using linear regression, polynomial regression, linear
SVR, and Gaussian SVR. Given the ability to reduce
the MAE by individually selecting a model for each
antibiotic-bacteria pair, a method selection technique
could improve our ability to predict future suscepti-
bility percents.
3.2.1 Evaluating the MSE Model Selector
When the set of the models that the MSE selector
can choose from includes polynomial regression, the
resulting subpar values of the evaluation metrics are
very similar to those of the evaluation metric val-
ues for polynomial regression. Given this, we re-
moved polynomial regression from the set of meth-
ods. The resulting evaluation metrics when predicting
one, two, and three years into the future are depicted
in Tables 4, 5, and 6, respectively.
The MSE selector performs better for every eval-
uation metric after removing polynomial regression.
However, the MSE selector still performs worse than
the best uniformly applied regression-based method,
as seen by the higher MAE values. This suggests
that the model that overall fits the historical data best
based on minimizing the MSE is not the best model
to use for predicting the susceptibility of future years.
HEALTHINF 2018 - 11th International Conference on Health Informatics
110
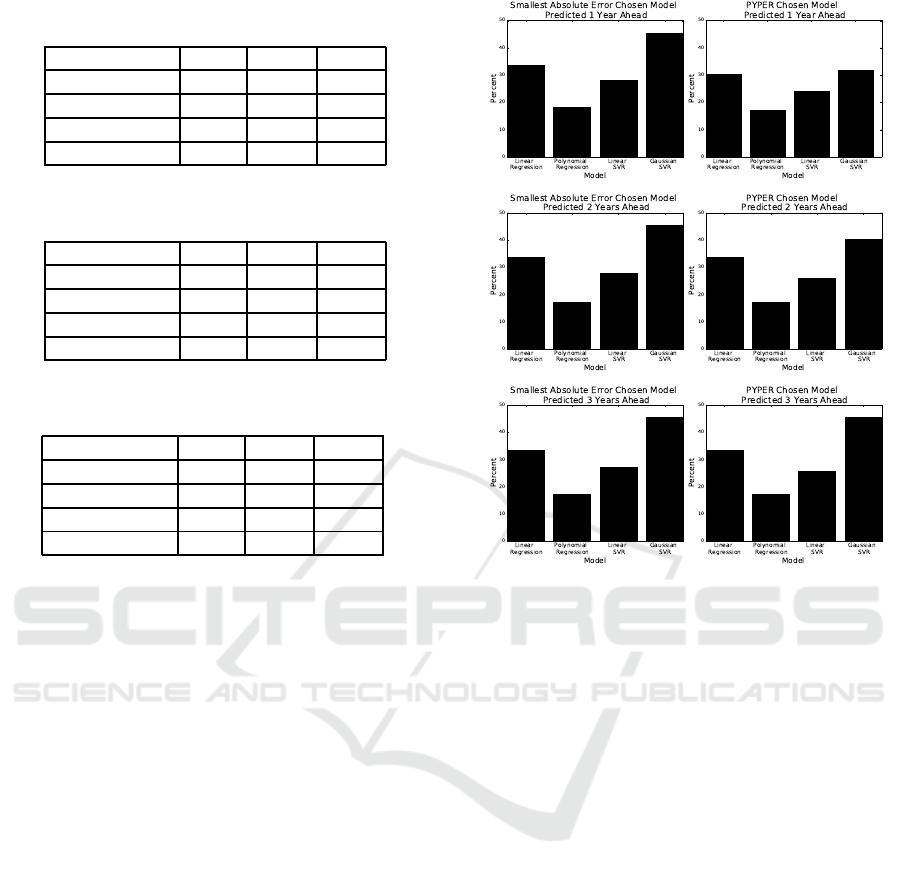
Table 4: Comparison of model selection performance when
predicting 1 year into the future.
Method MAE PUP PIE
Upper Bound 1.01 96.09 88.00
MSE Selector 2.11 88.56 70.15
PYPER 1.80 91.49 75.73
PYPERed 1.61 91.91 81.59
Table 5: Comparison of model selection performance when
predicting 2 years into the future.
Method MAE PUP PIE
Upper Bound 1.40 93.17 81.73
MSE Selector 2.59 83.96 65.97
PYPER 2.21 88.01 70.01
PYPERed 2.04 90.01 73.22
Table 6: Comparison of model selection performance when
predicting 3 years into the future.
Method MAE PUP PIE
Upper Bound 1.64 90.38 79.77
MSE Selector 2.98 81.45 61.37
PYPER 2.65 84.52 64.99
PYPERed 2.37 86.75 68.62
3.2.2 Evaluating the PYPER Model Selector
The strength of PYPER is that it chooses the spe-
cific method based only on the fit of the previous
year for each antibiotic-bacteriapair individually. Un-
like the MSE selector, selecting models using PYPER
increases our ability to predict future susceptibilities
when results are aggregated by year. PYPER’s eval-
uation metrics when predicting one, two, and three
years into the future are in Tables 4, 5, and 6, respec-
tively. These results also only include linear regres-
sion, linear SVR, and Gaussian SVR models as in-
cluding polynomial regression either decreased or has
no impact on PYPER’s prediction ability.
Polynomial regression is never chosen when pre-
dicting two or three years into the future as seen in
Figure 2. This further indicates polynomialregression
is not an effective method for predicting susceptibil-
ity percents multiple years into the future. In Figure 2,
we can also see that the frequency each model is cho-
sen by PYPER closely mirrors the frequencythat each
model has the smallest absolute error |p −a| in the
target year Y. While the frequency PYPER chooses
Gaussian SVR is higher, this is understandable given
that Gaussian SVR is the chosen method in the occur-
rence of a tie (Section 2.7.2).
PYPER’s prediction ability decreases steadily the
more years into the future that are predicted. The
MAE decreases by over 0.4 susceptibility percent and
Figure 2: Frequency that models have the smallest absolute
error |p −a| compared against frequency that models are
chosen by PYPER.
the PIE by over five percent for each subsequent year
predicted into the future. According to the MAE,
PYPER performs worse than Gaussian SVR when
predicting 2015 using data from 2004 to 2012. De-
spite this, when aggregated over the year predicted,
PYPER still demonstrates a small increase in predic-
tion ability with all evaluation metrics when predict-
ing three years into the future. When predicting one
and two years into the future, PYPER decreases the
aggregated MAE by over two susceptibility percent,
increases the aggregated PUP by over 1.6 percent,
and increases the aggregated PIE by over 3.9 per-
cent in comparison to the best performing regression-
based models.
3.2.3 Evaluating the PYPERed Selector
We observed that some antibiotic-bacteria pairs show
very little change in mean susceptibility or oscillate
around a consistent mean susceptibility over time. We
take advantage of this fact and set our default method
to be the mean susceptibility of the previous year. If
the absolute difference between the actual mean sus-
ceptibilities of year y
8
and year y
9
is less than SE in
Equation 4 calculated with the number of reports in
Predicting Future Antibiotic Susceptibility using Regression-based Methods on Longitudinal Massachusetts Antibiogram Data
111

year y
9
, we use the mean susceptibility for year y
9
as
the prediction for the target yearY. Otherwise, we use
PYPER’s methodology in Section 2.7.2 to select the
method. The aggregated results for predicting one,
two, and three years ahead are in the last row of Ta-
bles 4, 5, and 6, respectively.
PYPERed performs better than all of the
other proposed methods including PYPER. When
PYPERed is compared to PYPER, the decrease in
MAE is just under 0.2 susceptibility percent when
predicting one and two years ahead, and over 0.25
susceptibility percent when predicting three years
ahead. Additionally, there is an increase in over two
susceptibility percent for PUP when predicting two
and three years ahead and an increase in over four
percent for PIE when predicting one and two years
ahead. PYPERed producesthe best susceptibility pre-
dictions for every year predicted.
4 DISCUSSION
Our results demonstrated that different models per-
form best depending on the year predicted, the
number of years predicted into the future, and the
antibiotic-bacteria pair. To combat the latter of these,
we apply model selection techniques as the suscepti-
bility of different antibiotic-pairs are best modeled by
different distributions over time. Experimental results
confirmed that we can make better predictions when
these model selectors involve the previous year’s pre-
dictions. PYPER, especially PYPERed, proved to
be effective at increasing the number of antibiotic-
bacteria predictions that can predicted within five sus-
ceptibility percents of the actual susceptibility per-
cent. Depending on if one or three years is pre-
dicted into the future, the percent of useable predic-
tions PUP for PYPERed is between 91.91 and 86.75
percent, respectively. In Figure 3, the absolute errors
|p −a| of linear regression, polynomial regression,
linear SVR, and Gaussian SVR are shown for Es-
cherichia coli when predicting 2015 using data from
the prior nine years.
Even when the model with the smallest absolute
error |p−a| is chosen for each individual antibiotic-
bacteria pair, not all of the pairs can be predicted
within five susceptibility percent of the actual mean
susceptibility percent. This upper bound for PUP
is highly dependent on the number of years into the
future being predicted, ranging from 90.38 percent
when predicting three years ahead to 96.09 percent
when predicting one year ahead. Beyond that, there
are pairs where PYPERed selected a model with an
absolute error |p − a| greater than five when there
is another model with less error. Analyzing both
of these scenarios, the antibiotic-bacteria pairs that
are not predicted well can be sorted into three non-
exclusive categories: (1) the bacteria are known to
be resistant to that antibiotic, (2) there are not many
data points for that antibiotic-bacteria pair, and (3)
a change in CLSI guidelines caused a very sudden
change in susceptibility.
The most common reason that antibiotic-bacteria
pairs has an absolute error |p −a| greater than five
susceptibility percent is that the antibiotic is known
not to be effective in treating the bacterial infection.
For instance antibiotics in the fluoroquinolone and
macrolides families were repeatedly parts of pairs that
were not predicted correctly. While also part of other
incorrectly predicted pairs, these antibiotics were fre-
quently predicted badly when paired with any one of
the three Staphylococcus aureus bacteria to which it
is known to be frequently resistant. Ampicillin is also
not used to treat Staphylococcus aureus infections be-
cause of high prevalence of resistance. Thus, not sur-
prisingly, when paired with MSSA, ampicillin boasts
the largest absolute error |p −a| of all pairs when
the target year Y is 2015. Nitrofurantoin, to which
Klebsiella ssp, Enterobacter ssp, and Pseudomonas
ssp are known to be resistant, is involved in multiple
pairs that cannot be predicted well. As these antibi-
otics are not being used to treat infections caused by
these bacteria, it is not as important for final medical
treatment if we can predict the future susceptibility of
these antibiotic-bacteria pairs within five susceptibil-
ity percents.
The second cause for inaccurate predictions is a
lack of data points each year. In particular, this is an
issue for Stenotrophomonas maltophilia and Acineto-
bacter baumannii. There are only three antibiotics
tested against Stenotrophomonas maltophilia that met
the minimum cleaning criteria. The two of these an-
tibiotics with fewest data points are also not consid-
ered generally effective at treating infections caused
by Stenotrophomonas maltophilia, demonstrating the
non-exclusive nature of these three categories. While
there are 16 pairs involving Acinetobacter bauman-
nii, some of them only just passed the minimum data
point requirement for each year. Depending on year
predicted and number of years into the future pre-
dicted, up to half of the pairs involving Acinetobacter
baumannii had predictions where the absolute error
|p −a| was greater than five susceptibility percent.
This lack of data points is a particular problem
when predicting for target year 2013 due to the com-
bination of fewer cleaning requirements and less re-
liable data in prior years. More rigorous clean-
ing strategies could remove these antibiotic-bacteria
HEALTHINF 2018 - 11th International Conference on Health Informatics
112
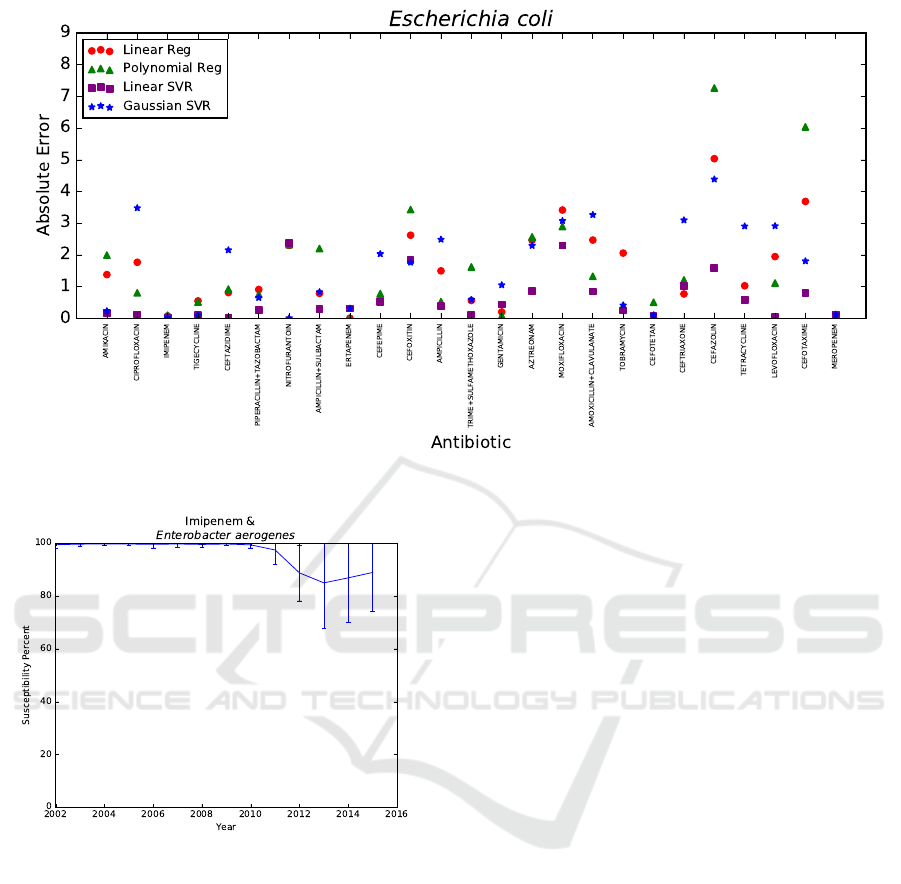
Figure 3: Absolute error |p−a| of Escherichia coli using data from 2006−2014 to predict 2015.
Figure 4: Mean susceptibility percent over time.
pairs. However, that cleaning would also remove
pairs that can be predicted well despite having fewer
data points in certain years, particularity given the
fluctuation of data points for some pairs over time.
As such, we simply recommend acknowledging that
models created with fewer data points should not be
expected to perform as well as models created with
more data points.
Lastly, there are a few antibiotic-bacteria pairs
with sudden changes in susceptibility percent due
to CLSI guidelines changes that a model based on
prior data could not anticipate. This is the reason
that important antibiotic-bacteria pairs, namely, En-
terobacter aerogenes with carbapenems meropenem
and imipenem, are not always predicted within five
susceptibility percent of the actual mean susceptibil-
ity of year Y. To demonstrate, Figure 4 contains the
actual mean susceptibility percents a with standard
deviation of the antibiotic-bacteria pair imipenem and
Enterobacter aerogenes from 2002 to 2015. CLSI
guidelines changed from 2010 to 2013, resulting in
universal decreased susceptibility rates for carbapen-
ems (Rennie and Jones, 2014). This change in CLSI
guidelines explains the sudden observed decrease in
susceptibility percent and the varied adherence to
these new guidelines explains the sudden increase in
standard deviation after 2010 for Enterobacter aero-
genes and imipenem, as seen in Figure 4. Thus, by
monitoring changes in CLSI guidelines, it is possible
to anticipate certain antibiotic-bacteria pairs that may
not be able to be predicted reliably.
While we are not able to predict all antibiotic
pairs within five susceptibility percent of the actual
mean susceptibility percent a, we are able to spec-
ify whether to trust a prediction based on the an-
tibiotic’s effectiveness at treating the bacterial in-
fection, the number of data points, and changes in
CLSI guidelines. In particular, predictions involving
Stenotrophomonas maltophilia, Acinetobacter bau-
mannii, fluoroquinolones,macrolides, and nitrofuran-
toin should be considered with some caution. How-
ever, even without further measures, our proposed
model selection technique PYPERed is still able to
predict over 90 percent of the 239 antibiotic-bacteria
pairs within five susceptibility percent when predict-
ing one year ahead.
Predicting Future Antibiotic Susceptibility using Regression-based Methods on Longitudinal Massachusetts Antibiogram Data
113

5 CONCLUSIONS
Our experiments revealed that the 239 antibiotic-
bacteria pairs in our cleaned dataset follow a different
distribution over time. The SVR methods are better at
making predictions of the susceptibly three years into
the future. However, linear regression, linear SVR,
and Gaussian SVR are all very close when predict-
ing the next two years of susceptibility. However,
given the different distributions of antibiotic-bacteria
pairs over time, model selection techniques utilizing
the previous year’s predictions are shown to generate
more reliable predictions for the target year. As we
have identified the reasons our models are not always
able to predict future susceptibility well, we increase
our confidence in the remaining predictions.
These predictions can be used to treat patients un-
til the antibiograms from the previous year are col-
lected and to prepare for future years. In particu-
lar, these results are useful for tertiary care facilities
and long term care facilities in Massachusetts that re-
ceive patients from a wide catchment area. Addition-
ally, state epidemiologists and drug companies can
use these predictions to guide policies, research, and
drug development for upcoming years. While these
aggregated predictions are of limited use to individ-
ual facilities as each facility can observe unique re-
sistance patterns, the methodology can be applied to
local data to develop more targeted predictions.
Given the magnitude of antibiotic resistance
data, we will continue to explore the Massachusetts
statewide antibiogram dataset. Our next steps in-
volve the design of new and the refinement of existing
model selection strategies to improve prediction abil-
ity as well as the exploration of the prediction abilities
of additional machine learning methods.
ACKNOWLEDGEMENTS
This work is supported by WPI and the US Depart-
ment of Education P200A150306: GAANN Fellow-
ships to Support Data-Driven Computing Research.
We thank Dr. Jian Zou, Tom Hartvigsen, Olga Poppe,
and Caitlin Kuhlman at WPI, Matthew Tlachac at
University of Minnesota, and Alfred DeMaria at
MDPH for their input on this work. We thank the
DSRG community at WPI for providing a stimulating
research environment.
REFERENCES
Anderson, D., Miller, B., Marfatia, R., and Drew, R. (2012).
Ability of an antibiogram to predict Pseudomonas
Aeruginosa susceptibility to targeted antimicrobials
based on hospital day of isolation. Infection Control
& Hospital Epidemiology, 33(6):589–593.
Bureau of Infectious Disease and Laboratory Sciences
(2016). 2015 statewide antibiogram report. Accessed
24 Jan 2017.
CDC (2013). Antibiotic resistance threats in the United
States, 2013. Accessed 19 Jul 2017.
Crnich, C., Safdar, N., Robinson, J., and Zimmerman, D.
(2007). Longitudinal trends in antibiotic resistance in
US nursing homes, 2000-2004. Infection Control and
Hospital Epidemiology, 28(8):1006–1008.
Hastey, C., Boyd, H., Schuetz, A., Anderson, K., Citron,
D., Dzink-Fox, J., Hackel, M., Hecht, D., Jacobus,
N., Jenkins, S., Karlsson, M., Knapp, C., Koeth, L.,
Wexler, H., and Roe-Carpenter, D. (2016). Changes in
the antibiotic susceptibility of anaerobic bacteria from
2007-2009 to 2010-2012 based on CLSI methodol-
ogy. Anaerobe, 42:27–30.
James, G., Witten, D., Hastie, T., and Tibshirani, R. (2013).
An Introduction to Statistical Learning with Applica-
tions in R. Springer-Verlag, New York, 1 edition.
Lagace-Wiens, P., Adam, H., Low, D., Blondeau, J., Bax-
ter, M., Denisuik, A., Nichol, K., Walkty, A., Kar-
lowsky, J., Mulvey, M., Hoban, D., and Zhanel, G.
(2013). Trends in antibiotic resistance over time
among pathogens from Canadian hospitals: Results of
the CANWARD study 2007-11. Journal of Antimicro-
bial Chemotherapy, 6:i23–i29.
Moore, D. (2007). The Basic Practice of Statistics. WH
Freeman, New York, 4 edition.
Rennie, R. and Jones, R. (2014). Effects of breakpoint
changes on carbapenem susceptibility rates of en-
terobacteriaceae: Results from the SENTRY antimi-
crobial surveillance program, United States, 2008 to
2012. Canadian Journal of Infectious Diseases and
Medical Microbiology, 25(5):285–287.
Smola, A. and Scholkopf, B. (2004). A tutorial on sup-
port vector regression. Statistics and Computing,
14(3):199–222.
Ventola, L. (2015). The antibiotic resistance crisis. Phar-
macy and Therapeutics, 40(4):277–283.
WHO (2014). Antimicrobial resistance global report on
surveillance 2014. Accessed 11 Jul 2017.
Yang, H. and King, L. (2009). Localized support vector re-
gression for time series prediction. Nuerocomputing,
72(10-12):2659–2669.
HEALTHINF 2018 - 11th International Conference on Health Informatics
114
