
Experiences with Publicly Open Human Activity Data Sets
Studying the Generalizability of the Recognition Models
Pekka Siirtola, Heli Koskim¨aki and Juha R¨oning
Biomimetics and Intelligent Systems Group, P.O. BOX 4500, FI-90014, University of Oulu, Oulu, Finland
Keywords:
Human Activity Recognition, Accelerometer, Open Data Sets, Cross-validation.
Abstract:
In this article, it is studied how well inertial sensor-based human activity recognition models work when
training and testing data sets are collected in different environments. Comparison is done using publicly open
human activity data sets. This article has four objectives. Firstly, survey about publicly available data sets
is presented. Secondly, one previously not shared human activity data set used in our earlier work is opened
for public use. Thirdly, the genaralizability of the recognition models trained using publicly open data sets
are experimented by testing them with data from another publicly open data set to get knowledge to how
models work when they are used in different environment, with different study subjects and hardware. Finally,
the challenges encountered using publicly open data sets are discussed. The results show that data gathering
protocol can have a statistically significant effect t o the r ecognition rates. In addition, it was noted that often
publicly open human activity data sets are not as easy to apply as they should be.
1 INTRODUCTION
Human a ctivity recognition using inertial sensors, es-
pecially using ac celerometers, has become one of the
most studied area of pattern recognition. One rea-
son for this is that activity recognition can be app-
lied to many different types of application, including
health and fitness monitor ing; personalized adverti-
sing; smarthomes that anticipates the user’s needs;
and self-managing system that adapts to user’s acti-
vities (Lockhart et al., 2012).
Often, the mo dels for activity recognition are user-
indepen dent. This is challenging as people are dif-
ferent, a nd therefore , a user-independent recognition
model that provides accurate recognition results for
one person does n ot n ecessary provide as high results
for other person (Albert et al., 2012). In the article the
reason for this was that recognition models were trai-
ned with healthy study subjects and tested with su b-
jects with difficulties to move. Differences between
persons are not the only thing that cause variation to
the recognition results. In fact, it has been shown that
a model that works in one environment may provide
totally different results when used in other environ-
ment. In Ermes et. al. (Ermes et al., 2008 ) it was
studied how the recognition r ate decreases when data
is collected with and without guidance. In th e study,
a activity recogn ition model was trained to recognize
nine different sports/everyday activities and when it
was tested using data collected with guidance, the re-
cognition rate was 91%. When the same model was
tested using data collected without guidance, inclu-
ding four out o f nine trained activities, the average
recogn ition rate was only 64%. There are many pos-
sible reasons for this phenomena as several things in
the environment can have an effect to the reco gnition
rates, these inclu de changes in weather, terra in and lo-
cation that can cause p roblems to recognition models.
In addition, in the real-life many other unseen contin-
gencies can happe n and the data set used to train the
recogn ition models cannot include all of these. Most
importantly, the study sh ows that data gathering pro-
tocol has an effect to the collec te d data, and therefore,
to the trained models and recognitio n r ates. Thus, to
get better knowledge how well the trained mod e ls ac-
tually work in different situations, it is important to
validate them using data gathere d by different study
subjects but also collected in different environment
and sensors.
In some of the studies, the validation of the a ccu-
racy of the recognition models in different environ-
ments ha s been done by implementing the trained mo-
dels to mobile phone application and then used real-
time real-life situations (Shoaib et al. , 2014; Siirtola
and R¨onin g, 2013). In these cases, the validation data
may include contingencies that are not included in the
training data but the environment where the data are
gathered does not change a lot as for instance it is
Siirtola, P., Koskimäki, H. and Röning, J.
Experiences with Publicly Open Human Activity Data Sets - Studying the Generalizability of the Recognition Models.
DOI: 10.5220/0006553302910299
In Proceedings of the 7th International Conference on Pattern Recognition Applications and Methods (ICPRAM 2018), pages 291-299
ISBN: 978-989-758-276-9
Copyright © 2018 by SCITEPRESS – Science and Technology Publications, Lda. All rights reserved
291

normally collected in the same country as the trai-
ning data. However, open data sets can be seen as
a solution to this problem: by testing the trained mo-
dels using them, it is possible to get knowledge how
models work in different environment, with different
study subjects and hardware. This approach obvi-
ously ha s advantages compared to implementing the
trained models to a physical device as it saves time
because a sep a rate validation data session is not nee-
ded.
In this stu dy inertial sen sor-based human activity
recogn ition is studied using publicly open data sets.
Study has following aims:
1. to survey wha t kind of open data sets are available
2. on e previously no t shared hum an ac tivity data set
used in our earlier work is opened for public use
3. experiment how accurately the models trained
using a one open data set work when they are va-
lidated with other open d a ta set
4. the challenges encountered u sing publicly open
data sets are d iscussed.
The paper is organized as follows: Section 2 gi-
ves a brief survey about publicly open data sets and
Section 3 exp la in which are the ones selected for this
study. Section 4 introduces the used methods and
describes the experimental protocol while Section 5
shows the results and discusses about them. Finally,
the c onclusions are in Section 6.
2 OPEN HUMAN ACTIVITY
DATA SETS
There are various open human activity data sets col-
lected using inertial sensors available. In fact, we
found 15 different open data sets. In a ddition, we
made one of our own data set open, th is data set was
used in Siirtola & R¨oning (Siirtola and R¨oning, 2012)
and can now b e en found from our research units we-
bpage (Biom imetics and Intelligen t Systems Group,
2017). Most of the other d ata sets can be found at the
UCI Machine Learning Repository (Lich man, 2013).
Open data sets and some of their characteristics are
listed in Table 1. Some of these included also data
from other sensors than inertial sensors, but they are
not listed in the table.
While several open data sets a re available, compa-
ring and c ross-validating them is not straightforward
as data sets d iffer from eac h other in many ways as
it can be seen from Table 1. For instance, sensor
position is not the same in all data sets. The most
common sensor p ositions are wrist, chest and hip but
also senso r positions are used such as trouser’s poc-
ket, foot and back. The problem is that from each
of these body position the gathered data is different
meaning that if the recognition model is trained using
data from one body p osition, it cannot rec ognize acti-
vities if the sensor is positioned in some o ther posi-
tion (Siirtola, 2015). Moreover, one of the challenges
of the open data sets listed in Table 1 is that the used
sampling rate is not always the same. The sampling
rate varies from 20Hz to 200Hz and the most com-
monly used frequ ency is 50Hz. Again, this makes the
cross-validation of the data sets more ch allenging as
the data sets used in model training, testing and vali-
dation needs to have the same sampling rate to obtain
reliable model and results. What also limits the num-
ber of data sets that ca n be in cross-validation is that
almost all data sets are collected from different acti-
vities. Most of the data sets are collected f rom daily
activities like walking, running , sitting and standing
while some concentrate for instance on sports activi-
ties. This limits the using of data sets as in order to
use cross-validate data sets, they need to contain same
activities. Easily the most common activity is wal-
king, which is included in almost all data sets. Ho-
wever, the de finition of walking differs from data set
to data set: in some of the data sets walking, walking
downstairs and walking downstairs are c onsidered as
three different ac tivities as in some data sets they all
have the same label. One mor e difference in data sets
is that the number of study subjects varies from one
person to 30 persons. Therefore, it is clear that some
data sets have more variation th an others.
However, based on the information shown in the
Table 1 it is not possible to c onclude which data set
is the best as for instance the numbers do not tell how
much data pe r activity these data sets inclu de and how
much variability they include. This means that mo-
del tra ined and tested using one data set and proving
highly accurate results, does not necessarily provide
as high results when it is tested using another data
set which is collected using different sensors, in diffe-
rent environment, and by giving different instructions
given to study subjects. In fact, the purpose of this
study is to exp eriment how the model accuracy chan-
ges when it is tested using th e data from the same data
set compared to when it is tested using different open
data set.
3 EXPERIMENTAL DATA SETS
All the open data sets listed in Table 1 were not
used in cross-validation process as in order to cross-
validate data sets they need to have the same sam-
ICPRAM 2018 - 7th International Conference on Pattern Recognition Applications and Methods
292

Table 1: List of publicly open human activity data sets collected using inertial sensors.
Author Body posi-
tion
Frequency Activities Inertial sen-
sors
Study
subjects
(Shoaib et al., 2014) trouser’s
pocket, arm,
wrist, belt
50Hz walking, running, stan-
ding, sitting, cycling
and walking upstairs
and downstairs
accelerometer,
gyroscope,
magnetometer
7
(Anguita et al., 2013) waist 50Hz walking, walking up-
stairs, walking down-
stairs, si tting, standing,
laying
accelerometer,
gyroscope
30
(Siirtola and R¨oning, 2012) trouser’s
pocket
40Hz walking, running, cy-
cling, idling, driving
car
accelerometer 7
(Banos et al., 2015) chest, w rist,
ankle
50Hz 12 activities, including
walking, running, cy-
cling and sitting
accelerometer,
gyroscope,
magnetometer
10
(Casale et al., 2012) chest 52Hz 7 activities including
walking, standing and
walking at stairs
accelerometer 15
(Stisen et al., 2015) waist, arm 50-200Hz biking, sitting, stan-
ding, walking, stair up
and stair down
accelerometer 9
(Koskim¨aki and Siirtola,
2014)
arm 100Hz 36 gym activities accelerometer 1
(Barshan and Y¨uksek, 2014) chest 25Hz 19 activities including
sitting, standing, wal-
king, running, cycling
accelerometer,
gyroscope,
magnetometer
8
(Bruno et al., 2013) wrist 32Hz 14 activities including
brush teeth, climb
stairs, comb hair,
descend stairs and
walking
accelerometer 16
(Reiss and Stricker, 2012) wrist, chest,
ankle
100Hz 18 activities including
lying, sitting, standing,
walking, running, cy-
cling
accelerometer,
gyroscope,
magnetometer
9
(Kwapisz et al., 2011) trouser’s
pocket
20Hz walking, jogging, up-
stairs, downstairs, sit-
ting, standing
accelerometer 29
(Zhang and Sawchuk, 2012) hip 100Hz 12 activities including
walking, running, up-
stairs, downstairs, sit-
ting and standing
accelerometer,
gyroscope,
magnetometer
14
(Chavarriaga et al., 2013) wrist, chest,
limb, shoul-
der, foot
30Hz groom room, prepare
and drink coffee, pre-
pare and drink sand-
wich, cleanup
accelerometer,
gyroscope,
magnetometer
12
(Ba˜nos et al., 2012) left and right
calf and
thigh, back,
4 on arms
50Hz 33 activities including
walking, running, jum-
ping and cycling
accelerometer,
gyroscope,
magnetometer
17
(Micucci et al., 2017) trouser’s
pocket
50Hz 9 activities including
walking, running, up-
stairs and downstairs
accelerometer 30
(Ugulino et al., 2012) waist, tight,
arm, ankle
50Hz walking, standing, sit-
ting, sitting down, stan-
ding up
accelerometer 4
Experiences with Publicly Open Human Activity Data Sets - Studying the Generalizability of the Recognition Models
293

pling ra te and activities and they need to be collected
from the same body position. However, the number
of study subjects does n ot need to be the same. It was
decided to cross-validate data sets from two body po-
sitions: trouser’s pocket and wrist. Trouser’s pocket
was chosen as one of the studied position as according
to some studies it is the most common po sition for a
phone (Ic hikawa et al., 2005). In addition, wrist was
chosen as other position as smartwatches and wrist-
worn activity monitors are proba bly the most obvious
devices to implement activity recognition algorithms.
From the both chosen body position two data sets
were selected for this study. Three of the data sets in-
troduced in Table 1 contain data gathered f rom trou-
ser’s pocket: Kwapisz et. al. (Kwapisz et al., 2011),
Siirtola & R¨oning (Siirtola and R¨oning, 2012) and
Shoaib et. al. (Shoaib et al., 2014). The activities we
are aiming to recognize are walking, running, idling
(=sitting and standing) and cycling. As Kwapisz et.
al. does not inc lude cycling -activity, cross-validation
is performed using two data sets: Siirtola & R¨oning
(Siirtola and R¨oning, 2 012) and Shoaib et. al. (Shoaib
et al., 2014 ). In turn, one is used for training and ot-
her for validation. Th e problem with the selected data
sets is that they are collected using different sampling
rates, 40Hz and 50Hz, respectively. As the greate st
common factor of 40 and 50 is 10, the data sets are
down sampled to 10Hz. With Siirtola & R¨oning (Si-
irtola and R¨oning, 2012) this is done by taking only
every fourth observation into consideration, and in the
case of Shoaib et. al. (Shoaib et al., 201 4) by taking
only every fifth observation into consideration.
Several data sets contained data gathered from
wrist, and the ones chosen for this study were Sho-
aib et. al. (Shoaib et al., 2014), Banos et. al.(Banos
et al., 2015). These were selected as they have the
same sampling rate and also several common activi-
ties: walking, running, cycling, sitting, standing, and
walking at stairs. Again, in the cross-validation pro-
cess one data sets in turn is used for training a nd other
for validation.
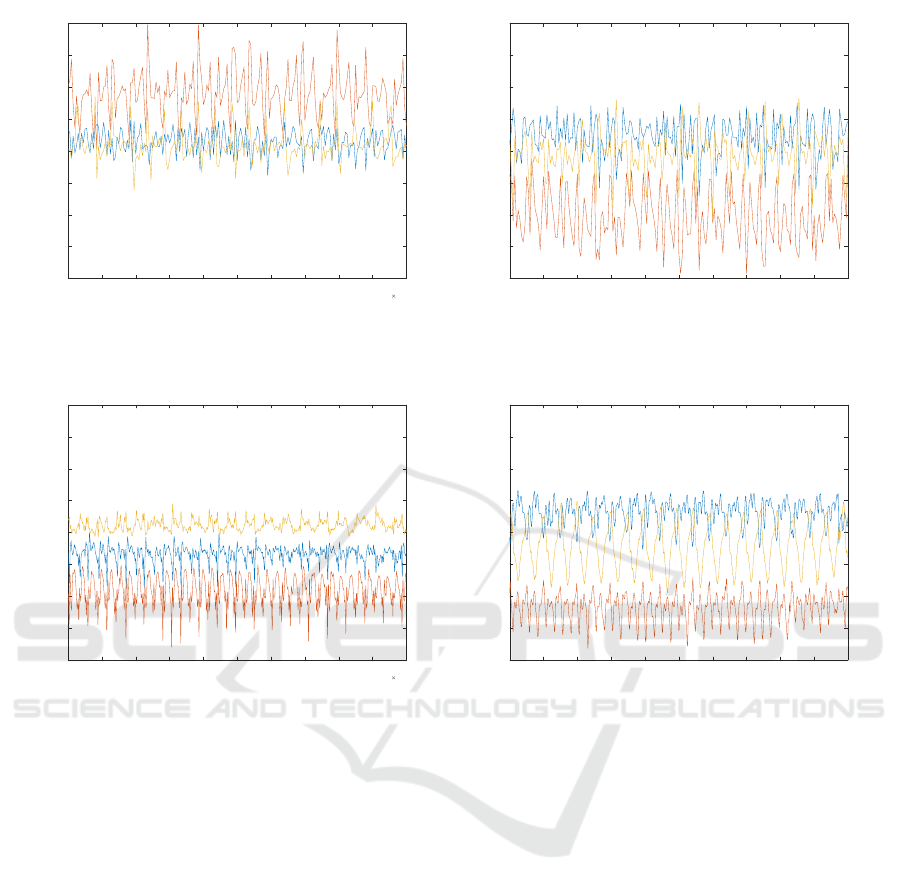
Examples from the selected data sets are shown
in Figures 1, where 10 seconds of acceleration data
from walking signal is presented. From these figures
it can be seen that the scale of acceleration signal is
approximately the same in all data sets. However, the
compariso n of signals collected from trouser’s pocket
(Figures 1(a) & 1(b)) show that signals are on diffe-
rent level. T his is mo st likely due to a fact that sensor
can lay on the pocket in a numero us different orien -
tations. Therefore, in the pre-processing stage the
effect of orientation was eliminated by square sum-
ming acceleration channels to obtain the magnitude
acceleration signal, which is orientation inde pendent.
Wrist-position is more stable than pocket, as there is
basically only one possible way to wear the sensor,
and therefore the orientation of the sensor should be
approximately same for each study subje ct wearing
the sensor in the same wrist. However, visualization
(Figures 1(c) & 1(d)) o f the data sets collected from
wrist and selected for this study show that sensors
used in Shoaib et. al. (Shoaib et al., 2014) and Ba-
nos et. al. (Banos e t al., 2015) have been different.
Apparen tly the orde r of acceleration sensors has been
different in these sensors, and therefore, x-axis accele-
ration of Banos et. al. behaves like z-axis acceleration
of Shoaib et. al.. This was simply fixed by changing
the same order for both data sets but this difference
shows that it is not always that straightforward to use
publicly open data sets.
4 ACTIVITY RECOGNITION
PROCESS
Activity recognition process is divided into three main
phases (data collectio n, training and activity recogni-
tion), and each of these can be divided into subphases
(Incel et al., 2013), see Figure 2. In this section, it
is explained what methods this study uses in different
stages.
Activity recognition was done using a sliding win-
dow technique. The signals from the sensors were di-
vided in to equal-sized smaller sequences, also called
windows. Window size of 2.0 seco nds was used with
every data set.From these windows, features were ex-
tracted and finally the classification of the sequenc es
was done using models trained based on these featu-
res. The fea tures used in this study included for in-
stance standard deviation, minimum, maximum, me-
dian, and different percentiles (10, 25 , 75, and 90).
Moreover, the sum of values above or below percen-
tile (10, 2 5, 75, and 90), square sum of values above
of below percentile (10, 25, 75, and 90), and number
of crossings above or below per centile (10, 2 5, 75,
and 90) were extracted and used as features. Altoget-
her 61 f e atures were extracted. These same features
are used for instance in Siirtola et. al. (Siirto la et al.,
2016).
In order to achieve the highest possible recogni-
tion rates, the most descriptive features for each mo-
del were selected using a sequential forward selection
(SFS) method (Devijver and Kittler, 1982). Mo reo-
ver, to reduce the number of misclassified windows,
the final classification was done based on the ma jo-
rity voting of th e classification results of three adja-
cent windows. T herefor e, when an activity changes, a
new activity can be detected when two adjacent win-
ICPRAM 2018 - 7th International Conference on Pattern Recognition Applications and Methods
294
1.34 1.342 1.344 1.346 1.348 1.35 1.352 1.354 1.356 1.358 1.36
10
4
-20
-15
-10
-5
0
5
10
15
20
(a) Example from data set Siirtola & R¨oning (Siirtola and
R¨oning, 2012) where the position of the sensor is trouser’s
pocket.
600 620 640 660 680 700 720 740 760 780 800
-20
-15
-10
-5
0
5
10
15
20
(b) Example from data set Shoaib et. al. (Shoaib et al., 2014)
where the position of the sensor is trouser’s pocket.
2.9 2.91 2.92 2.93 2.94 2.95 2.96 2.97 2.98 2.99 3
10
4
-20
-15
-10
-5
0
5
10
15
20
(c) Example from data set Banos et. al. (Banos et al., 2015)
where the position of the sensor is wrist.
3000 3100 3200 3300 3400 3500 3600 3700 3800 3900 4000
-20
-15
-10
-5
0
5
10
15
20
(d) Example from data set Shoaib et. al. (Shoaib et al., 2014)
where the position of the sensor is wrist.
Figure 1: 3D acceleration data (blue = x-axis, red = y-axis, and yellow = z-axis) from the each selected data set describing 20
seconds of walking signal.
dows are classified as a new activity.
It was decided to do the experim ents using LDA
(linear discriminant analysis) and QDA (quadratic
discriminant analysis (Hand et al., 2001)) classifier as
in our previous studies (Siirtola and R¨o ning, 2012; Si-
irtola and R¨oning, 2013) we have noticed that they are
not only a c curate but also computationally light, and
therefore, sufficient to be implemented to smartpho-
nes an d used 24/7. In addition, th ey are fast to train.
LDA is used to find a linear combina tion of features
that separate th e classes best. The resulting combi-
nation may be employed as a linear classifier. QDA
is a similar method, but it uses quadratic surfaces to
separate classes (Hand e t al., 2001).
In the last stage of activity recognition pr ocess,
using the trained recognition model, an unknown stre-
aming signal can be classified. Before its class label
can be defined, new signal must be processed in the
same way as training data was processed when re-
cognition models were trained, see Figure 2. Th e-
refore, at first, streaming data is pre-processed and
windowed. Then, the f eatured used to train the mo-
del are extracted from the window and these are given
as inp ut to the trained recognition model to obtain the
predicted activity class. Note that when new data is
classified, in each stage, the same parameters must
be used that were used to train th e mod els (Bishop,
2006).
5 EXPERIMENTS AND
DISCUSSION
For the experim ents model training is performed
using protocols presented in Figure 3 using separate
training, validation and testing data sets. Figure 3(a )
shows the protocol used and how the da ta is divided
when the same publicly open data set is used for trai-
ning and testing, one person’s data in tu rn is used for
Experiences with Publicly Open Human Activity Data Sets - Studying the Generalizability of the Recognition Models
295
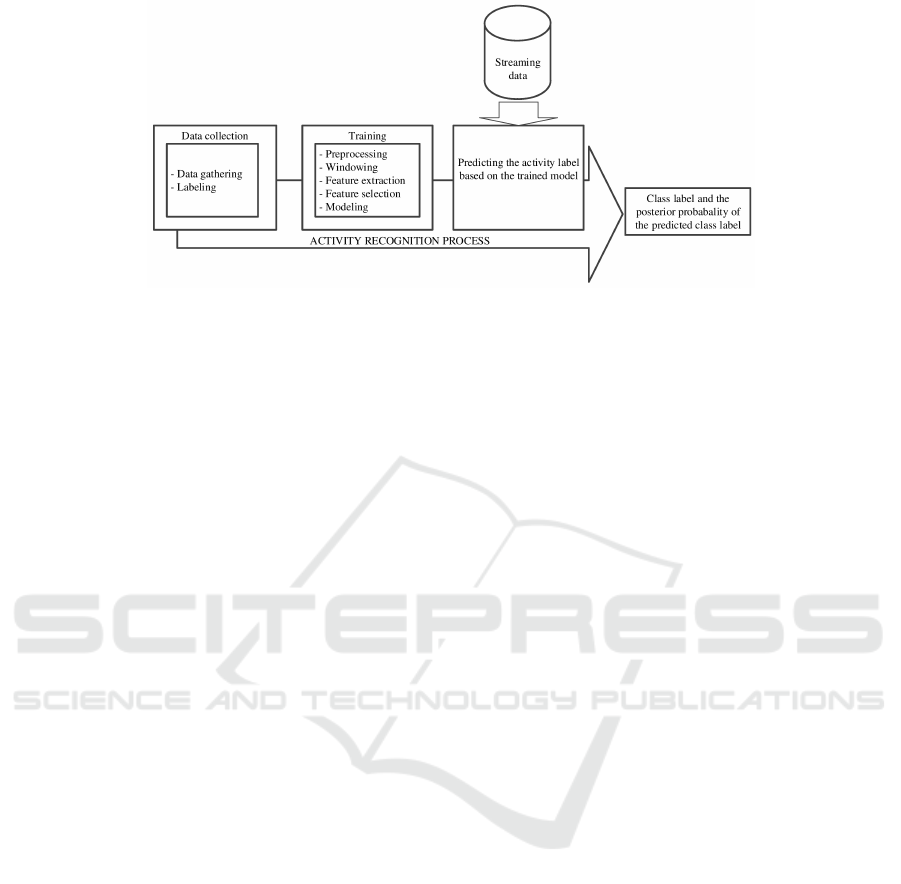
Figure 2: Activity recognition process is divided into three main phases, and each of these can be divided into subphases
(Incel et al., 2013).
testing and other fo r training. Therefore, the same
data is never used for training and testing. Figure 3(b)
shows the protocol used when the one publicly open
data set is used for model training and other for tes-
ting.
The r e sults of the experiments using tr ouser’s poc-
ket and wrist as a sensor position are shown separately
for each study subject in Table 2 and 3, respectively.
The accuracies were obtained by calculating true po-
sitive rate of each cla ss and by calculating average of
these. T he results show that in general QDA produces
better results than LDA. T herefor e, it was concentra-
ted on analyzing QDA results.
When the results of data from trouser’s pocket
(Table 2) are studied, it can be seen tha t the recog-
nition accuracy is a bit higher when the recognition
model is train ed and tested using a data from the same
data set compared to training model with one data
set and testing it with other. While this result came
as no surprise, the difference was smaller than ex-
pected. The reason for this can be the small number
of activities (4) studied in this sensor position. There-
fore, the samples from different activities c a n locate
in the very different parts of the feature space making
task q uite easy and differences between data gather-
ing protocols, sensors, study subjects and other fac-
tors do not have that big of an effect to the recogni-
tion rates. Though the difference does not seem big,
still according to the paired t-test the difference is sta-
tistically significant in three cases out of four, only
when Siirtola data is used for testing and classifica-
tion is based on QDA classifier th e difference is not
statistically significant.
The data from a wrist-worn sensor included more
activities (6) than data from trouser ’s pocket, making
it mo re difficult to classify. Therefor e , also the results
had more variance. This scenario was experimented
using data sets from Banos et. al. (Banos et al.,
2015) and Sh oaib et. al. (Shoaib et al., 2014). When
Shoaib data set was classified u sin g a model trained
using Banos data, th e accuracy using QDA was 5 per-
centage units lower (86.6% vs. 81.2%) compared to
training and testing model u sin g data from one data
set. However, when the experiment was pe rformed
other way around, meaning that Banos data set was
classified using models trained with Shoa ib data, the
difference was over 13 percentag e units (95.4% vs.
82.3%). Therefore, while using Banos data is cross-
validated using leave-one-out method the recognition
accuracy is almost perfe ct ( 95.4%), and the rate is no-
ticeable lower when a recognition model trained using
Banos data is tested with Shoaib data (8 1.2%). This is
not the case with Shoaib data (86.6% vs. 82. 3%), and
therefore, the rec ognition rates and models obtained
using Shoaib data for training are more predictable
and their generalizability is better than the ones trai-
ned using Banos da ta . Also this time, according to the
paired t-test the difference is statistically significant in
three cases out of four. Only when Banos data is used
for testing and the classification process is performed
using LDA classifier, the different is not statistically
significant.
The r e sults of Table 3 show that the data collection
protocol has been different between the data sets and
the end result is that Banos data set has less variation
than Shoaib. On th e other hand, this was not neces-
sarily the only reason for the obtained r esults as these
data sets had othe r differences as well, as shown in
Figure 1. It was noted that the order of the three acce-
leration signals was different in these data sets and
it was fixed in the pre-proc e ssing stage, as explained
in Sectio n 3. T his shows a challenge regar ding u sin g
open data sets, they are not always usable out-of-the-
box. In fact, it would be really beneficial to the re-
search area to further study publicly open data sets
to find d ifferences like th is and report them . In addi-
tion, a brief study of other data sets showed also other
differences between data sets which makes validation
ICPRAM 2018 - 7th International Conference on Pattern Recognition Applications and Methods
296
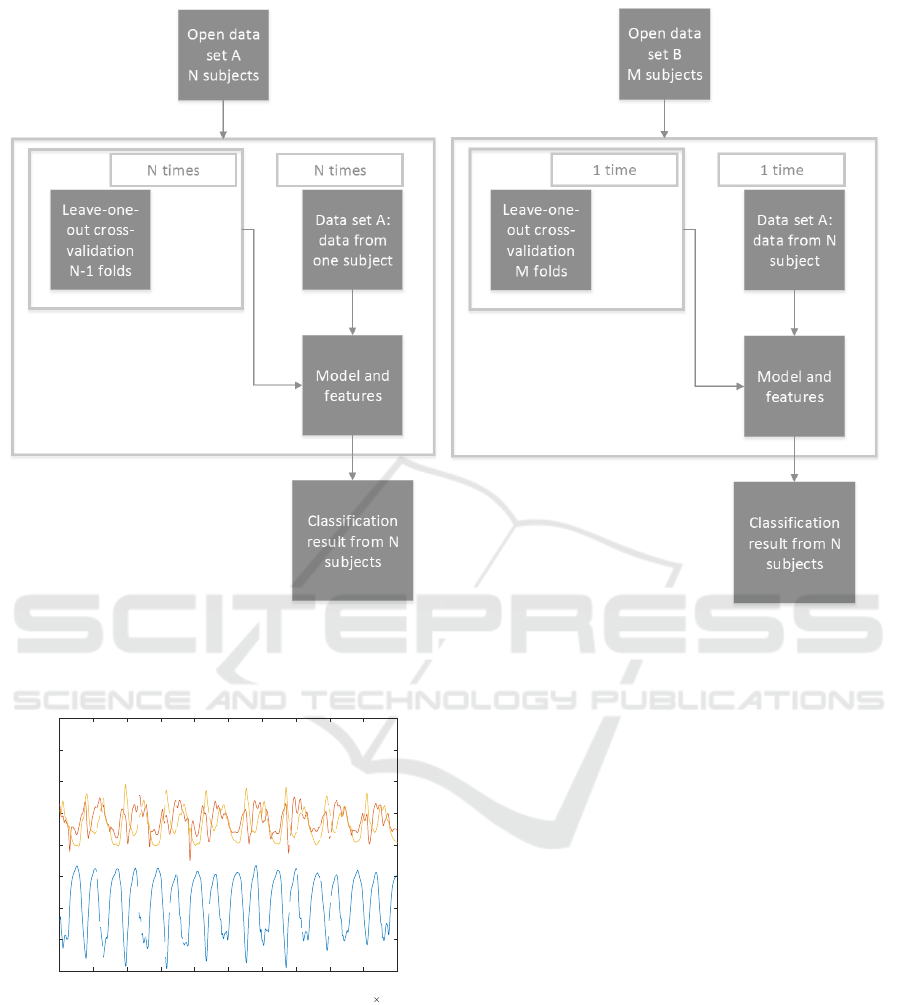
(a) The model training protocol when the same data set is
used for training and validation.
(b) The model training protocol when the different data set is
used for training and validation.
Figure 3: Protocols used in the experiments.
2.3 2.301 2.302 2.303 2.304 2.305 2.306 2.307 2.308 2.309 2.31
10
5
-20
-15
-10
-5
0
5
10
15
20
Figure 4: Walking signal from Reiss & Stricker (Reiss and
Stricker, 2012) is diff erent to signals from other studied data
sets.
of them burdensome. For instance, Anguita data set
(Anguita et al., 2013) had different scale for accele-
rometer values th a n the data sets u sed in this study.
With Anguita et. al. (Anguita et al., 2013) the unit for
accelerometer values is gr avity g when for the data
sets used in this study it is meters in second m/s
2
. We
also had problems with Reiss d ata (Reiss and Stric-
ker, 2012) when we tried to use it in wrist-sensor sce-
nario. When it was cross-validated using other data
sets, the re sults were r eally poor. The models did not
work at all. In Figure 4, ten seconds of walking sig -
nal from this data set is visualized. The visualization
shows that this data is totally different to those shown
in Figure 1. Most likely Reiss data is filtered, and
therefore, it can not be used with other da ta sets. In
addition, there are missing values which may have an
effect to recognition rates.
Therefore, as a summary : publicly open human
activity data sets have d ifference s which makes their
usage difficult. Some of these differences are easy
to fix, some hard or even inflexible. The worst sce-
nario is of course that there are differences that user
does not find out at all. Therefore, to make data set
usage more easy, guidelines for data gathering should
be made for the research area to obtain reusable data
sets as currently the data gathering proto cols can vary
so much between data sets that they cannot be used
together.
While in this study, the focus o f the study are pu-
blicly open human activity data sets, the observations
made he re are also valid in other ap plication fields as
Experiences with Publicly Open Human Activity Data Sets - Studying the Generalizability of the Recognition Models
297

Table 2: The results of the experiments using trouser’s pocket as a sensor position.
Test data: Shoaib data set, Classifier QDA
Training
S1 S2 S3 S4 S5 S6 S7 S8 S9 S10 Mean
Shoaib 96.3% 97.4% 92.7% 95.5% 93.1% 97.2% 95.6% 98.0% 96.5% 92.2% 95.4%
Siirtola
91.1% 94.6% 89.6% 93.2% 91.4% 91.9% 88.3% 91.3% 93.2% 89.1% 91.4%
Test data: Shoaib data set, Classifier LDA
Shoaib
90.4% 97.7% 92.0% 95.2% 92.1% 96.2% 93.6% 96.3% 96.0% 92.5% 94.2%
Siirtola
93.5% 94.7% 87.1% 92.0% 93.5% 91.2% 88.3% 90.8% 92.6% 86.2% 91.0%
Test data: Siirtola data set, Classifier QDA
Training
S1 S2 S3 S4 S5 S6 S7 S8 - - Mean
Siirtola 92.8% 91.0% 93.2% 90.3% 85.4% 94.7% 98.1% 92.6% - - 92.3%
Shoaib
89.7% 92.0% 94.8% 86.5% 85.7% 90.9% 93.7% 90.9% - - 90.5%
Test data: Siirtola data set, Classifier LDA
Siirtola
93.7% 90.9% 90.3% 95.0% 90.5% 99.1% 98.4% 96.1% - - 94.2%
Shoaib
86.8% 87.5% 87.0% 70.4% 82.7% 94.3% 90.0% 92.2% - - 86.4%
Table 3: The results of the experiments using wrist as a sensor position.
Test data: Shoaib data set, Classifier QDA
Training
S1 S2 S3 S4 S5 S6 S7 S8 S9 S10 Mean
Shoaib 79.6% 82.1% 91.3% 85.4% 82.2% 84.1% 97.2% 91.7% 88.2% 83.9% 86.6%
Banos
87.3% 81.8% 83.4% 83.3% 75.6% 79.0% 86.2% 82.4% 81.5% 71.7% 81.2%
Test data: Shoaib data set, Classifier LDA
Shoaib
85.1% 90.2% 91.8% 94.7% 92.3% 96.2% 97.3% 92.4% 91.0% 80.3% 91.1%
Banos
58.2% 73.5% 69.8% 61.7% 62.1% 70.8% 66.8% 52.4% 63.2% 56.5% 63.5%
Test data: Banos data set, Classifier QDA
Training
S1 S2 S3 S4 S5 S6 S7 S8 S9 S10 Mean
Banos 96.3% 97.4% 92.7% 95.5% 93.1% 97.2% 95.6% 98.0% 96.5% 92.2% 95.4%
Shoaib
73.8% 96.1% 75.0% 77.5% 79.6% 81.0% 83.8% 87.3% 85.9% 83.3% 82.3%
Test data: Banos data set, Classifier LDA
Banos
72.7% 68.6% 79.3% 84.2% 76.8% 80.5% 87.7% 93.4% 72.5% 85.6% 80.1%
Shoaib
66.2% 91.3% 65.8% 60.1% 75.9% 92.0% 95.2% 70.5% 82.5% 75.4% 77.4%
well: the recognition models should be tested with
data sets collected from different environments and
publicly open data sets should be easily reusable.
6 CONCLUSION
The origina l aim of this article was to survey an d
cross-validate publicly open iner tial sensor-based hu-
man activity data sets, and release one new for public
use, to see how a ccurately a model which is trained
using a data gathered in one environment and loca-
tion works when it is tested using a data gathered in a
totally different environment. This was experimented
in two different scenarios and the results of this article
show that data gathering environment, and protocol
has an effect to the results. The accuracies obtained
in a new environment are lower than from original en -
vironm ent, and acco rding to the paired t-test this dif-
ference is statistically significant in six cases out of
eight. In addition, it seems that the d ifference is the
bigger the more difficult the classification task is. Ho-
wever, eventually this was not the main outcome of
this article. Instead, the main outcome of this arti-
cle is that publicly open data sets are not easy and
straightfor ward enough to be used for validation pur-
poses. Several open inertial-based data sets are pu-
blicly available. However, cross-validation of them
is problematic as most of the data sets have different
activities, sampling rate, and body position. While
these differences are quite straightf orward to find out,
it was noticed that data sets have other differences that
are not as easy to detect. For instance it was noticed
that there were differences in sensor orientation and
scale of y-a xis. To avoid this, our future work inclu-
des a guide and code to get non-burdensom e access
to publicly o pen data sets. In addition, guideline s for
data gathering should be made for the research area to
obtain more easily reusable data sets.
ACKNOWLEDGMENT
The autho rs would like to tha nk Infotech Oulu for
funding this work.
We acknowledge collaboration with Tianjin Nor-
mal University related multisensor fusion technology,
wearable computing, machine learing and health care.
ICPRAM 2018 - 7th International Conference on Pattern Recognition Applications and Methods
298

REFERENCES
Albert, M., Toledo, S., Shapiro, M., and Kording, K. (2012).
Using mobile phones for activity recognition in par-
kinsons patients. Frontiers in neurology, 3:1–7.
Anguita, D. , Ghio, A., Oneto, L., Parra, X., and Reyes-
Ortiz, J. L. (2013). A public domain dataset for human
activity recognition using smartphones. In ESANN.
Ba˜nos, O., Damas, M., Pomares, H., Rojas, I., T´oth, M. A.,
and Amft, O. (2012). A benchmark dataset to eva-
luate sensor displacement in activity recognition. In
Proceedings of the 2012 ACM C onference on Ubiqui-
tous Computing, pages 1026–1035.
Banos, O., Villalonga, C., Garcia, R., Saez, A., Damas, M.,
Holgado-Terriza, J. A., Lee, S., Pomares, H., and Ro-
jas, I. (2015). Design, implementation and validation
of a novel open framework for agile development of
mobile health applications. Biomedical engineering
online, 14(2):S6.
Barshan, B. and Y¨uksek, M. C. ( 2014). Recognizing daily
and sports activities in two open source machine lear-
ning environments using body-worn sensor units. T he
Computer Journal, 57(11):1649–1667.
Biomimetics and Intelligent Systems G r oup (2017).
http://www.oulu.fi/bisg/node/40364. Accessed: 2017-
10-24.
Bishop, C. M. (2006). Pattern Recognition and Machine Le-
arning (Information Science and Statistics). Springer-
Verlag New York, Inc., Secaucus, NJ, USA.
Bruno, B., Mastrogiovanni, F., Sgorbissa, A., Vernazza, T.,
and Zaccaria, R. (2013). Analysis of human behavior
recognition al gorithms based on acceleration data. In
Robotics and Automation, 2013 IEEE International
Conference on, pages 1602–1607. IEEE.
Casale, P., Pujol, O., and Radeva, P. (2012). Personaliza-
tion and user verification in wearable systems using
biometric walking patterns. Personal and Ubiquitous
Computing, 16(5):563–580.
Chavarriaga, R., Sagha, H., Calatroni, A., Digumarti, S. T.,
Tr¨oster, G., Mill´an, J. d. R. , and Roggen, D. (2013).
The opportunity challenge: A benchmark database for
on-body sensor-based activity recognition. Pattern
Recognition Letters, 34(15):2033–2042.
Devijver, P. A. and Kittler, J. (1982). Pattern recognition:
A statistical approach. Prentice Hall.
Ermes, M., P¨arkk¨a, J., M¨antyj¨arvi, J., and Korhonen, I.
(2008). Detection of daily activities and sports with
wearable sensors in controlled and uncontrolled con-
ditions. IEEE transactions on information technology
in biomedicine, 12(1):20–26.
Hand, D. J., Mannila, H., and Smyth, P. (2001). Principles
of data mining. MIT Press, Cambridge, MA, USA.
Ichikawa, F., Chipchase, J., and Grignani, R. (2005).
Where’s the phone? a study of mobile phone location
in public spaces. In 2nd Asia Pacific Conference on
Mobile Technology, Applications and Systems, pages
1–8. IET.
Incel, O., Kose, M., and Ersoy, C. (2013). A review and
taxonomy of activity recognition on mobile phones.
BioNanoScience, 3(2):145–171.
Koskim¨aki, H. and Siirtola, P. (2014). Recognizing gym
exercises using acceleration data from wearable sen-
sors. In Computational Intelligence and Data Mining
(CIDM), 2014 IEEE Symposium on, pages 321–328.
IEEE.
Kwapisz, J. R., Weiss, G. M., and Moore, S. A. (2011).
Activity recognition using cell phone accelerometers.
ACM SigKDD Explorations Newsletter, 12(2):74–82.
Lichman, M. (2013). UCI machine learning repository.
http://archive.ics.uci.edu/ml. University of California,
Irvine, School of Information and Computer Sciences.
Lockhart, J. W., Pulickal, T., and Weiss, G. M. (2012).
Applications of mobile activity recognition. In 2012
ACM Conference on Ubiquitous Computing, Ubi-
Comp ’12, pages 1054–1058, New York, NY, USA.
Micucci, D., Mobilio, M., and Napoletano, P. (2017). Uni-
mib shar: a new dataset for human activit y recognition
using acceleration data from smartphones. arXiv pre-
print arXiv:1611.07688v2.
Reiss, A. and Stricker, D. (2012). Introducing a new bench-
marked dataset for activity monitoring. In Wearable
Computers (ISWC), 2012 16th International Sympo-
sium on, pages 108–109. IEEE.
Shoaib, M., Bosch, S., Incel, O. D., Scholten, H., and Ha-
vinga, P. J. (2014). Fusion of smartphone motion
sensors for physical activity recognition. Sensors,
14(6):10146–10176.
Siirtola, P. (2015). Recognizing human activities based on
wearable inertial measurements: methods and appli-
cations. Doctoral dissertation, Department of Com-
puter Science and Engineering, University of Oulu,
(Acta Univ Oul C 524).
Siirtola, P., Koskim¨aki, H., and R¨oning, J. (2016). Personal
models for ehealth-improving user-dependent human
activity recognition models using noise i njection. In
Computational Intelligence (SSCI), 2016 IEEE Sym-
posium Series on, pages 1–7. IEEE.
Siirtola, P. and R¨oning, J. (2012). Recognizing hu-
man activities user-independently on smartphones ba-
sed on accelerometer data. International Journal
of Interactive Multimedia and Artificial Intell igence,
1(5):38–45.
Siirtola, P. and R¨oning, J. (2013). Ready-to-use activity re-
cognition for smartphones. In Computational Intelli-
gence and Data Mining (CIDM), 2013 IEEE Sympo-
sium on, pages 59–64. IEEE.
Stisen, A. , Blunck, H. , Bhattacharya, S. , Prentow, T. S.,
Kjærgaard, M. B., Dey, A., S onne, T., and Jensen,
M. M. (2015). Smart devices are different: Asses-
sing and mitigatingmobile sensing heterogeneities for
activity recognition. In Proceedings of the 13th ACM
Conference on Embedded Networked Sensor Systems,
pages 127–140. ACM.
Ugulino, W., Cardador, D., Vega, K., Velloso, E., Milidi´u,
R., and Fuks, H. (2012). Wearable computing: Acce-
lerometers data classification of body postures and
movements. In Advances in Artificial Intelligence-
SBIA 2012, pages 52–61. Springer.
Zhang, M. and Sawchuk, A. A. (2012). Usc-had: A
daily activity dataset for ubiquitous activity recog-
nition using wearable sensors. I n ACM Internatio-
nal Conference on Ubiquitous C omputing (Ubicomp)
Workshop on Situation, Activity and Goal Awareness
(SAGAware), Pit tsburgh, Pennsylvania, USA.
Experiences with Publicly Open Human Activity Data Sets - Studying the Generalizability of the Recognition Models
299
