
Detecting Influence in Wisdom of the Crowds
Luís Correia
1
, Sofia Silva
1
and Ana Cristina B. Garcia
2
1
BioISI-Ciências, Universidade de Lisboa, Campo Grande 1749-016, Lisboa, Portugal
2
UNIRIO, Rio de Janeiro, RJ, Brazil
Keywords:
Collective Intelligence, Wisdom of the Crowds.
Abstract:
The wisdom of the crowds effect (WoC) is a collective intelligence (CI) property by which, given a problem,
a crowd is able to provide a solution better than that of any of its individuals. However, WoC is considered
to require that participants are not priorly influenced by information received on the subject of the problem.
Therefore it is important to have metrics that can identify the presence of influence in an experiment, so that
who runs it can decide if the outcome is product of the WoC or of a cascade of individuals influencing others.
In this paper we provide a set of metrics that can analyse a WoC experiment as a data stream and produce a
clear indication of the presence of some influence. The results presented were obtained with real data from
different information conditions, and are encouraging. The paper concludes with a discussion of relevant
situations and points the most important steps that follow in this research.
1 INTRODUCTION
Collective intelligence (CI), defined as groups of in-
dividuals doing things collectively that seem intelli-
gent (Malone et al., 2009), offers a decision-making
paradigm to solve complex problems, which has as-
sumed a new dimension when exploiting technology,
namely the web. CI has long been used as a means
to democratically choose the citizens’ representatives
and as an economic sensor to perceive the market.
However, it has very recently become a new research
area in which researchers are still trying to under-
stand (1) the power of CI, (2) the means to conduct
the crowd to a desired process, and (3) the means to
aggregate crowd’s contribution, in order to produce a
collective result better than that of any of the partici-
pants.
CI has been used in a variety of tasks and do-
mains going from various prediction markets (Berg
and Rietz, 2003) to design new protein configura-
tion (Curtis, 2015). CI successful results have been
correlated to the size of the crowd, the heterogene-
ity of the crowd and the individuals’ opinion indepen-
dence. In general, the crowd produces better results
with more people in the crowd, more heterogeneity
among participants and more independent individu-
als’ opinions (Surowiecki, 2005).
Incentive mechanisms, such as prizes, competi-
tions or even appealing to civic obligation, have been
used to stimulate CI. Designing filters that select par-
ticipants based on their profile may guarantee hetero-
geneity within the crowd. Regarding independence
of opinions, the design of communication barriers
among individuals can be considered in some cases.
However, it is hard to guarantee barriers’ effective-
ness, or their implementation altogether, in uncon-
trolled environments.
Although herd behaviour affects any resource al-
location problem (Zhao et al., 2011), it is economy
that has devoted much attention to it since herd be-
haviour may result in macroeconomic problems, such
as creating asset price and housing price bubbles and
chain of bank bankruptcy (Shiller, 2015). For CI,
herd behaviour is considered to impair its fundamen-
tal premise of diversity (Lorenz et al., 2011), as the
quality of the final result depends on the quality of the
tip given by the leader(s) of the herd. Consequently, it
is no longer the crowd’s result, but the results from a
few amplified by the crowd. The wisdom of the crowd
effect (WoC), by which the aggregated solution of the
crowd is better than any solution of its individuals,
depends on preventing herd behaviour.
Therefore the importance of detecting influence in
WoC cannot be understated. If it can be identified
in the early stages of an experiment, the person in
charge of the procedure may take initiatives, for in-
stance to detect and correct information leaks. Even
if influence identification is only possible in advanced
Correia, L., Silva, S. and Garcia, A.
Detecting Influence in Wisdom of the Crowds.
DOI: 10.5220/0006551200170024
In Proceedings of the 10th International Conference on Agents and Artificial Intelligence (ICAART 2018) - Volume 1, pages 17-24
ISBN: 978-989-758-275-2
Copyright © 2018 by SCITEPRESS – Science and Technology Publications, Lda. All rights reserved
17

stages of the experiment, it will be important to as-
sess the quality of the result. Although there is an
intuitive feeling that revealing information about the
subject influences the crowd’s behaviour, there is no
objective metric capable of being used in runtime that
could help us measure it and subsequently to estab-
lish a threshold of decision between situations with
and without influence. With the growing possibilities
made available by technology, such as e-government,
e-commerce, and other web based social activities,
the detection of influence in CI assumes a significant
importance.
Problem Definition. Previous research on WoC has
been focused on the analysis of the final set of esti-
mations rather than on the analysis of the sequence
of contributions that form the final set. An excep-
tion is the work of King et al. (King et al., 2012) that
analyses the accuracy, computed as the difference be-
tween the median and the true value, as a function of
group size. However we want to identify influence
in WoC as the estimates are entered. To this end we
propose to analyse the sequence of contributions as a
data stream.
In this paper we present a set of metrics to de-
termine whether information was revealed during
crowdsourcing, so the crowd sourced contributions
are biased and the quality is uncertain. We con-
ducted a series of controlled experiments using the
Amazon Mechanical Turk. We divided the crowd in
four groups submitted to different information display
conditions. Results indicate the potential usefulness
of our metrics that will allow to certify the quality of
a crowd sourced solution to complex problems.
2 RELATED WORK
“Life is about choices”. This is a popular saying that
reminds us that we are constantly choosing among
options. The more you know, the more comfortable
you feel to decide. However, the amount of available
information became humanly unmanageable with the
technological advances of the Internet. Either to
speed up our evaluation process or to deal with incom-
plete information, we constantly rely on the opinion
of others, for instance in the form of reviews of prod-
ucts or services. Certainly, this fact has motivated or
boosted research and development on recommenda-
tion systems as part of companies’ marketing strat-
egy to influence buyers (Chevalier and Mayzlin, 2006;
Pathak et al., 2010; Kempe et al., 2003; Avery et al.,
1999; Smith and Linden, 2017; Schwartz, 2004).
There are studies that have shown very per-
sonal decisions being influenced by surrounding
crowd decisions, such as planning the number of
children (Banerjee, 1992; Watkins, 1990), choos-
ing employer-sponsored retirement plans (Duflo and
Saez, 2002) and personal financial investment (Kelly
and Gráda, 2000). Research on behavioural eco-
nomics has long shown herding (Banerjee, 1992) and
contrarian behaviour (Park and Sgroi, 2012) in fi-
nance domains.
Reliable information always shed light on the de-
cision making process. However, analyzing raw ma-
terial information requires effort and expertise. Not
rarely, individuals rely on other people’s choices as
a shortcut for making their own. Besides, in com-
petitive environments, e.g. the stock market, there
is a suspicion that others may know something else
leading to a dilemma of following the flow or tak-
ing higher risks to get higher gains (Bikhchandani
et al., 1998). There are also situations in which to
reveal information is against the law, such as with per-
sonal health information (Marshall and Meurer, 2004;
Bansal et al., 2010; Gostin and Hodge Jr, 2001; An-
nas, 2003).
The individuals’ choices impact the society, as
during elections. Studies have shown the impact on
electors’ votes by disclosing opinion polls, pejora-
tively called the “bandwagon” effect (Kiss and Si-
monovits, 2014). Polls are thermometers of candi-
dates’ campaigns. They create, on voters, expec-
tations of the election outcomes. Some people go
with the flow by voting for the winning ticket, oth-
ers will use the information to strategically adjust
their vote for someone, close to what they want, with
chances to win. People may also need qualified in-
formation, such as to get experts’ opinions (Wal-
ton, 2010) in some specific matter, eventually lead-
ing individuals to follow the crowd. Independently
of the reason, knowing what others think increases
the chances of having a herd behaviour, which may
compromise the goal of obtaining a wise result from
the crowd because it kills cognitive diversity (Lorenz
et al., 2011). The influence on others grows as more
people enforces the same opinion. Each follower en-
forces previous choices creating a decision cascade
that strengths the herding behaviour, even overwrit-
ing personal guesses and intuition (Raafat et al., 2009;
Spyrou, 2013).
Herd behaviour is not desirable for the WoC ef-
fect. Consequently, identifying this condition, as
soon as possible in a collective intelligence process,
is crucial to evaluate the outcome of a crowd’s result.
Not surprisingly the first proposed metric to iden-
tify herding behaviour comes from the finance do-
ICAART 2018 - 10th International Conference on Agents and Artificial Intelligence
18

main. Lakonishok, Shleifer, and Vishny (Lakonishok
et al., 1992; Bikhchandani and Sharma, 2000) pro-
posed a metric, called LSV (see formula 1), to mea-
sure herding behaviour as the difference between the
expected number of managers buying a given stock
and the proportion of the net buyers in relation to the
total number of asset managers transacting that stock.
The same is valid for sellers. The metric requires an
expectation of the stock transaction that may not be
practical. It measures how much the selling (buying)
behaviour deviates from the expected. Wermer (Wer-
mers, 1999) proposes an evolution of the LSV, called
PCM, differentiating the trading direction (selling or
buying), but maintaining the expected behaviour re-
quirement. Christie and Huang (Christie and Huang,
1995) proposed a metric focusing on the dispersion of
the data and large price movement.
H(i) =
B(i)
B(i) + S(i)
− P(t)
− AF(i) (1)
in which:
i — stock
H(i) — herding degree, between [0..1]
B(i) — number of managers who are net buyers
of stock i
S(i) — number of managers who are net sellers of
stock i
P(t) — expected proportion of net buyers
AF(i) — expected value of H(i) on the no-herding
hypothesis
Undoubtedly, identifying herd behaviour is impor-
tant to qualify the outcome of a crowd (Barreto and
Baden-Fuller, 2006; Muchnik et al., 2013). In spite
of that, the research effort, including the finance do-
main, of coming up with a robust metric to detect
herding is still an issue (Amirat and Bouri, 2009;
Zhao et al., 2011). We propose new metrics that do
not rely upon an existing expected behaviour as base-
line. The metrics include concentration of the esti-
mates, reflected by the median of the absolute devia-
tion (MAD), monotonicity and trend, reflected by the
sums of positive and negative discrete derivatives of
the median and their cumulative sum.
1
1
"cumulative statistics" (average, median, ...) some-
times are also called "running statistics" and it means that
the statistics is computed over the dataset entered so far and
updated as each new data point is entered.
3 METRICS OF INFLUENCE IN
WOC
3.1 Premisses for the Metrics
A WoC case where participants do not receive in-
formation on the problem, for instance hints on the
true value or on previous contributions, should pro-
duce some distribution of results reflecting the diver-
sity of the participants population. Moreover, the se-
quence of contributions should form a stationary pro-
cess, meaning that the distribution properties should
not vary along the sequence. Therefore influence in
WoC should reflect on a data stream of estimates with
changes along the series in the underlying distribu-
tion. Typically we should expect influence exerted on
the participants to produce a concentration (decrease
in diversity) of the estimates and, in general, changes
in the form of trends.
The specificity of influence detection led us to
devise metrics tailored for this particular problem.
Given that population diversity is considered one of
the vantage points of WoC, outliers should not be dis-
carded. Therefore we chose metrics that are robust
to outliers, otherwise too much noise could be intro-
duced by the appearance of a single outlier. This led
us to work with aggregation and dispersion measures
based on the median and on the median absolute de-
viation (MAD)
2
3.2 Three Types of Metrics
In order to obtain a robust set we devised metrics
of three types analysing different aspects of the data:
concentration, monotonicity and trend. With the pur-
pose of noise reduction, all measures are computed on
a size n moving window over the data supplied by the
participants. In each iteration the window is shifted
by s points, Also, metrics are only computed after an
offset o to avoid the initial transient.
• Concentration (C): To obtain C we first calcu-
late the MAD normalised by the cumulative me-
dian
3
. Then C is computed as the percentage of
these points that has a low value, meaning below
a defined threshold t. A high value of C means
that estimates are basically concentrated around
the median.
2
MAD is the median of the absolute values of the devi-
ation of the estimates from the median.
3
we verified that it does not significantly differ from a
normalisation by the total median, and in this way the mea-
sure can be produced any time along the process.
Detecting Influence in Wisdom of the Crowds
19

• Monotonicity (M): We take the signal of the dis-
crete derivative of the cumulative median, and
M is computed as the percentage of consecutive
points with identical signal.
• Trend Indicators (T
−
, T
+
, T
t
): From the discrete
derivative of the cumulative median we obtain the
sum of its negative values T
−
, the sum of its pos-
itive values T
+
, and the sum of all the values T
t
,
and then we normalise these results (as a percent-
age) by the cumulative median.
The effect of influence on participants in a CI solu-
tion is characterised by a quick concentration of opin-
ions around some value, which means that the disper-
sion of opinions that characterises and is the main ad-
vantage in WoC, is lost. The final result is very much
dependent on the triggering conditions and in prac-
tice influenced CI experiments produce poorer results.
Consequently the concentration metric should be the
most important indicator of the presence of influence
in CI. If the concentration is high we must not expect
the WoC effect.
However if the concentration is low or even mod-
erate we may still be in presence of influence that
may be visible by a significant variation of the in-
coming estimates. This may occur due to the fact
that information leading to the establishment of influ-
ence may be released at different moments and may
even be of diverse quality. Therefore we may notice at
some point a significant shift of opinions, more or less
sudden, that reduces concentration. Overall, a crowd
shifting opinion can generally be attributed to some
form of influence. This situation can be characterised
by a high monotonicity and a trend in the data stream
of contributions.
The decision on existence of influence in a data
stream of contributions of a CI set up can be expressed
by Algorithm 1.
Algorithm 1: CI Influence Detection.
if high concentration then
influence present
else
if high monotonicity then
if trend then
influence present
else
no influence
end if
else
no influence
end if
end if
4 EXPERIMENTAL SETUP
We conducted an analysis of data obtained in a con-
trolled experiment to test the validity of our metrics.
A brief description of the experiment follows, and
further details can be obtained in (Silva and Correia,
2016; Silva, 2016). We deliberately chose a problem
with a numeric answer in the domain of the natural
numbers, that an average adult is able to solve within
the same order of magnitude of the correct result. In
this way the analysis of results is simplified and we do
not need prior selection process of the participants.
The experiment was made on-line using the Ama-
zon Mechanical Turk (AMT) to run it. A jar of jelly
beans was presented to the subjects in two pictures,
with a top view and a frontal view, and they were
asked to estimate the number of jellybeans in the jar.
A total of 380 subjects participated. Each subject was
randomly assigned to one of four groups with a spe-
cific type and amount of information provided prior
to asking her to produce the estimate. To promote
motivation of the subjects to provide a best effort at-
tempt, important for WoC to be successful, the best 3
answers had a small bonus.
4
The four groups are characterised as follows:
• Group Zero: No information was provided.
• Group Bestr: Five random estimates out of the ten
best produced by the previous participants. Ex:
"Based on all the guesses of other participants, the
closest guesses so far are (in no particular order):
3154...3136...3136...3129...3123".
• Group Bin: The bin with more estimates, of the
previous participants, was indicated. For each in-
dividual the interval between the lowest and the
highest previous estimates is divided in 10 bins of
identical width and the bin containing more esti-
mates is identified. The lower and upper limits of
that bin are then indicated to the subject with the
information that most estimates fall in that inter-
val. Ex: "Based on all the guesses of other par-
ticipants, the guesses between 200 and 4000 were
the most common".
• Group All: All the previous estimates are pre-
sented in a graphical form as points in an hori-
zontal axis (see Fig. 1).
The data set of estimates collected was analysed
in terms of its main statistical properties and the re-
sults are presented in Table 1. We confirm the gen-
eral assumptions presented in section 3.1, namely that
outliers have a strong influence in mean and standard
deviation, while median and MAD are robust to them.
4
of 10 USD, duly announced in the experiment’s inter-
face.
ICAART 2018 - 10th International Conference on Agents and Artificial Intelligence
20
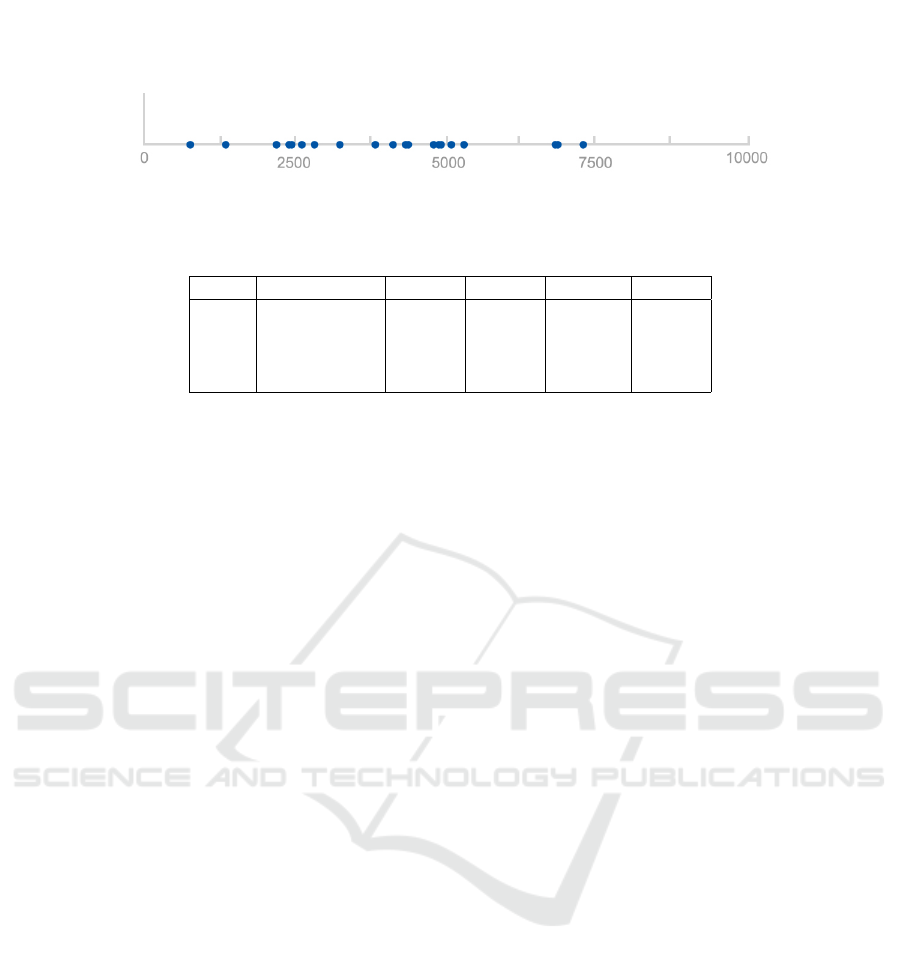
Figure 1: Example of the information presented to a subject of the All group. For each subject all the previous estimate values
of the All group are presented as blue points in a linear scale horizontal axis.
Table 1: Statistical characterisation of the jellybeans experiment data set.
#Participants Mean σ Median MAD
Zero 98 3372.5 6538.5 1336.5 1100.1
Bestr 105 3636.4 9726.9 2850 1260.2
Bin 86 3475.8 2420.3 3484.5 1359.5
All 91 3387.3 5800.9 2160 1845.8
Regarding the information content provided, it
should be noticed that only group, Bestr, gives infor-
mation relative to the true value. However, this does
not necessarily guarantee a better final estimate since
a quick initial convergence may lead the crowd to set-
tle around a value away from the true one (Silva and
Correia, 2016).
As to the aggregation of the provided information,
only group All shows information in a completely
non-aggregated way, since all the previous values are
presented (see Fig. 1). Aggregation of information in
Group Bin is high although not as high as a single
central value (average or median). Group Bestr com-
bines a strong aggregation around the true value (best
10 estimates), with a little noise, due to the random
choice of the 5 estimates presented.
Finally a word on the form information is pre-
sented. While in groups Bestr and Bin it is presented
as text in alphanumeric form, in group All it is pre-
sented in graphical form. Although all previous es-
timates are presented in the latter group, we should
take into account that the graphical representation, al-
though relatively simple, may not be evident to all
subjects.
5 RESULTS AND DISCUSSION
The application of the influence metrics described
above to the jellybeans dataset has produced the re-
sults in Table 2. We used a window length n = 10
and a window shift s = 1 to significantly reduce noise
while allowing metrics to be used with smaller data
sets (in the order of 40 points) if needed. The offset
is o = 10 so that we have enough data points to fill
the first window. We used a threshold t = 1/3 to clas-
sify estimates concentrated around the median. The
remainder of this section discusses the four scenarios
in the light of our three metrics.
5.1 The Zero Scenario
In this scenario the metrics clearly indicate that indi-
viduals had no kind of information about the problem
they had to solve. Concentration metric is very low,
much below 50%, clearly placing this scenario in the
typical characteristics of WoC, that is with high dis-
persion of estimates. Nevertheless, according to Al-
gorithm 1, in this case we can not produce a conclu-
sion based only on concentration not being high. We
need to observe the monotonicity score. The latter
presents a medium value (47%). Since it is not high
we additionally need to evaluate if there is a trend in
the estimates. The T
+
and T
−
present values relatively
similar (both with high absolute values and their dif-
ference T
t
well below those values) indicating there
was no tendentious behaviour towards high nor low
values. Consequently, from Algorithm 1 we infer that
data is bias free. It shows typical WoC properties with
no clear tendency on the individuals’ estimates. This
allows us to conclude that the crowd is under no in-
fluence.
5.2 The Bestr Scenario
The concentration metric is very high, much above
50%, clearly showing participants in this scenario as
being influenced (see Algorithm 1). Consequently,
the crowd contribution rapidly converges to the region
of the tips being revealed. In the Bestr case, partici-
pants knew the information revealed was among the
closest (10 estimates) to the right answer. Since we
ran a true information experiment, all data is genuine
and therefore the revealed information had a high rep-
utation. It may be similar to recognising a high exper-
tise in someone who tips-off on some difficult sub-
ject. Although the decision is positive regarding the
presence of influence, it is interesting to observe the
other measures. Monotonicity also presented a high
Detecting Influence in Wisdom of the Crowds
21

Table 2: Influence metrics results (jellybeans dataset) with n = 10, o = 10, s = 1, and t = 1/3 (see section 3 for details on the
metrics).
Concentration Monotonicity T
−
T
+
T
t
Zero 24% 47% −658% 808% 151%
Bestr 88% 82% −27% 177% 150%
Bin 85% 56% −136% 128% −8%
All 42% 61% −222% 200% −23%
score reflecting that participants were following the
crowd tendency. And this is further confirmed by
the tendency of increasing estimates as indicated by
a high value of T
+
compared to T
−
(the difference T
t
is similar to T
+
. The three measurements are consis-
tent in the information provided in this scenario: 1)
data is biased, 2) bias was towards increasing initial
estimates. In other words, the crowd seems to have
started producing low estimate values and soon got
influenced by the tips to increase their estimates.
5.3 The Bin Scenario
As in Bestr, the Bin scenario presents a high concen-
tration metric, much above 50%, clearly a scenario
with influenced participants (see Algorithm 1). In the
Bin case, participants knew the most popular bin. The
influence here is a bit different. Instead of a reputa-
tion information, people were looking at the voice of
the crowd. The type of influence here is of the type
following the flow. Consequently, the collective re-
sult soon converges towards the region of the most
frequent bin. Taking a look at the other two measures
we notice tha the monotonicity presented a medium
score reflecting that participants do not get a precise
clue but an interval where estimates will tend to fall.
Consistently, there is no definite trend on estimates
since T
+
and T
−
present similar values (their differ-
ence is comparatively low). In this situation, the three
measurements show us that: 1) data is biased, 2) there
is no noticeable global steady movement of the crowd
estimates. In other words, the crowd got influenced
by the crowd, although this did not result in signifi-
cant changes of the initial estimates.
5.4 The All Scenario
In this scenario the concentration metric presents a
medium value (42%). In such case, the concentration
value not being high, we need to evaluate the mono-
tonicity, which presents a medium value (61%). Fi-
nally the trend is virtually non-existent, with similar
absolute values of T
+
and T
−
(low difference between
them T
t
). With these measures we conclude (Algo-
rithm 1) that there is no influence. The data presented
to participants, as illustrated in Fig. 1, does not seem
to have provided significant tips. We notice that T
+
and T
−
have lower values than in the Zero scenario,
which is consistent with the higher concentration in
the All scenario. Consequently, the metrics lead us to
infer that data is bias free, although to a lesser extent
than in Zero scenario. In other words, data is within
typical WoC properties.
6 CONCLUSIONS
We have proposed and tested a set of metrics to detect
bias due to information revelation in a collective intel-
ligence decision-making process. The combination of
three metrics, concentration, monotonicity and trend,
clearly shows the different behaviour of the crowd un-
der distinct situations of information provided to the
participants. Additionally, they allow to explain the
manner in which influence is been carried, and they
can be used in runtime of the experiment, producing
results as the successive estimates are entered. Con-
centration metric well above 50% clearly defines the
scenario as under the influence and a low concentra-
tion clearly situates the scenario in the WoC situation.
In case concentration is intermediate, monotonicity
and tendency metrics come into play to understand
the influence process, and a high value of both indi-
cates influence.
Next steps will focus on applying these metrics to
more datasets and refine the metrics interpretation for
consistent results. To this end, more detailed quan-
tification and qualification of the information used
should also be studied. We need to assess the min-
imum amount of estimates necessary to produce an
estimate. With the data used in this work we obtain
results with good approximation from 40 estimates
onwards. However the experiment we ran has a well
contained domain, natural numbers and a problem
that is within the capabilities of an average citizen. In-
creasing problem complexity in terms of the domain
and skills needed may have different requirements in
terms of the number of estimates, size of aggregation
subgroups and even in results interpretation.
We will also investigate the reasons for the results
obtained in the All scenario. The metrics are consis-
tent with the aggregation of the information provided.
ICAART 2018 - 10th International Conference on Agents and Artificial Intelligence
22

A non-aggregated information is rather different from
the true value hints in the Bestr scenario and the most
popular interval in the Bin scenario. However the rea-
sons for it being not perceptible to the point of the re-
sults being similar to a no-information scenario need
further investigation. It may happen that the amount
of data becomes simply too large for the participants
to integrate and use as a meaningful hint. They need
to look at and infer mean, medium, extreme values
and other statistical measurements. Maybe the bonus
payment to the Mechanical Turk workers did not re-
ward the extra cognitive effort required to obtain the
hint. Consequently, workers may have ignored the
hint and act as if no information was displayed. We
plan to repeat this experiment varying the amount of
payment to confirm this. Also, a textual form of the
previous estimates can replace the graphic to evalu-
ate if the form of representation plays a role in the
influence. Finally we want to assess the power of the
metrics in detecting influence as soon as possible in
the data stream. This will be important to enable the
expansion of CI experiments, since an early detection
of influence may prevent unnecessary time and costs,
leading to an improved redesign of the experiment.
REFERENCES
Amirat, A. and Bouri, A. (2009). Modeling informational
cascade via behavior biases. Global Economy & Fi-
nance Journal, 2(2):81–103.
Annas, G. J. (2003). Hipaa regulations-a new era of
medical-record privacy? New England Journal of
Medicine, 348(15):1486–1490.
Avery, C., Resnick, P., and Zeckhauser, R. (1999). The
market for evaluations. American Economic Review,
pages 564–584.
Banerjee, A. V. (1992). A simple model of herd behav-
ior. The Quarterly Journal of Economics, 107(3):797–
817.
Bansal, G., Gefen, D., et al. (2010). The impact of personal
dispositions on information sensitivity, privacy con-
cern and trust in disclosing health information online.
Decision support systems, 49(2):138–150.
Barreto, I. and Baden-Fuller, C. (2006). To conform or
to perform? mimetic behaviour, legitimacy-based
groups and performance consequences. Journal of
Management Studies, 43(7):1559–1581.
Berg, J. E. and Rietz, T. A. (2003). Prediction markets as
decision support systems. Information systems fron-
tiers, 5(1):79–93.
Bikhchandani, S., Hirshleifer, D., and Welch, I. (1998).
Learning from the behavior of others: Conformity,
fads, and informational cascades. The Journal of Eco-
nomic Perspectives, 12(3):151–170.
Bikhchandani, S. and Sharma, S. (2000). Herd behavior in
financial markets. IMF Staff papers, pages 279–310.
Chevalier, J. A. and Mayzlin, D. (2006). The effect of word
of mouth on sales: Online book reviews. Journal of
marketing research, 43(3):345–354.
Christie, W. G. and Huang, R. D. (1995). Following the pied
piper: Do individual returns herd around the market?
Financial Analysts Journal, 51(4):31–37.
Curtis, V. (2015). Motivation to participate in an online
citizen science game: A study of foldit. Science Com-
munication, 37(6):723–746.
Duflo, E. and Saez, E. (2002). Participation and invest-
ment decisions in a retirement plan: The influence
of colleagues’ choices. Journal of public Economics,
85(1):121–148.
Gostin, L. O. and Hodge Jr, J. G. (2001). Personal privacy
and common goods: a framework for balancing under
the national health information privacy rule. Minn. L.
Rev., 86:1439.
Kelly, M. and Gráda, C. Ó. (2000). Market contagion: Ev-
idence from the panics of 1854 and 1857. American
Economic Review, pages 1110–1124.
Kempe, D., Kleinberg, J., and Tardos, É. (2003). Maximiz-
ing the spread of influence through a social network.
In Proceedings of the ninth ACM SIGKDD interna-
tional conference on Knowledge discovery and data
mining, pages 137–146. ACM.
King, A. J., Cheng, L., Starke, S. D., and Myatt, J. P. (2012).
Is the true ‘wisdom of the crowd’to copy successful
individuals? Biology Letters, 8(2):197–200.
Kiss, Á. and Simonovits, G. (2014). Identifying the band-
wagon effect in two-round elections. Public Choice,
160(3-4):327–344.
Lakonishok, J., Shleifer, A., and Vishny, R. W. (1992). The
impact of institutional trading on stock prices. Journal
of financial economics, 32(1):23–43.
Lorenz, J., Rauhut, H., Schweitzer, F., and Helbing, D.
(2011). How social influence can undermine the wis-
dom of crowd effect. Proceedings of the National
Academy of Sciences, 108(22):9020–9025.
Malone, T. W., Laubacher, R., and Dellarocas, C. (2009).
Harnessing crowds: Mapping the genome of collec-
tive intelligence. Technical report, MIT Sloan Re-
search Paper 4732-09.
Marshall, R. C. and Meurer, M. J. (2004). Bidder collusion
and antitrust law: refining the analysis of price fixing
to account for the special features of auction markets.
Antitrust Law Journal, 72(1):83–118.
Muchnik, L., Aral, S., and Taylor, S. J. (2013). Social
influence bias: A randomized experiment. Science,
341(6146):647–651.
Park, A. and Sgroi, D. (2012). Herding, contrarianism and
delay in financial market trading. European Economic
Review, 56(6):1020–1037.
Pathak, B., Garfinkel, R., Gopal, R. D., Venkatesan, R., and
Yin, F. (2010). Empirical analysis of the impact of rec-
ommender systems on sales. Journal of Management
Information Systems, 27(2):159–188.
Raafat, R. M., Chater, N., and Frith, C. (2009). Herding
in humans. Trends in cognitive sciences, 13(10):420–
428.
Detecting Influence in Wisdom of the Crowds
23

Schwartz, B. (2004). The paradox of choice: Why less is
more. New York: Ecco.
Shiller, R. J. (2015). Irrational exuberance. Princeton uni-
versity press.
Silva, S. (2016). An experiment about the impact of social
influence on the wisdom of the crowds effect. Master’s
thesis, ISCTE/IUL and University of Lisbon, Portu-
gal.
Silva, S. and Correia, L. (2016). An experiment about the
impact of social influence on the wisdom of the crowd
effect. In Proceedings of Workpedia 2016, pages 1–
10. UFF, Brazil.
Smith, B. and Linden, G. (2017). Two decades of recom-
mender systems at amazon. com. IEEE Internet Com-
puting, 21(3):12–18.
Spyrou, S. (2013). Herding in financial markets: a re-
view of the literature. Review of Behavioral Finance,
5(2):175–194.
Surowiecki, J. (2005). The wisdom of crowds. Anchor.
Walton, D. (2010). Appeal to expert opinion: Arguments
from authority. Penn State Press.
Watkins, S. C. (1990). From local to national communities:
The transformation of demographic regimes in west-
ern europe, 1870-1960. Population and Development
Review, pages 241–272.
Wermers, R. (1999). Mutual fund herding and the impact on
stock prices. the Journal of Finance, 54(2):581–622.
Zhao, L., Yang, G., Wang, W., Chen, Y., Huang, J., Ohashi,
H., and Stanley, H. E. (2011). Herd behavior in a
complex adaptive system. Proceedings of the National
Academy of Sciences, 108(37):15058–15063.
ICAART 2018 - 10th International Conference on Agents and Artificial Intelligence
24
